| Param | Original file | Final file |
|---|---|---|
| Filename | modeM0/AS1G08_047T01_9000002002_13585cztM0_level2.evt | modeM0/AS1G08_047T01_9000002002_13585cztM0_level2_quad_clean.evt |
| Size (bytes) | 80,061,120 | 17,176,320 |
| Size | 76.4 MB | 16.4 MB |
| Events in quadrant A | 450,149 | 114,780 |
| Events in quadrant B | 506,807 | 115,993 |
| Events in quadrant C | 464,988 | 114,806 |
| Events in quadrant D | 938,125 | 103,354 |
| Mode SS | |||
|---|---|---|---|
| Quadrant | BADHDUFLAG | Total packets | Discarded packets |
| A | 0 | 18 | 0 |
| B | 0 | 18 | 0 |
| C | 0 | 18 | 0 |
| D | 0 | 18 | 0 |
| Mode M0 | |||
|---|---|---|---|
| Quadrant | BADHDUFLAG | Total packets | Discarded packets |
| A | 0 | 1918 | 1 |
| B | 0 | 2090 | 1 |
| C | 0 | 1930 | 1 |
| D | 0 | 3426 | 1 |
| Mode M9 | |||
|---|---|---|---|
| Quadrant | BADHDUFLAG | Total packets | Discarded packets |
| A | 0 | 1 | 0 |
| B | 0 | 1 | 0 |
| C | 0 | 1 | 0 |
| D | 0 | 2 | 0 |
| Quadrant | Total seconds | Saturated seconds | Saturation percentage |
|---|---|---|---|
| A | 906 | 9 | 0.993377% |
| B | 906 | 5 | 0.551876% |
| C | 906 | 1 | 0.110375% |
| D | 906 | 117 | 12.913907% |
Noise dominated data is calculated using 1-second bins in cleaned event files. If a bin has >2000 counts, and if more than 50% of those come from <1% of pixels, then it is considered to be noise-dominated and hence unusable.
| Quadrant | # 1 sec bins | Bins with >0 counts | Bins with >2000 counts | High rate bins dominated by noise | Noise dominated (total time) | Noise dominated (detector-on time) | Marked lightcurve |
|---|---|---|---|---|---|---|---|
| A | 907 | 907 | 0 | 0 | 0.00% | 0.00% | 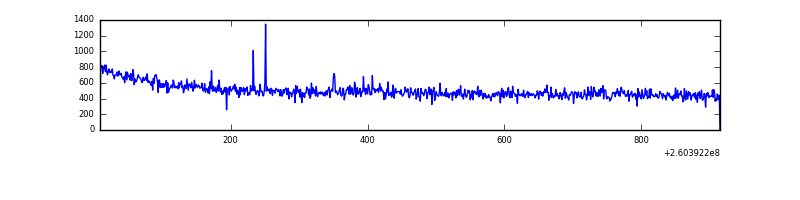 |
| B | 907 | 907 | 1 | 1 | 0.11% | 0.11% | 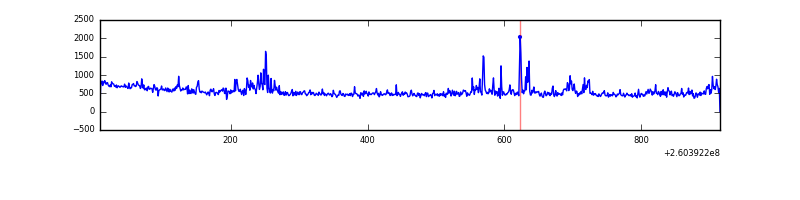 |
| C | 907 | 907 | 0 | 0 | 0.00% | 0.00% | 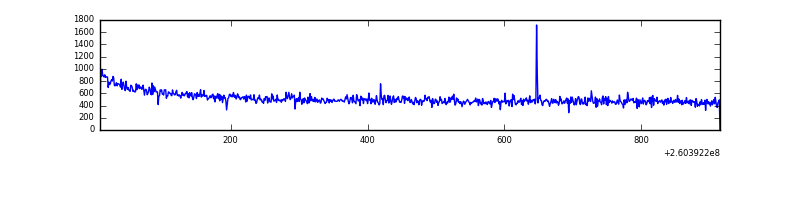 |
| D | 907 | 907 | 122 | 122 | 13.45% | 13.45% | 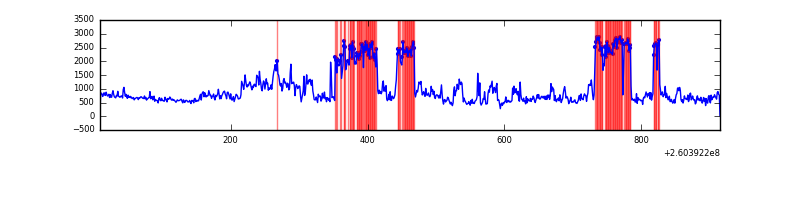 |
Top three noisy pixels from each quadrant. If the there are fewer than three noisy pixels in the level2.evt file, extra rows are filled as -1
| Pixel properties | Quadrant properties | ||||||
|---|---|---|---|---|---|---|---|
| Quadrant | DetID | PixID | Counts | Sigma | Mean | Median | Sigma |
| A | 4 | 2 | 4132 | 157.23 | 114 | 112 | 25.6 |
| A | 15 | 69 | 1772 | 64.93 | 114 | 112 | 25.6 |
| A | 1 | 162 | 1694 | 61.88 | 114 | 112 | 25.6 |
| B | 0 | 189 | 24327 | 991.57 | 113 | 110 | 24.4 |
| B | 0 | 182 | 18137 | 738.12 | 113 | 110 | 24.4 |
| B | 10 | 244 | 12586 | 510.83 | 113 | 110 | 24.4 |
| C | 3 | 233 | 41174 | 1530.33 | 107 | 107 | 26.8 |
| C | 14 | 234 | 1940 | 68.31 | 107 | 107 | 26.8 |
| C | 4 | 175 | 1543 | 53.51 | 107 | 107 | 26.8 |
| D | 5 | 222 | 370102 | 13407.23 | 105 | 101 | 27.6 |
| D | 1 | 20 | 157556 | 5705.49 | 105 | 101 | 27.6 |
| D | 2 | 234 | 3763 | 132.7 | 105 | 101 | 27.6 |
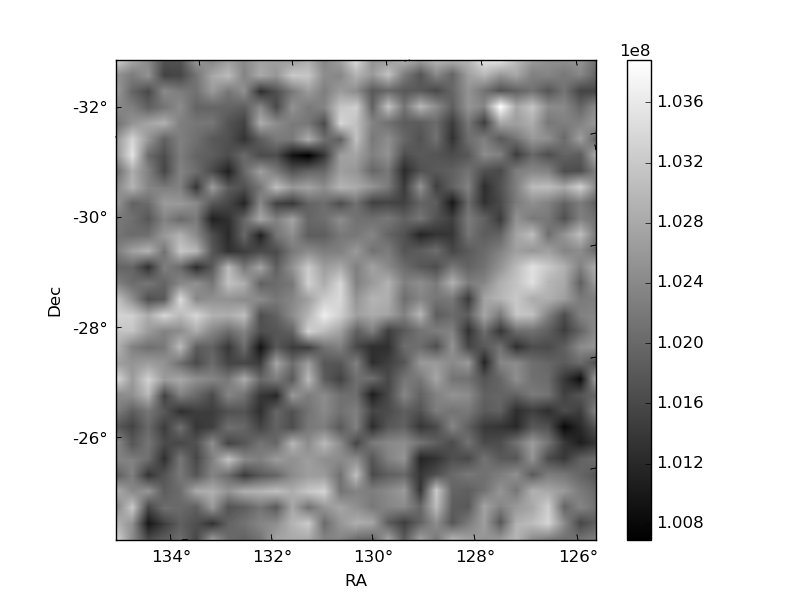
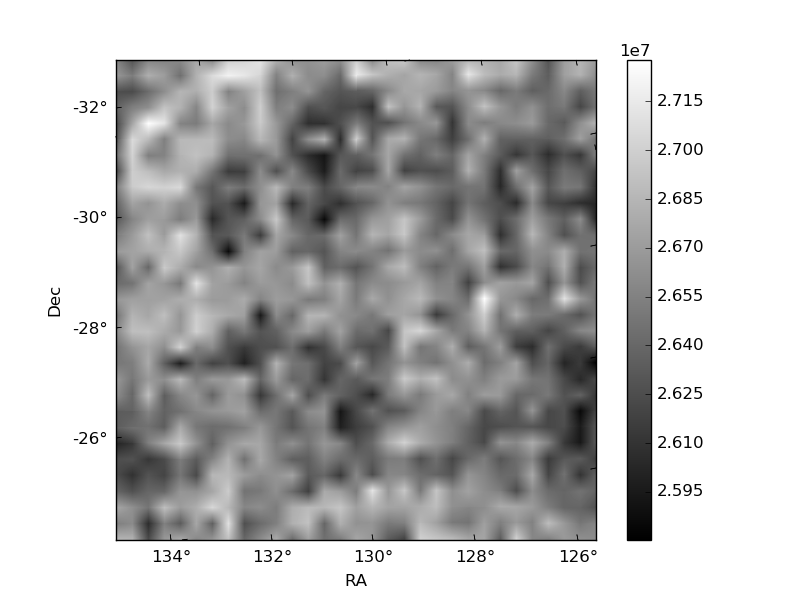
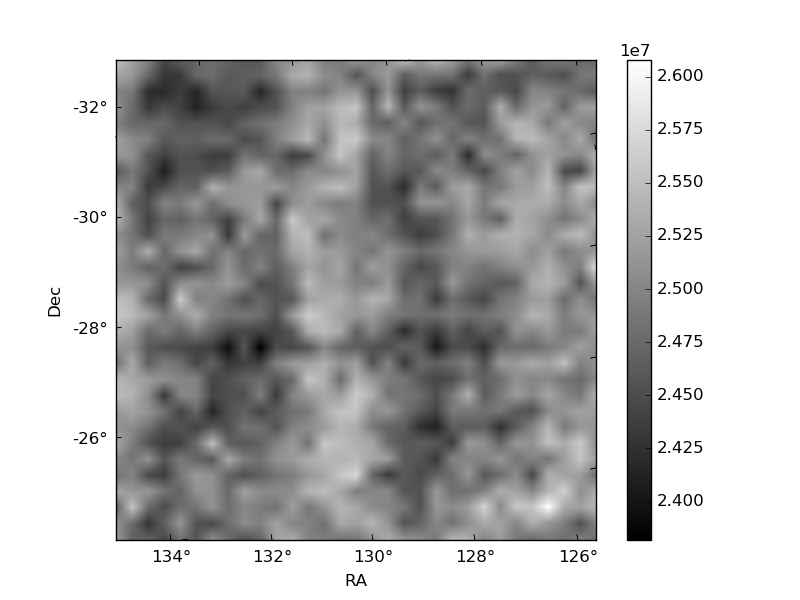
Histogram calculated using DETX and DETY for each event in the final _common_clean file
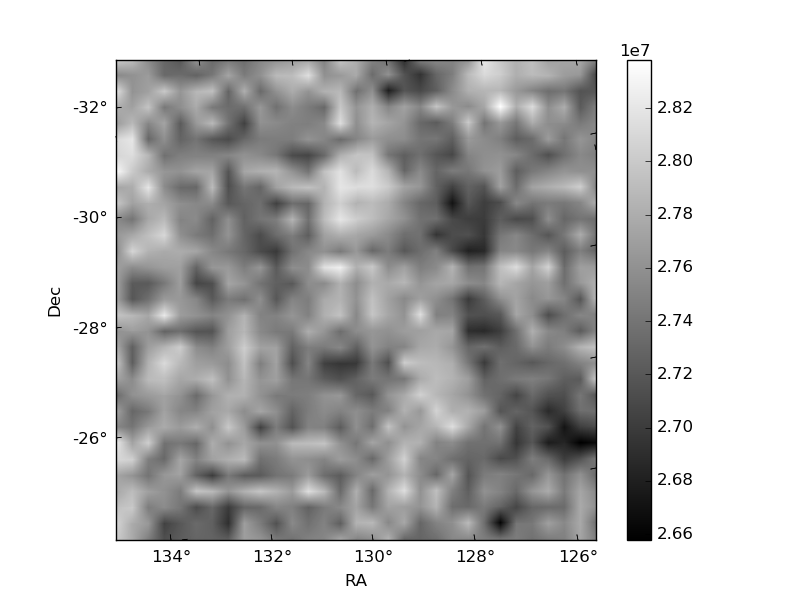
| Quadrant A | 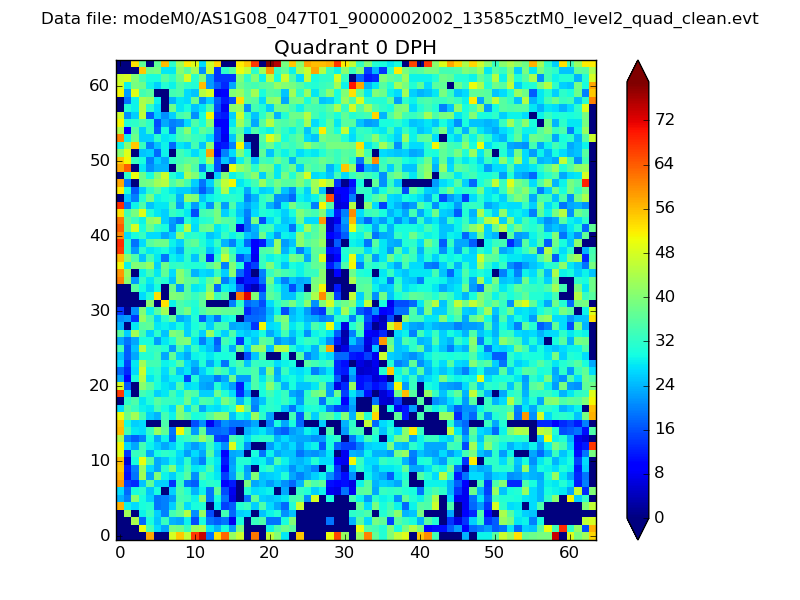 |
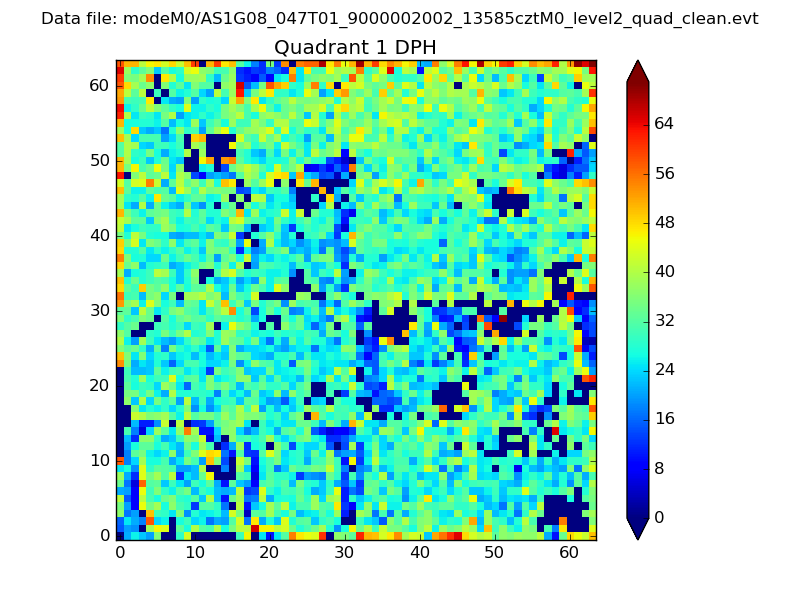 |
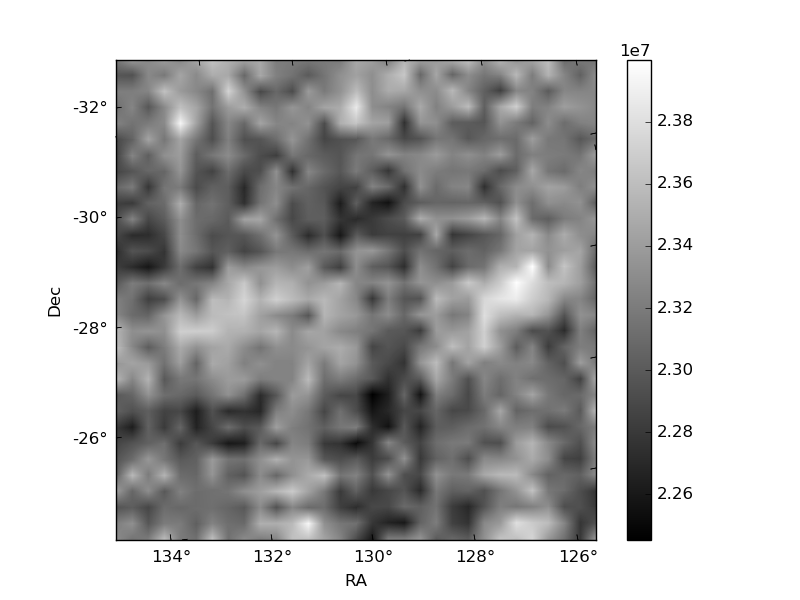
Quadrant B |
|---|---|---|---|
| Quadrant D |  |
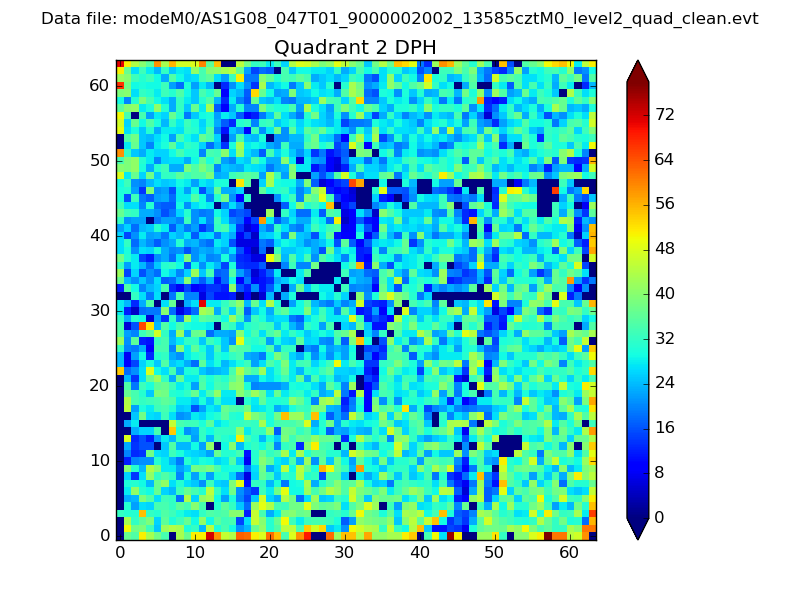 |
Quadrant C |
| Plot type | Count rate plots | Images |
|---|---|---|
| Comparison with Poisson distribution Blue bars denote a histogram of data divided into 1 sec bins. Red curve is a Poisson curve with rate = median count rate of data. |
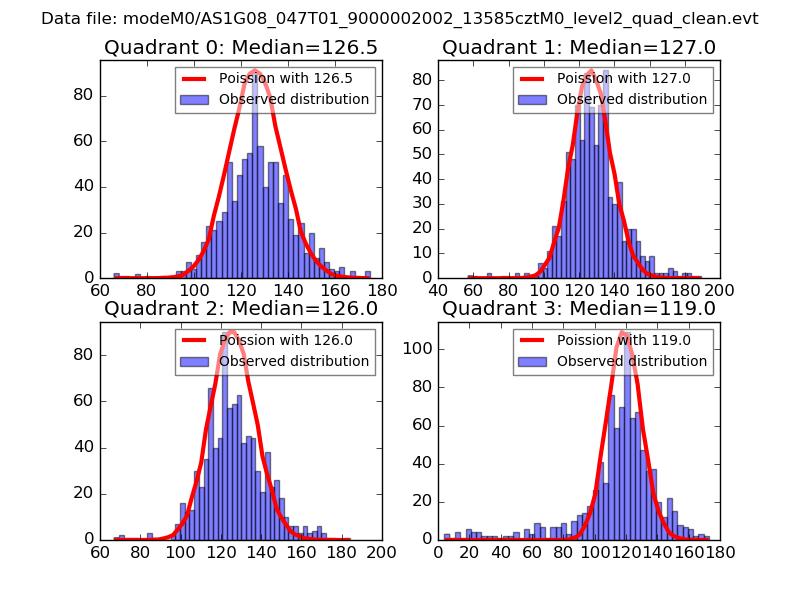 |
 |
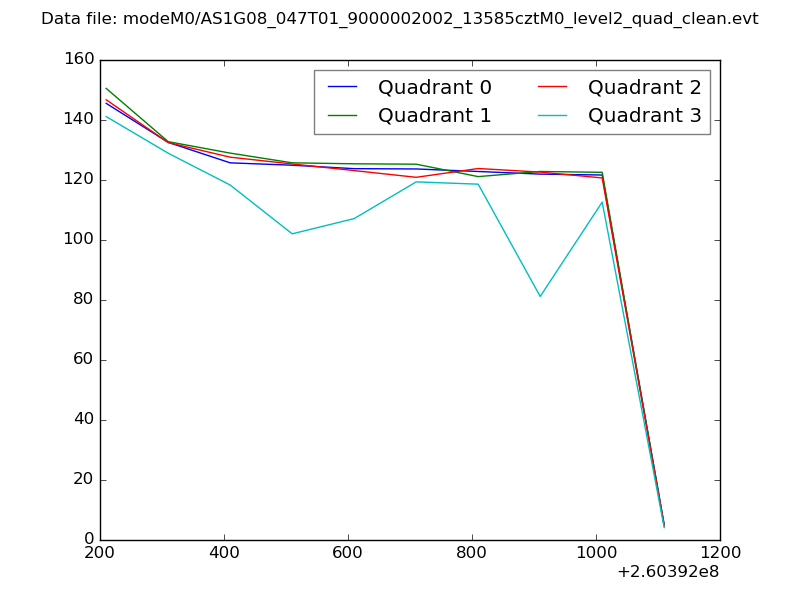
| Quadrant-wise count rates Data is divided into 100 sec bins |
 |
|
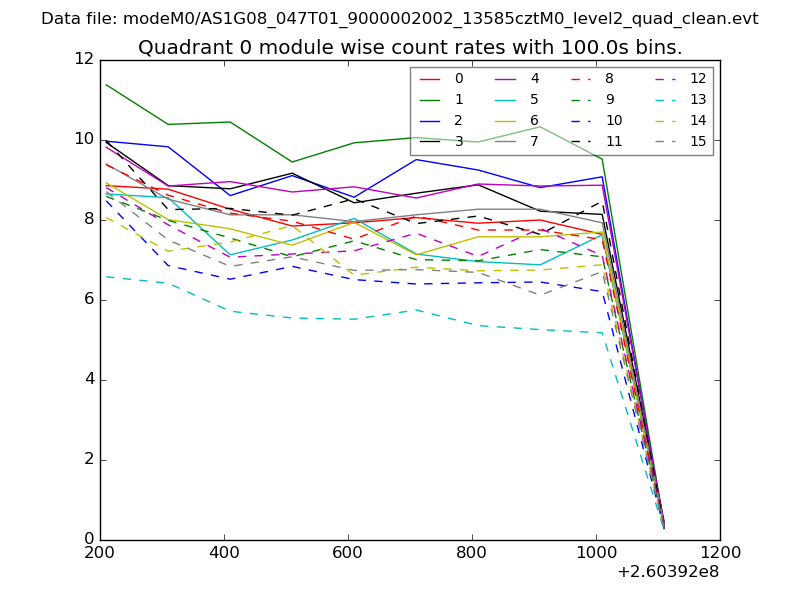
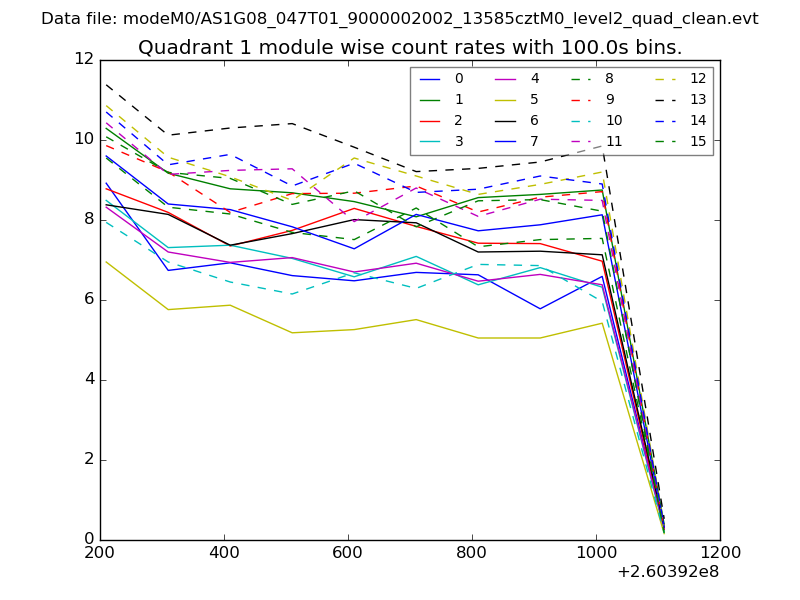
| Module-wise count rates for Quadrant A Data is divided into 100 sec bins |
 |
 |
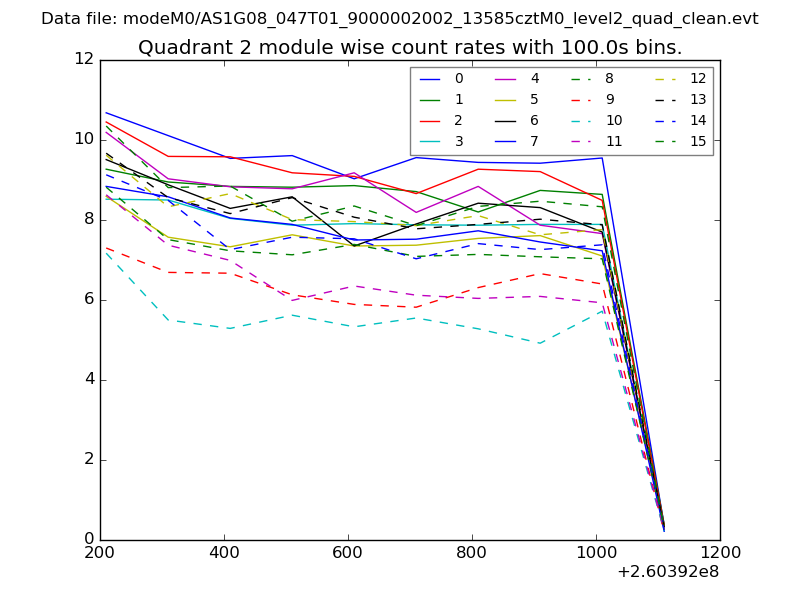
| Module-wise count rates for Quadrant B Data is divided into 100 sec bins |
 |
 |
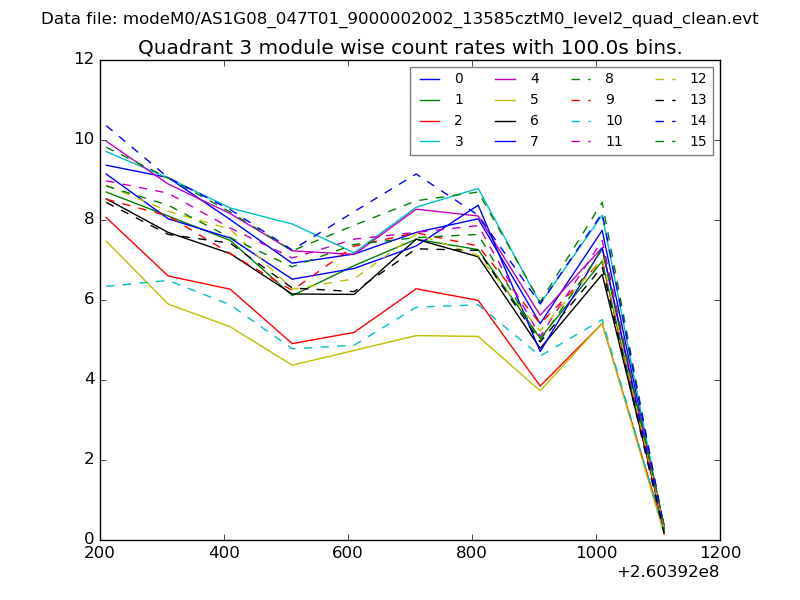
| Module-wise count rates for Quadrant C Data is divided into 100 sec bins |
 |
 |
| Module-wise count rates for Quadrant D Data is divided into 100 sec bins |
 |
 |
| Parameter | Plot |
|---|---|
| CZT HV Monitor | 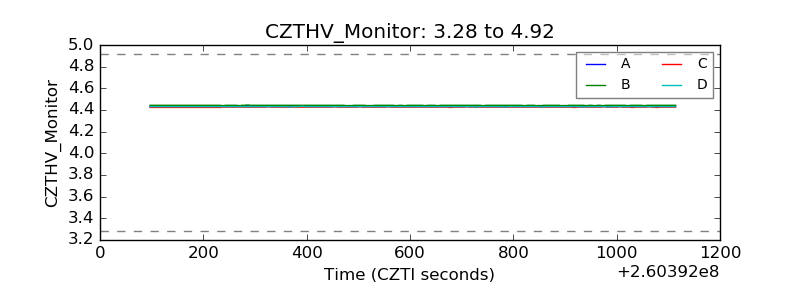 |
| D_VDD |  |
| Temperature 1 | 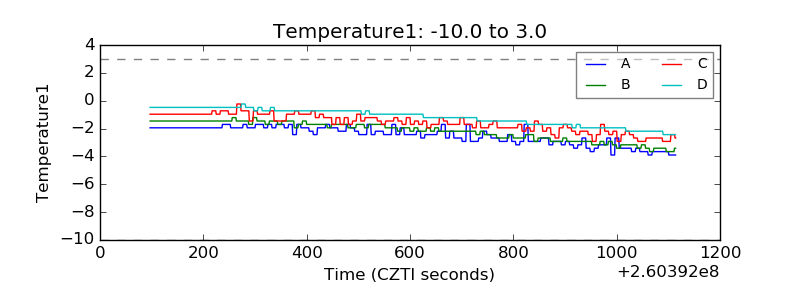 |
| Veto HV Monitor | 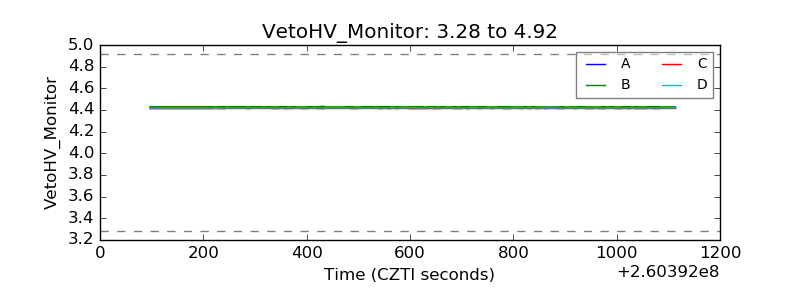 |
| Veto LLD | 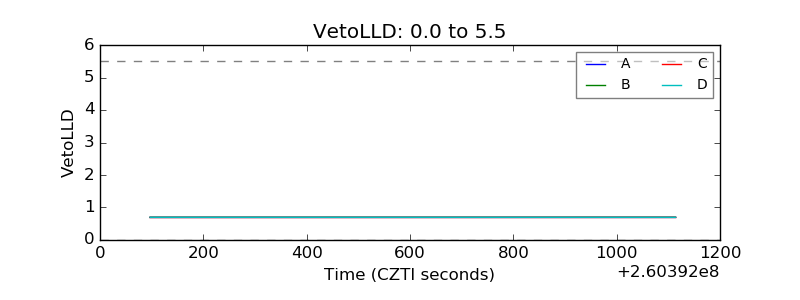 |
| Alpha Counter | 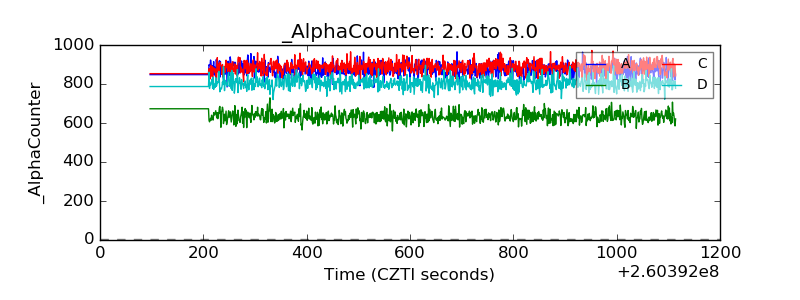 |
| _CPM_Rate | 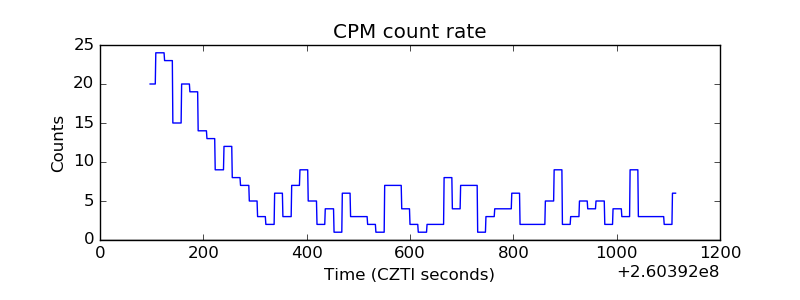 |
| CZT Counter | 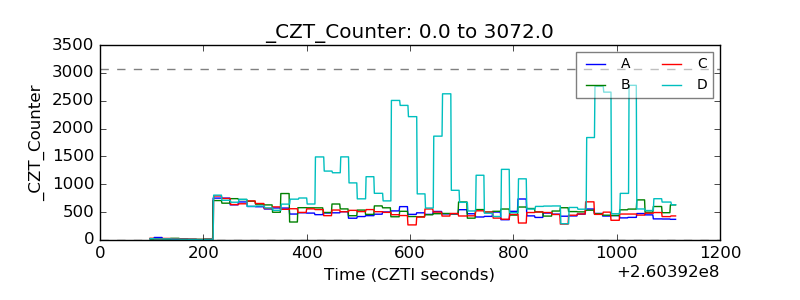 |
| +2.5 Volts monitor |  |
| +5 Volts monitor | 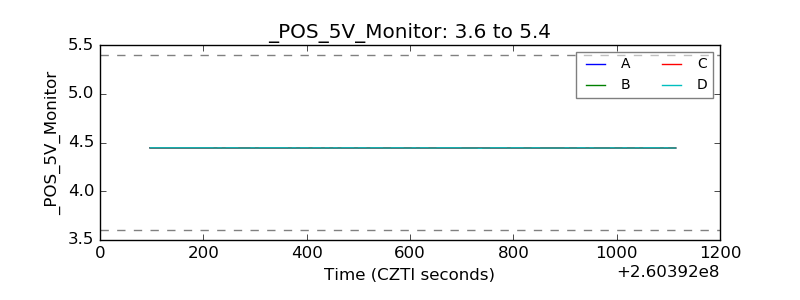 |
| _ROLL_ROT | 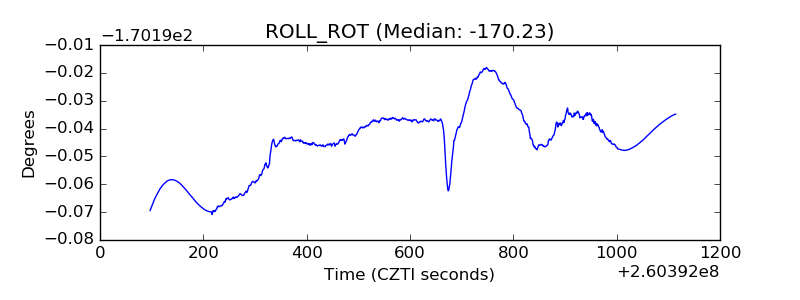 |
| _Roll_DEC | 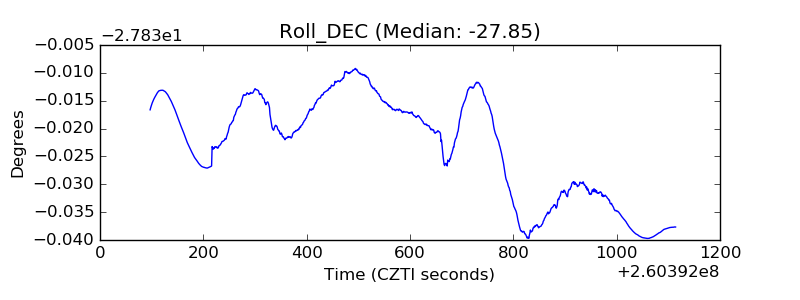 |
| _Roll_RA | 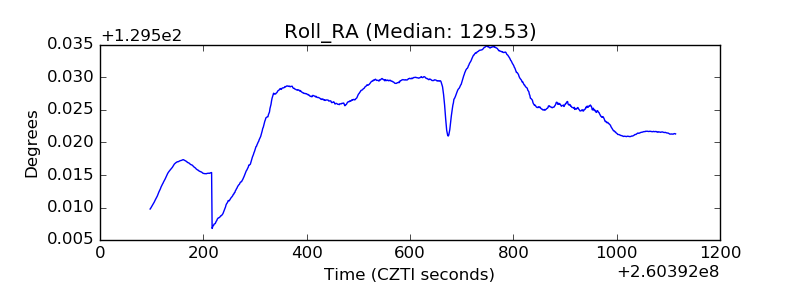 |
| Veto Counter | 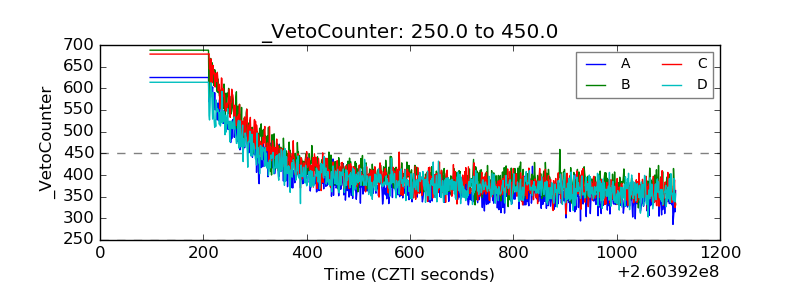 |