| Param | Original file | Final file |
|---|---|---|
| Filename | modeM0/AS1A04_193T01_9000002004_13585cztM0_level2.evt | modeM0/AS1A04_193T01_9000002004_13585cztM0_level2_quad_clean.evt |
| Size (bytes) | 1,402,096,320 | 294,704,640 |
| Size | 1.3 GB | 281.1 MB |
| Events in quadrant A | 7,519,921 | 2,041,419 |
| Events in quadrant B | 9,591,547 | 2,025,121 |
| Events in quadrant C | 7,873,001 | 2,006,812 |
| Events in quadrant D | 16,354,896 | 1,705,741 |
| Mode M0 | |||
|---|---|---|---|
| Quadrant | BADHDUFLAG | Total packets | Discarded packets |
| A | 0 | 33746 | 4 |
| B | 0 | 39446 | 3 |
| C | 0 | 33953 | 3 |
| D | 0 | 60090 | 3 |
| Mode SS | |||
|---|---|---|---|
| Quadrant | BADHDUFLAG | Total packets | Discarded packets |
| A | 0 | 338 | 0 |
| B | 0 | 338 | 0 |
| C | 0 | 338 | 0 |
| D | 0 | 338 | 0 |
| Mode M9 | |||
|---|---|---|---|
| Quadrant | BADHDUFLAG | Total packets | Discarded packets |
| A | 0 | 20 | 0 |
| B | 0 | 20 | 0 |
| C | 0 | 20 | 0 |
| D | 0 | 20 | 0 |
| Quadrant | Total seconds | Saturated seconds | Saturation percentage |
|---|---|---|---|
| A | 16615 | 108 | 0.650015% |
| B | 16615 | 715 | 4.303340% |
| C | 16615 | 76 | 0.457418% |
| D | 16615 | 4276 | 25.735781% |
Noise dominated data is calculated using 1-second bins in cleaned event files. If a bin has >2000 counts, and if more than 50% of those come from <1% of pixels, then it is considered to be noise-dominated and hence unusable.
| Quadrant | # 1 sec bins | Bins with >0 counts | Bins with >2000 counts | High rate bins dominated by noise | Noise dominated (total time) | Noise dominated (detector-on time) | Marked lightcurve |
|---|---|---|---|---|---|---|---|
| A | 18651 | 16616 | 6 | 6 | 0.03% | 0.04% | 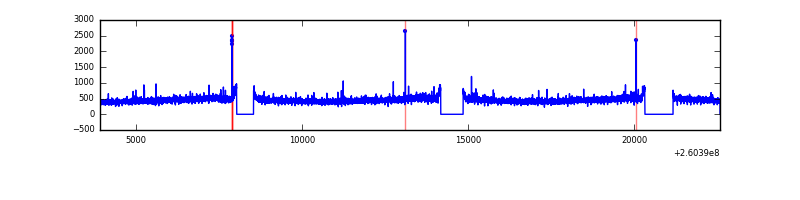 |
| B | 18651 | 16616 | 345 | 345 | 1.85% | 2.08% | 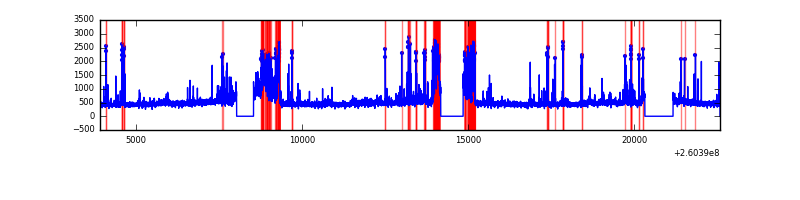 |
| C | 18651 | 16616 | 11 | 11 | 0.06% | 0.07% | 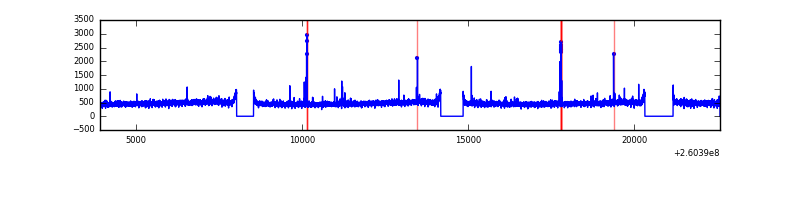 |
| D | 18651 | 16616 | 3747 | 3747 | 20.09% | 22.55% | 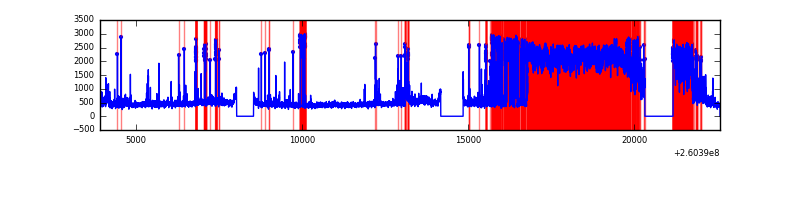 |
Top three noisy pixels from each quadrant. If the there are fewer than three noisy pixels in the level2.evt file, extra rows are filled as -1
| Pixel properties | Quadrant properties | ||||||
|---|---|---|---|---|---|---|---|
| Quadrant | DetID | PixID | Counts | Sigma | Mean | Median | Sigma |
| A | 1 | 162 | 45331 | 111.94 | 1926 | 1878 | 388.2 |
| A | 2 | 250 | 18104 | 41.8 | 1926 | 1878 | 388.2 |
| A | 0 | 226 | 17110 | 39.24 | 1926 | 1878 | 388.2 |
| B | 0 | 182 | 1422177 | 3974.4 | 1903 | 1851 | 357.4 |
| B | 3 | 64 | 210976 | 585.18 | 1903 | 1851 | 357.4 |
| B | 0 | 214 | 134531 | 371.27 | 1903 | 1851 | 357.4 |
| C | 3 | 233 | 460836 | 1068.72 | 1869 | 1875 | 429.5 |
| C | 0 | 207 | 96976 | 221.45 | 1869 | 1875 | 429.5 |
| C | 13 | 61 | 13326 | 26.66 | 1869 | 1875 | 429.5 |
| D | 13 | 122 | 6980243 | 17318.76 | 1674 | 1620 | 403.0 |
| D | 1 | 20 | 2126670 | 5273.71 | 1674 | 1620 | 403.0 |
| D | 5 | 222 | 513027 | 1269.15 | 1674 | 1620 | 403.0 |
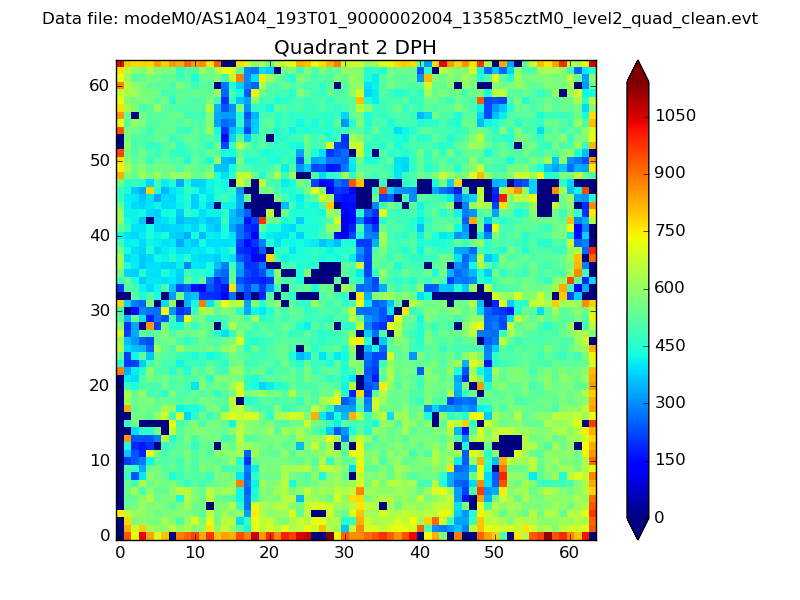
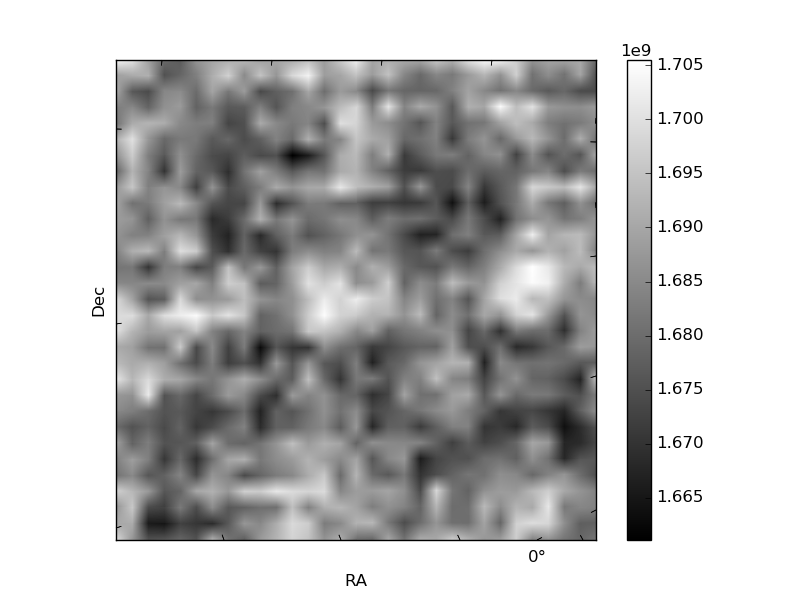
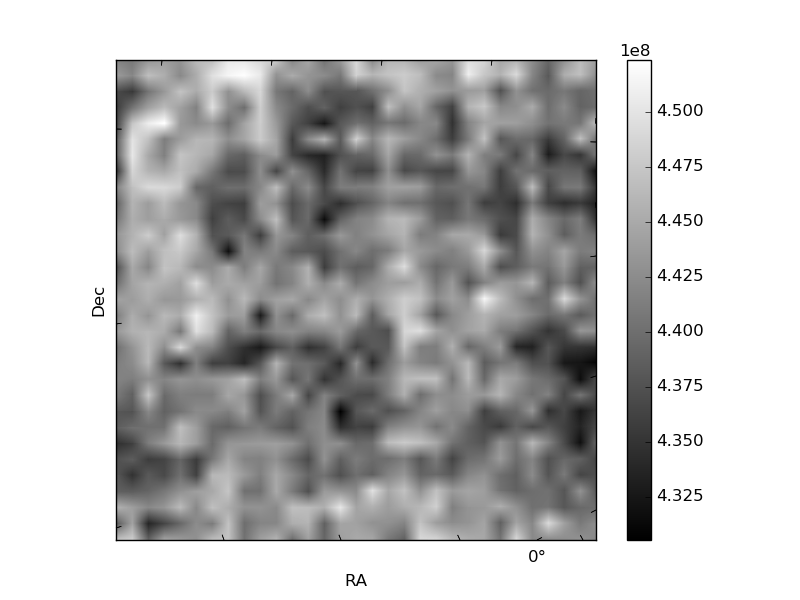
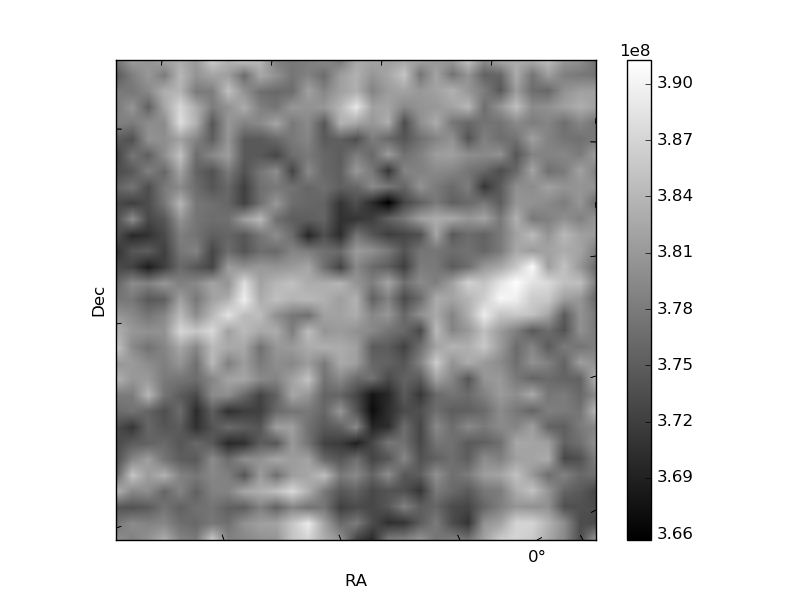
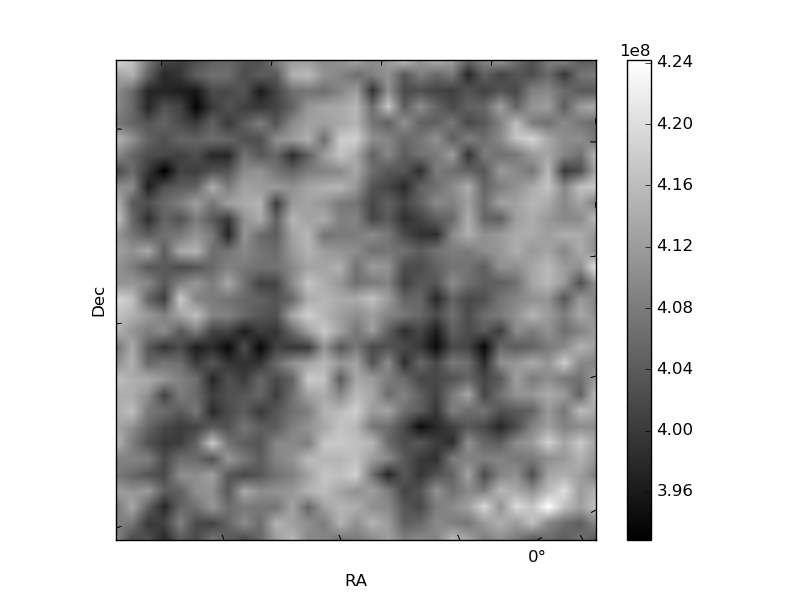
Histogram calculated using DETX and DETY for each event in the final _common_clean file
| Quadrant A | 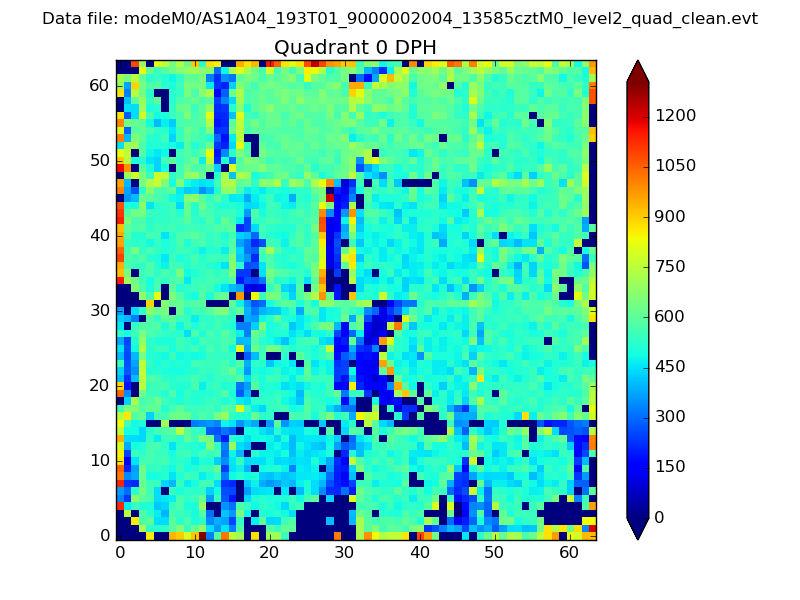 |
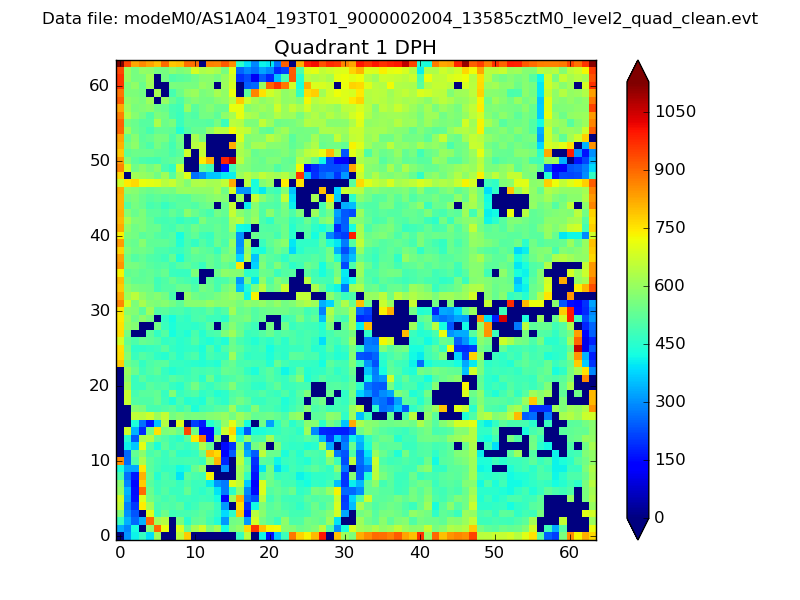 |
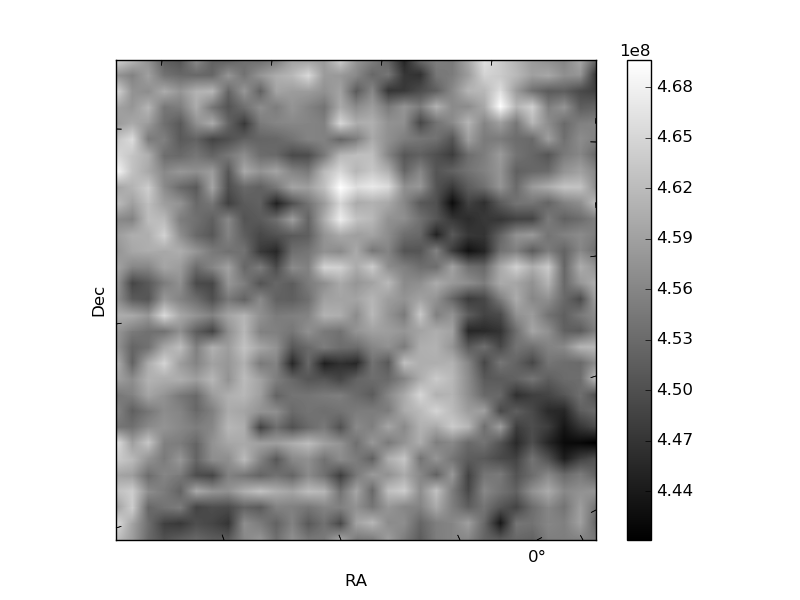
Quadrant B |
|---|---|---|---|
| Quadrant D | 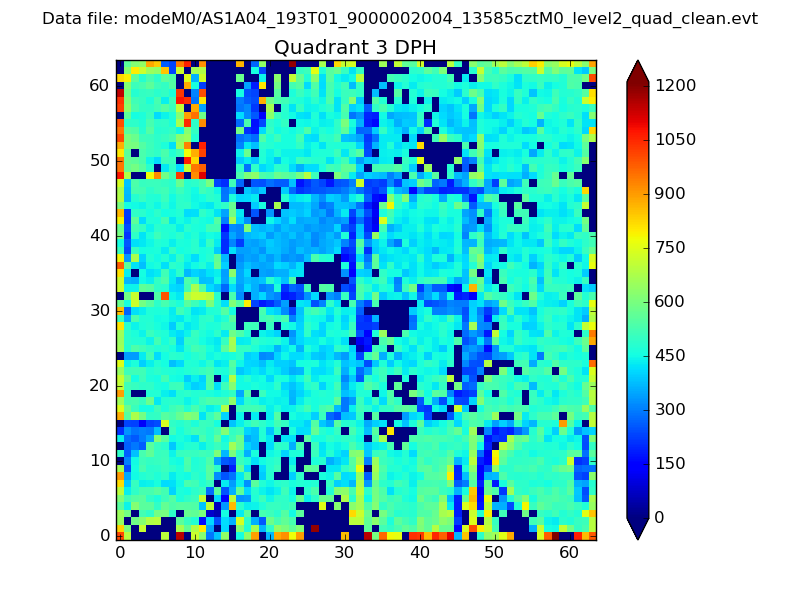 |
 |
Quadrant C |
| Plot type | Count rate plots | Images |
|---|---|---|
| Comparison with Poisson distribution Blue bars denote a histogram of data divided into 1 sec bins. Red curve is a Poisson curve with rate = median count rate of data. |
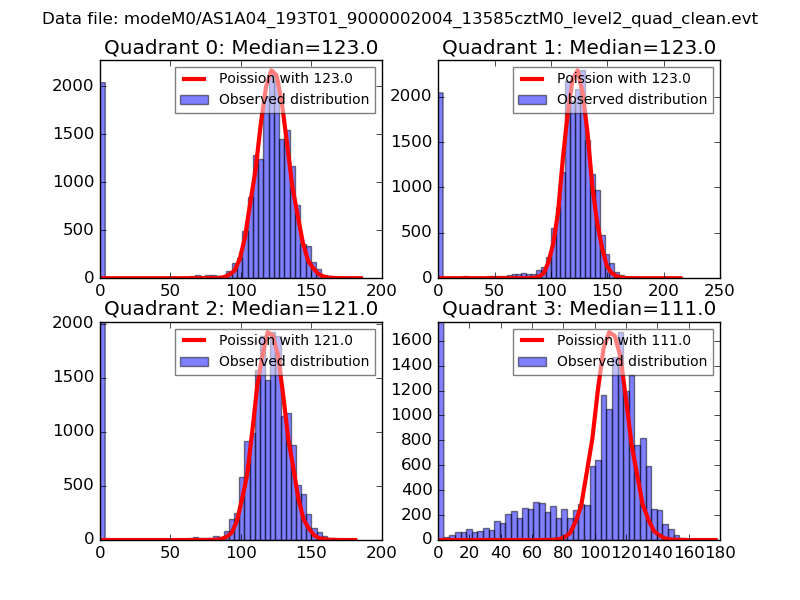 |
 |
| Quadrant-wise count rates Data is divided into 100 sec bins |
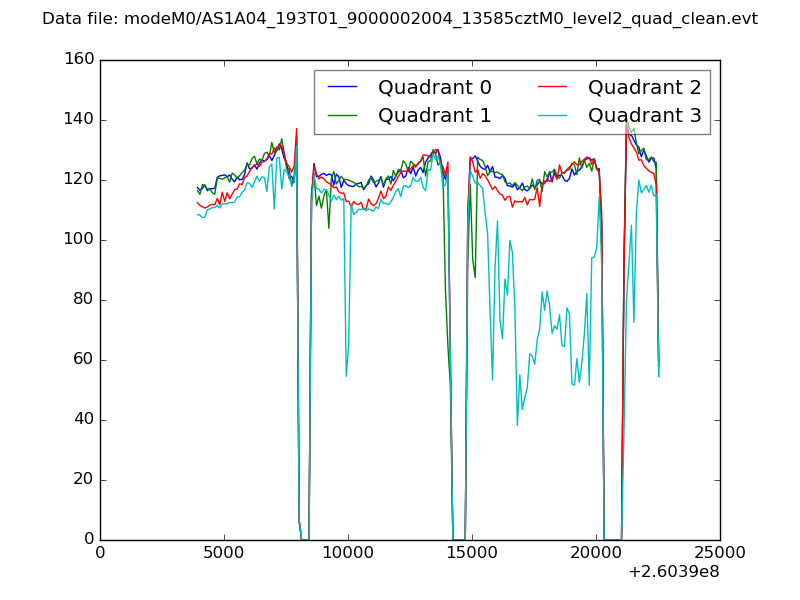 |
|
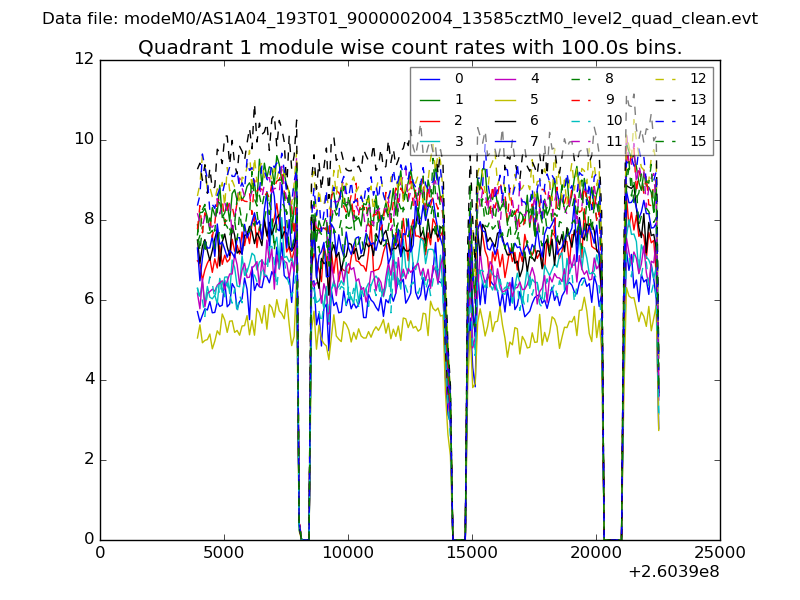
| Module-wise count rates for Quadrant A Data is divided into 100 sec bins |
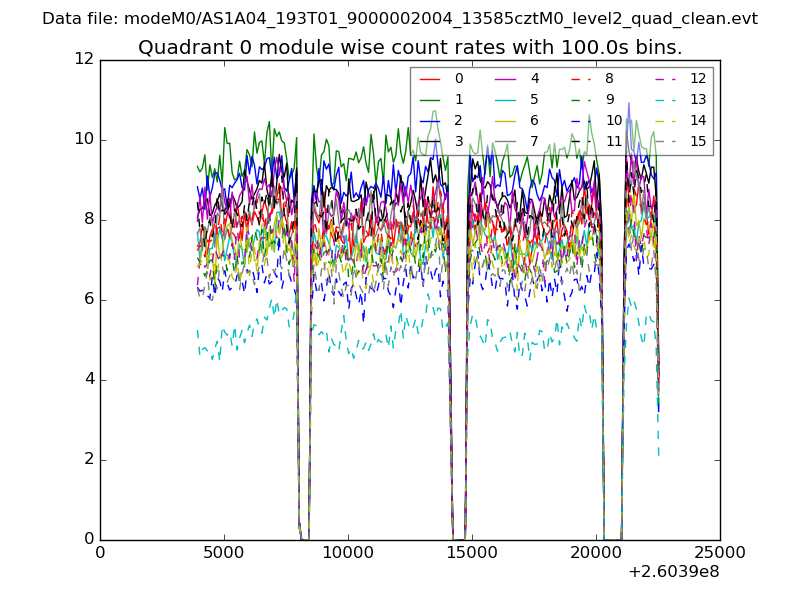 |
 |
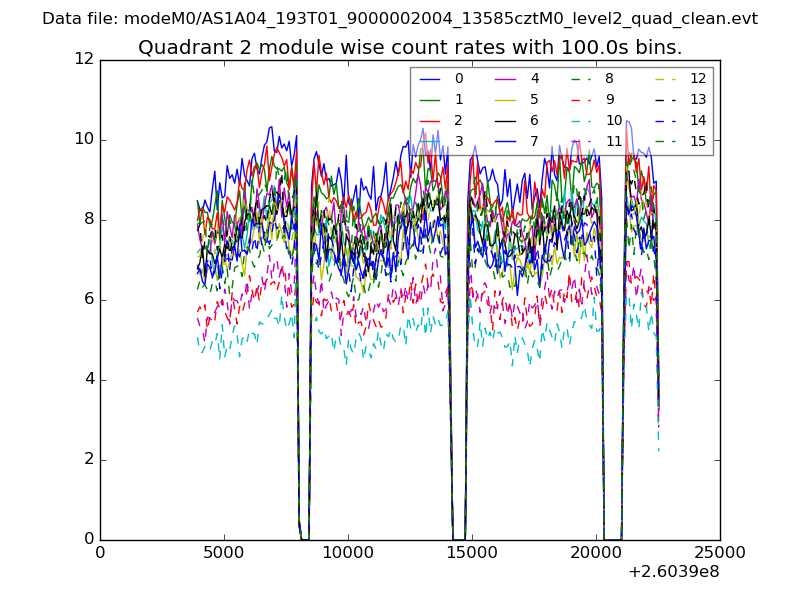
| Module-wise count rates for Quadrant B Data is divided into 100 sec bins |
 |
 |
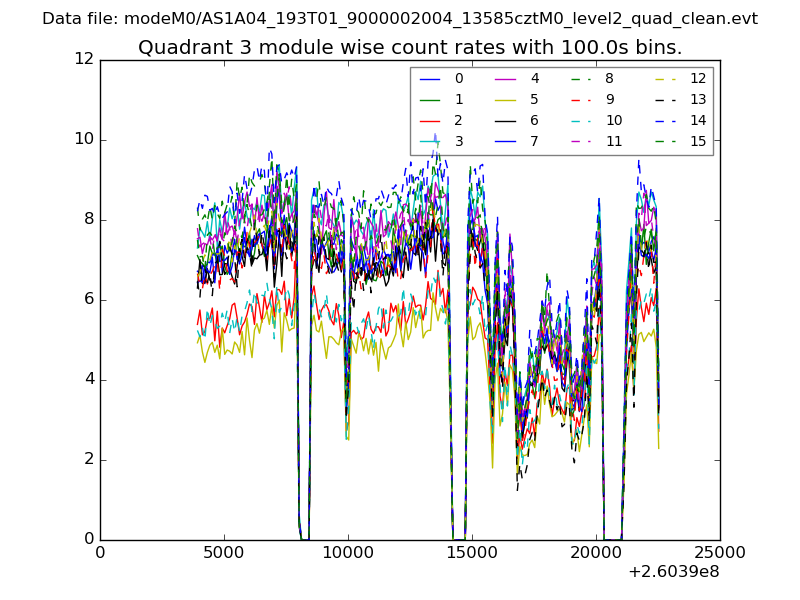
| Module-wise count rates for Quadrant C Data is divided into 100 sec bins |
 |
 |
| Module-wise count rates for Quadrant D Data is divided into 100 sec bins |
 |
 |
| Parameter | Plot |
|---|---|
| CZT HV Monitor | 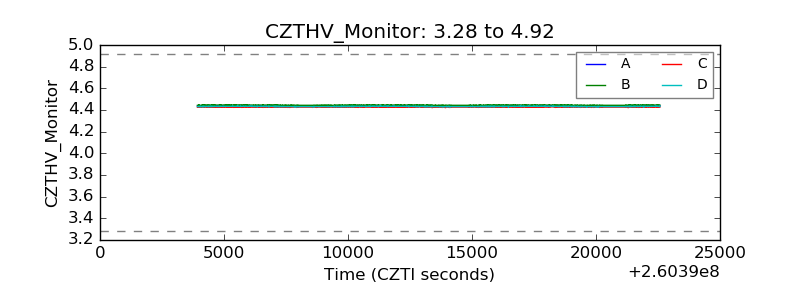 |
| D_VDD | 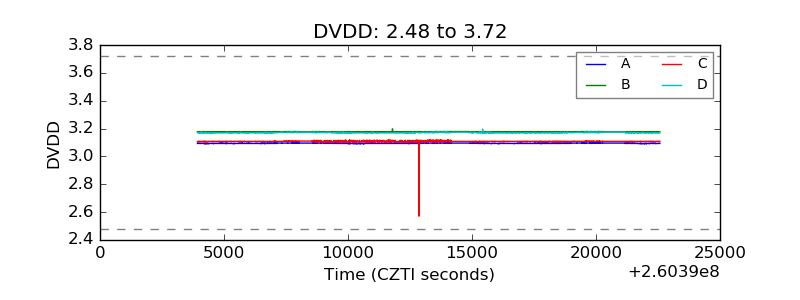 |
| Temperature 1 | 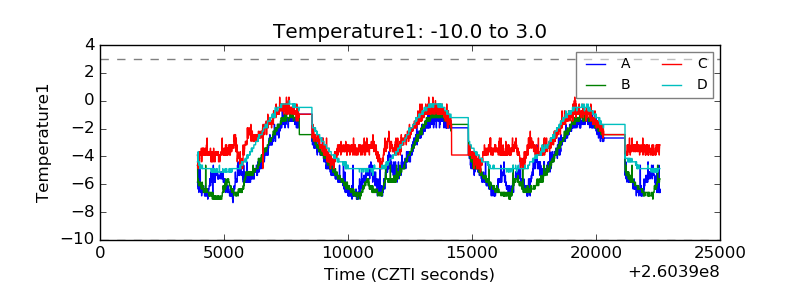 |
| Veto HV Monitor | 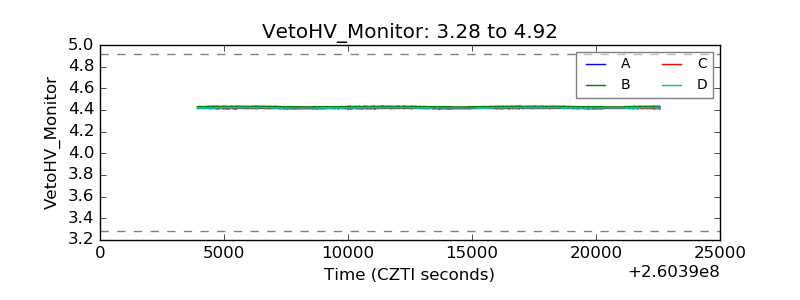 |
| Veto LLD | 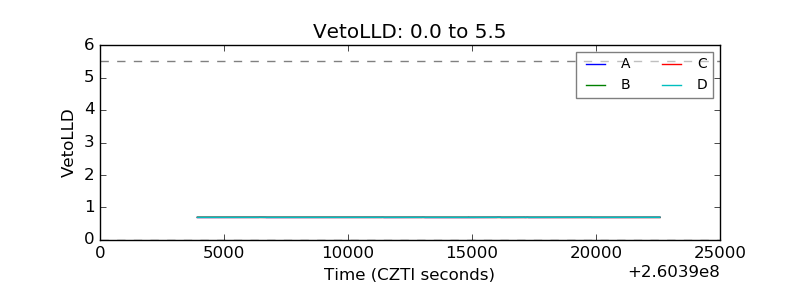 |
| Alpha Counter | 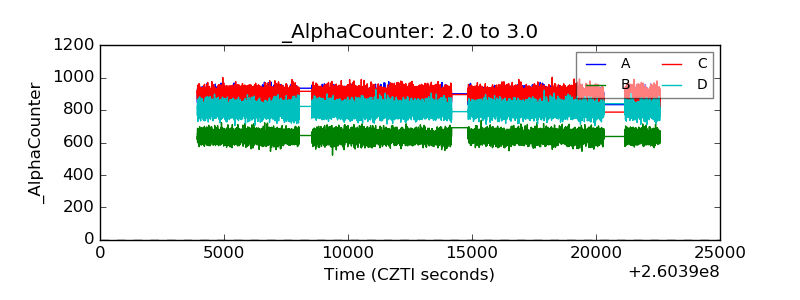 |
| _CPM_Rate | 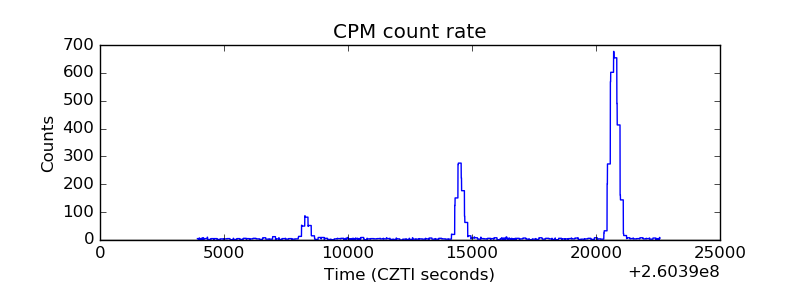 |
| CZT Counter | 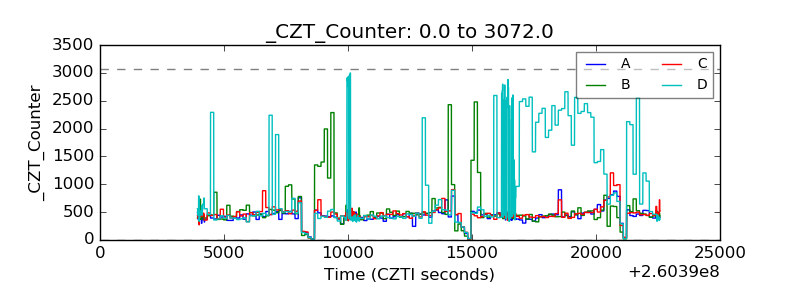 |
| +2.5 Volts monitor |  |
| +5 Volts monitor |  |
| _ROLL_ROT | 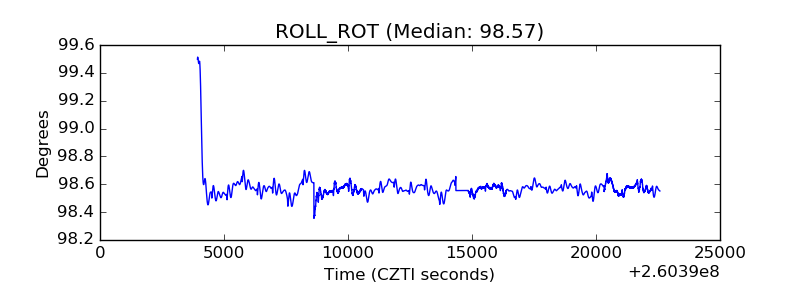 |
| _Roll_DEC | 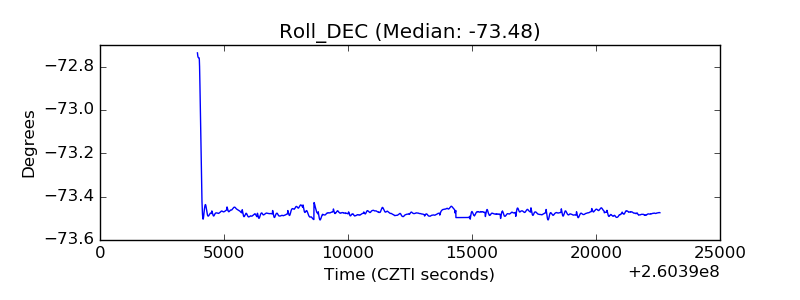 |
| _Roll_RA | 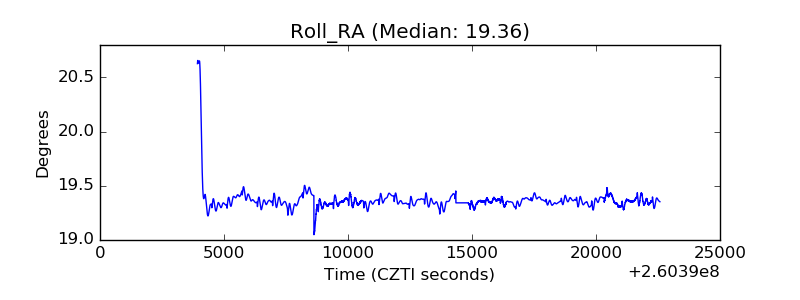 |
| Veto Counter | 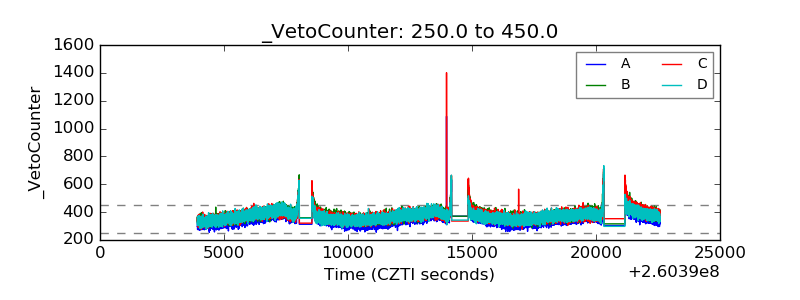 |