| Param | Original file | Final file |
|---|---|---|
| Filename | modeM0/AS1A04_193T01_9000002004_13586cztM0_level2.evt | modeM0/AS1A04_193T01_9000002004_13586cztM0_level2_quad_clean.evt |
| Size (bytes) | 540,365,760 | 123,828,480 |
| Size | 515.3 MB | 118.1 MB |
| Events in quadrant A | 3,079,766 | 849,844 |
| Events in quadrant B | 4,047,782 | 830,226 |
| Events in quadrant C | 3,222,711 | 840,485 |
| Events in quadrant D | 5,565,053 | 767,473 |
| Mode M0 | |||
|---|---|---|---|
| Quadrant | BADHDUFLAG | Total packets | Discarded packets |
| A | 0 | 13481 | 3 |
| B | 0 | 16358 | 2 |
| C | 0 | 13665 | 2 |
| D | 0 | 20963 | 2 |
| Mode SS | |||
|---|---|---|---|
| Quadrant | BADHDUFLAG | Total packets | Discarded packets |
| A | 0 | 134 | 0 |
| B | 0 | 134 | 0 |
| C | 0 | 134 | 0 |
| D | 0 | 134 | 0 |
| Mode M9 | |||
|---|---|---|---|
| Quadrant | BADHDUFLAG | Total packets | Discarded packets |
| A | 0 | 12 | 0 |
| B | 0 | 12 | 0 |
| C | 0 | 12 | 0 |
| D | 0 | 13 | 0 |
| Quadrant | Total seconds | Saturated seconds | Saturation percentage |
|---|---|---|---|
| A | 6630 | 32 | 0.482655% |
| B | 6630 | 436 | 6.576169% |
| C | 6630 | 38 | 0.573152% |
| D | 6630 | 659 | 9.939668% |
Noise dominated data is calculated using 1-second bins in cleaned event files. If a bin has >2000 counts, and if more than 50% of those come from <1% of pixels, then it is considered to be noise-dominated and hence unusable.
| Quadrant | # 1 sec bins | Bins with >0 counts | Bins with >2000 counts | High rate bins dominated by noise | Noise dominated (total time) | Noise dominated (detector-on time) | Marked lightcurve |
|---|---|---|---|---|---|---|---|
| A | 7616 | 6631 | 0 | 0 | 0.00% | 0.00% | 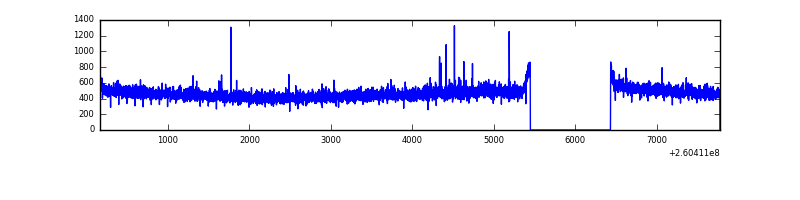 |
| B | 7615 | 6630 | 311 | 311 | 4.08% | 4.69% | 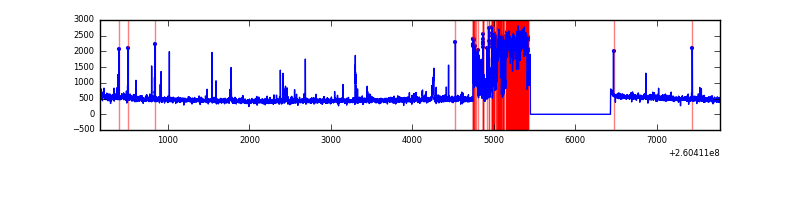 |
| C | 7616 | 6631 | 0 | 0 | 0.00% | 0.00% | 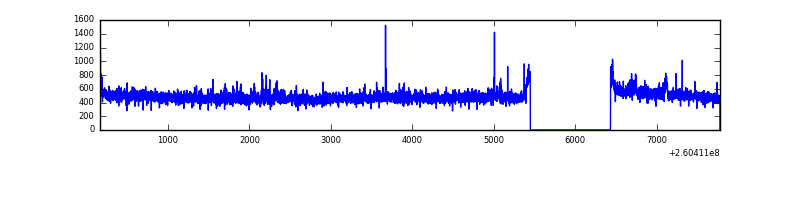 |
| D | 7615 | 6630 | 617 | 617 | 8.10% | 9.31% | 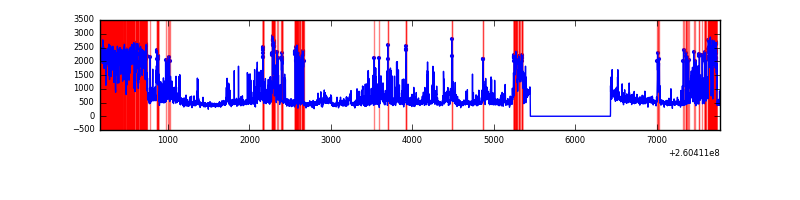 |
Top three noisy pixels from each quadrant. If the there are fewer than three noisy pixels in the level2.evt file, extra rows are filled as -1
| Pixel properties | Quadrant properties | ||||||
|---|---|---|---|---|---|---|---|
| Quadrant | DetID | PixID | Counts | Sigma | Mean | Median | Sigma |
| A | 1 | 162 | 25700 | 156.99 | 786 | 769 | 158.8 |
| A | 2 | 250 | 14445 | 86.12 | 786 | 769 | 158.8 |
| A | 1 | 178 | 8680 | 49.81 | 786 | 769 | 158.8 |
| B | 0 | 182 | 925053 | 6472.11 | 763 | 744 | 142.8 |
| B | 3 | 64 | 39058 | 268.28 | 763 | 744 | 142.8 |
| B | 0 | 85 | 32672 | 223.56 | 763 | 744 | 142.8 |
| C | 3 | 233 | 204139 | 1146.92 | 769 | 774 | 177.3 |
| C | 0 | 207 | 15900 | 85.31 | 769 | 774 | 177.3 |
| C | 13 | 61 | 5598 | 27.21 | 769 | 774 | 177.3 |
| D | 13 | 122 | 1901688 | 10902.34 | 735 | 712 | 174.4 |
| D | 5 | 222 | 544671 | 3119.67 | 735 | 712 | 174.4 |
| D | 1 | 20 | 223701 | 1278.87 | 735 | 712 | 174.4 |
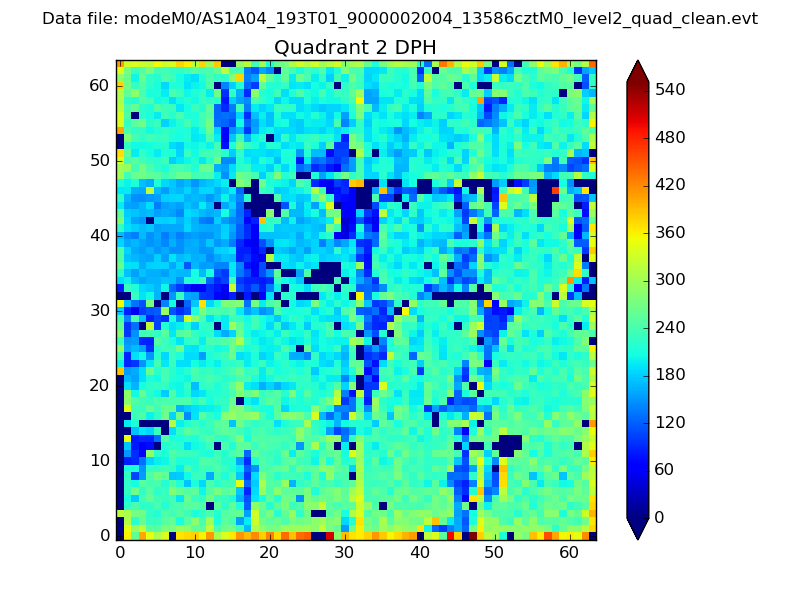
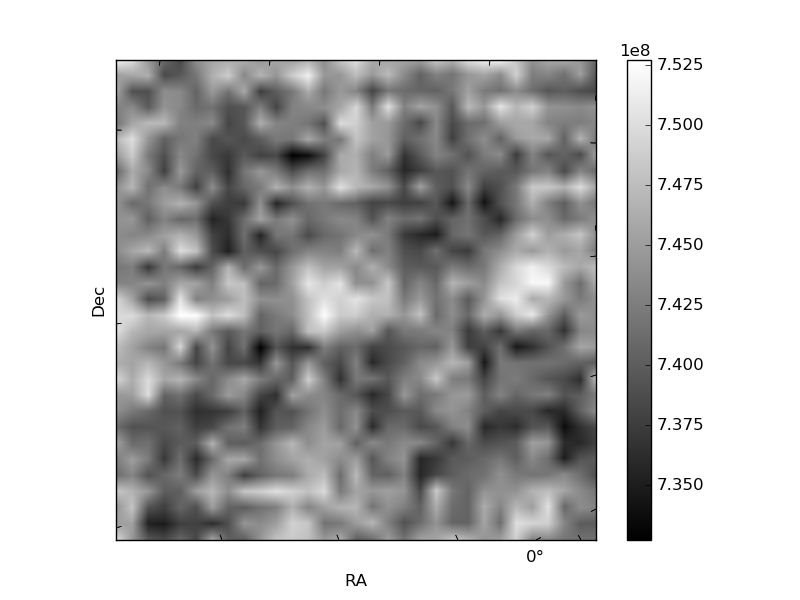
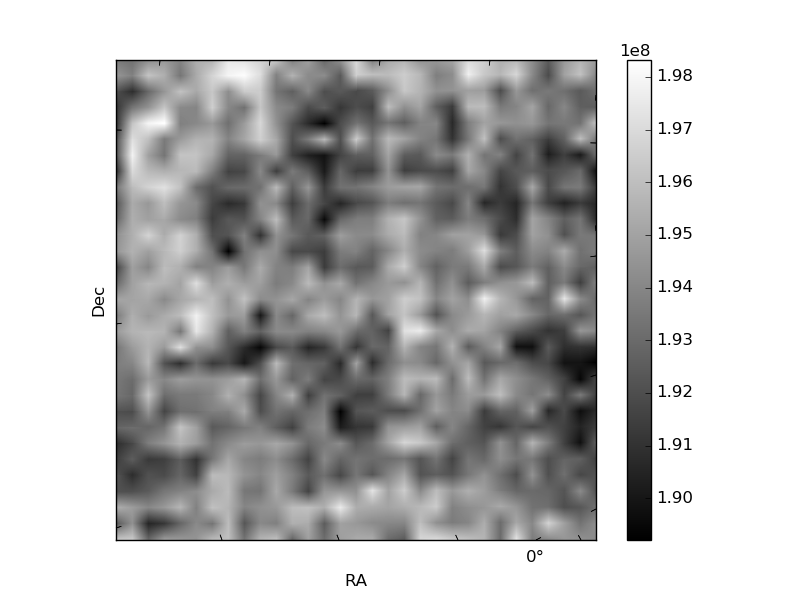
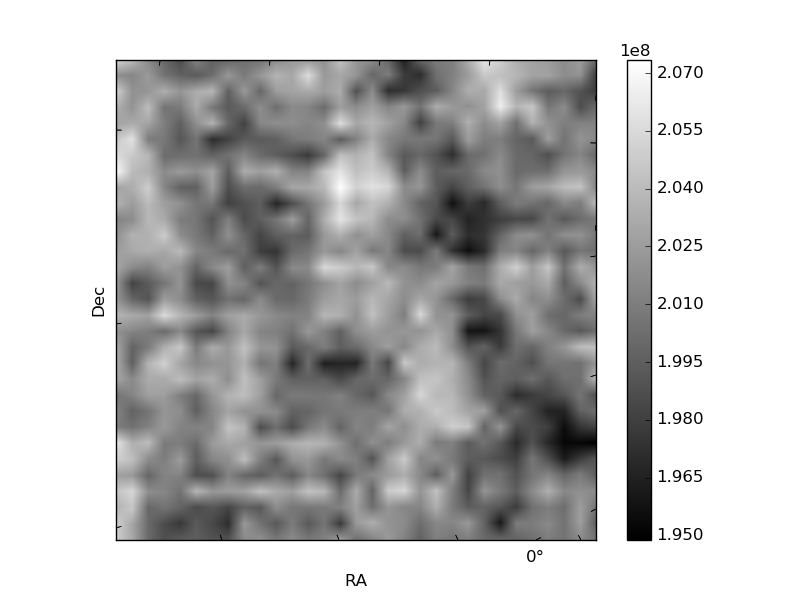
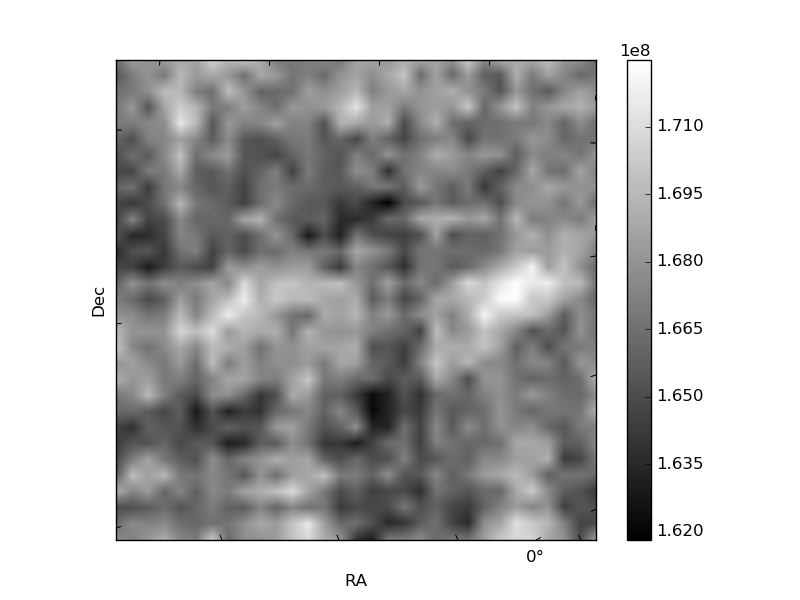
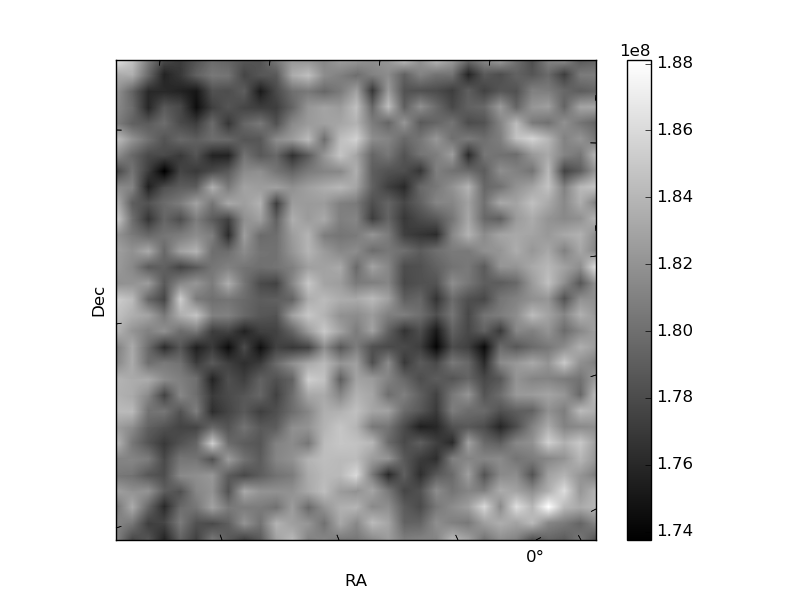
Histogram calculated using DETX and DETY for each event in the final _common_clean file
| Quadrant A | 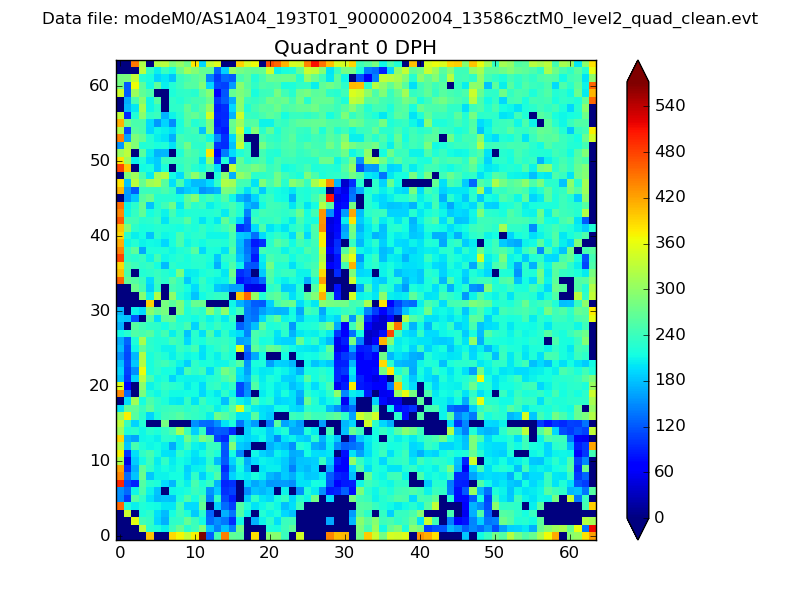 |
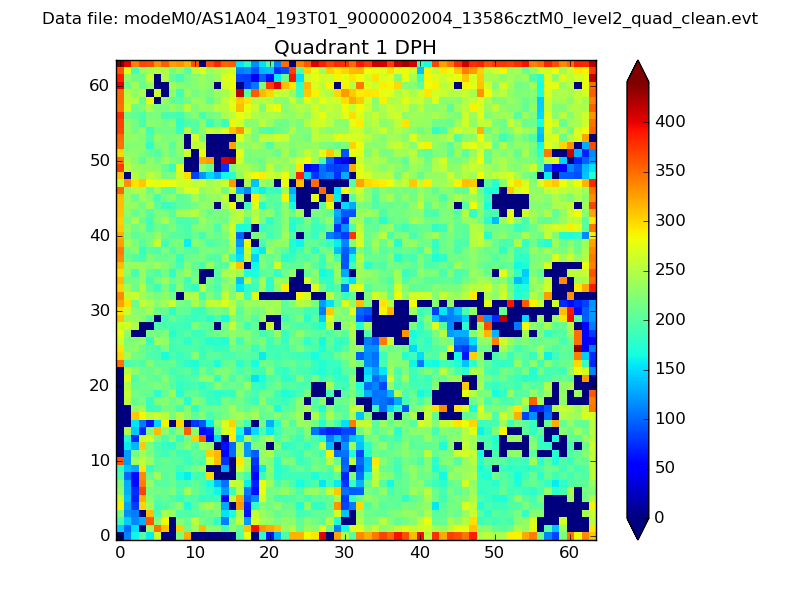 |
Quadrant B |
|---|---|---|---|
| Quadrant D | 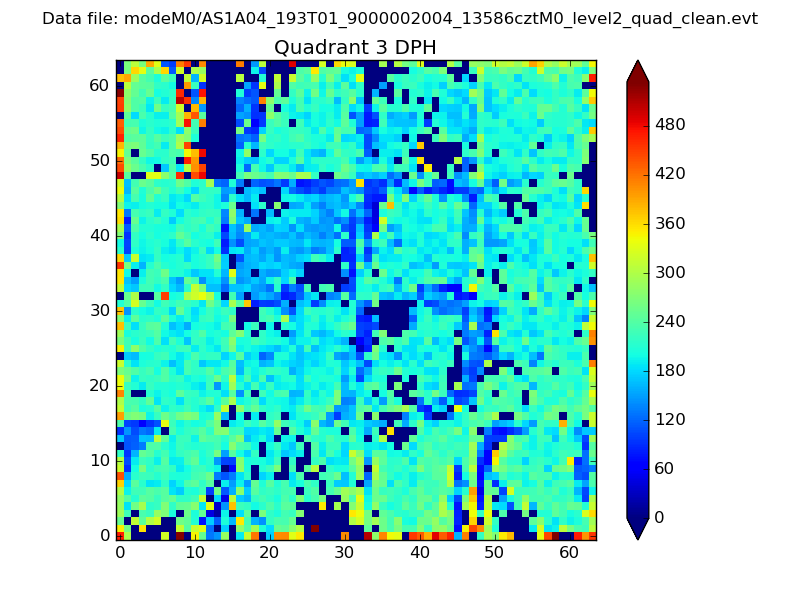 |
 |
Quadrant C |
| Plot type | Count rate plots | Images |
|---|---|---|
| Comparison with Poisson distribution Blue bars denote a histogram of data divided into 1 sec bins. Red curve is a Poisson curve with rate = median count rate of data. |
 |
 |
| Quadrant-wise count rates Data is divided into 100 sec bins |
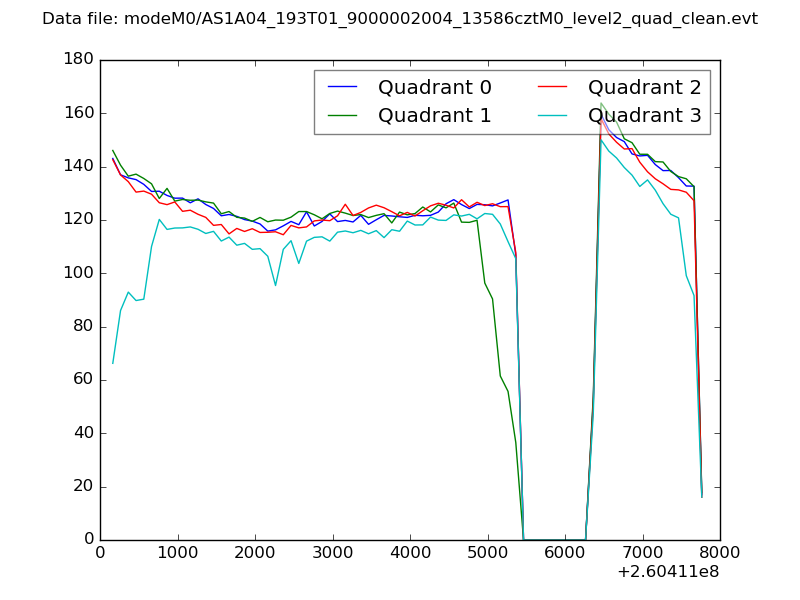 |
|
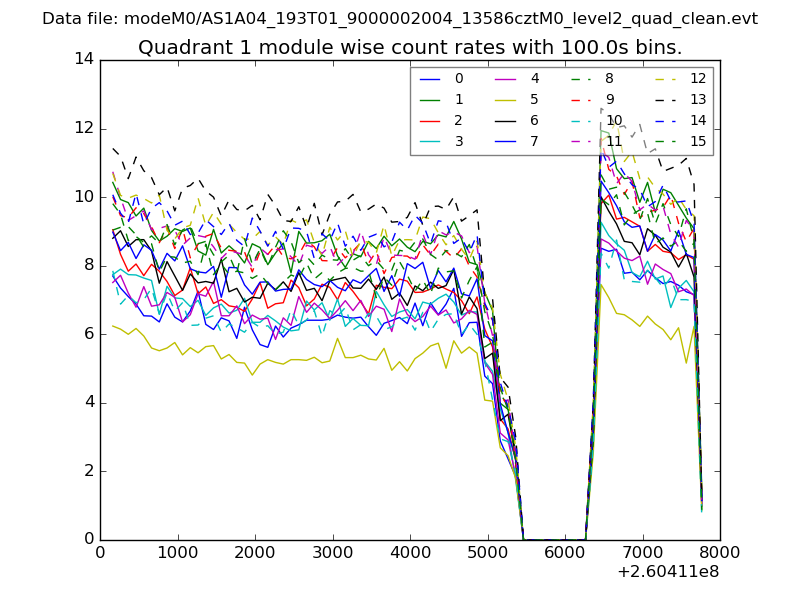
| Module-wise count rates for Quadrant A Data is divided into 100 sec bins |
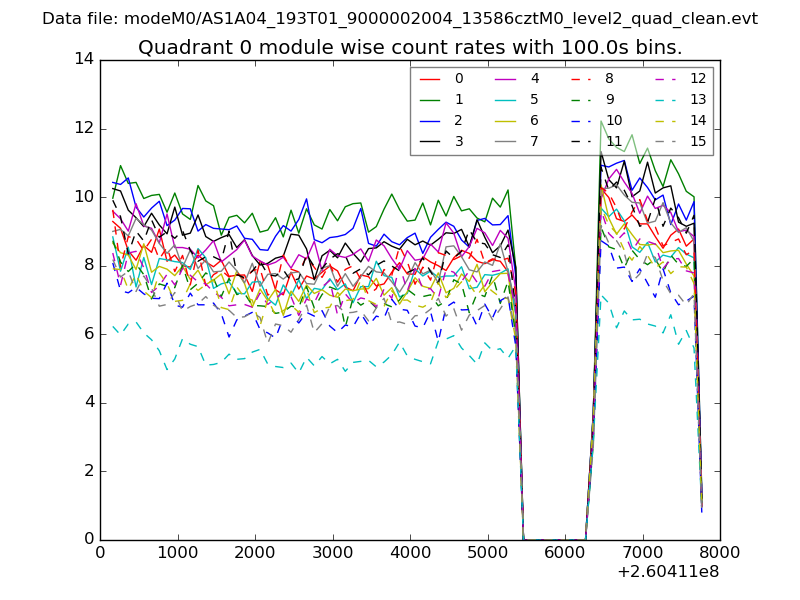 |
 |
| Module-wise count rates for Quadrant B Data is divided into 100 sec bins |
 |
 |
| Module-wise count rates for Quadrant C Data is divided into 100 sec bins |
 |
 |
| Module-wise count rates for Quadrant D Data is divided into 100 sec bins |
 |
 |
| Parameter | Plot |
|---|---|
| CZT HV Monitor |  |
| D_VDD | 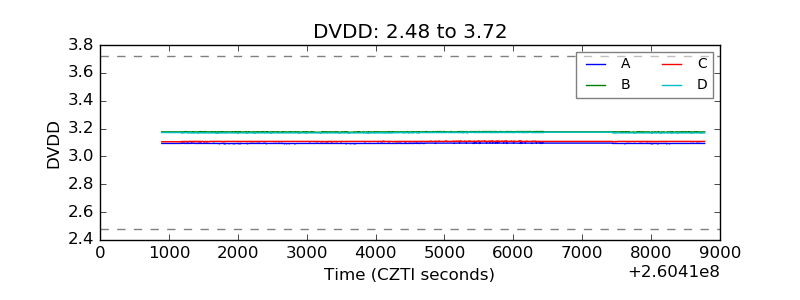 |
| Temperature 1 | 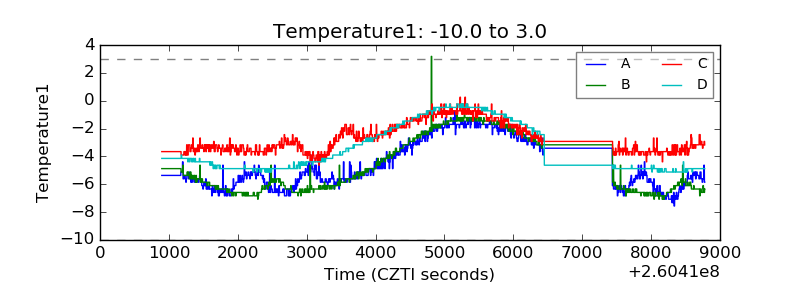 |
| Veto HV Monitor | 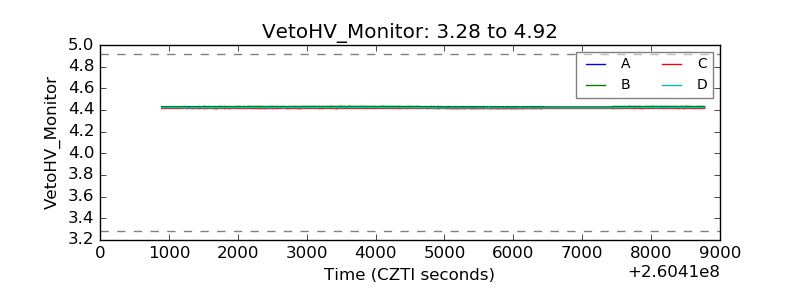 |
| Veto LLD | 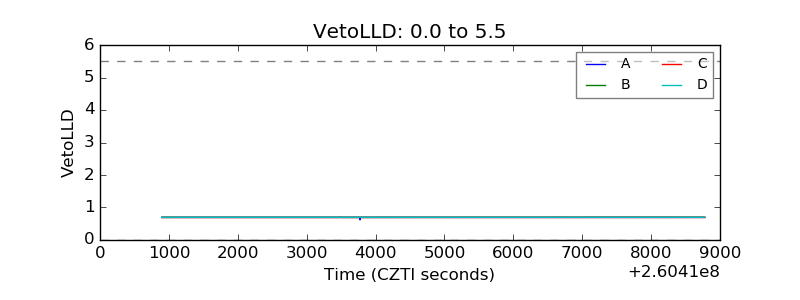 |
| Alpha Counter | 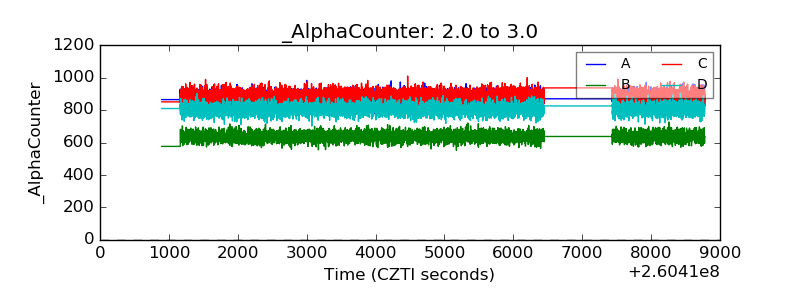 |
| _CPM_Rate | 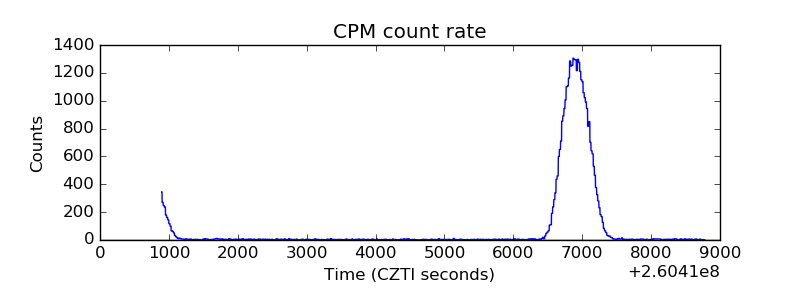 |
| CZT Counter | 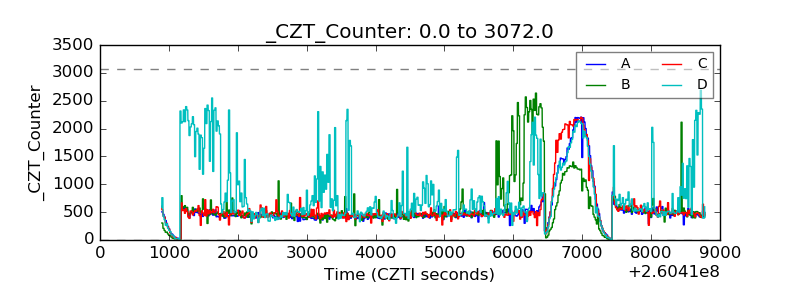 |
| +2.5 Volts monitor |  |
| +5 Volts monitor | 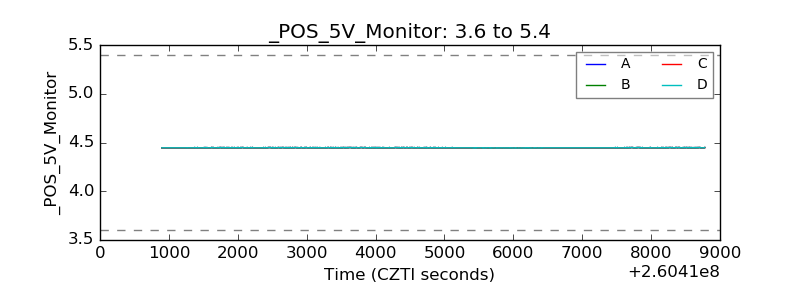 |
| _ROLL_ROT |  |
| _Roll_DEC | 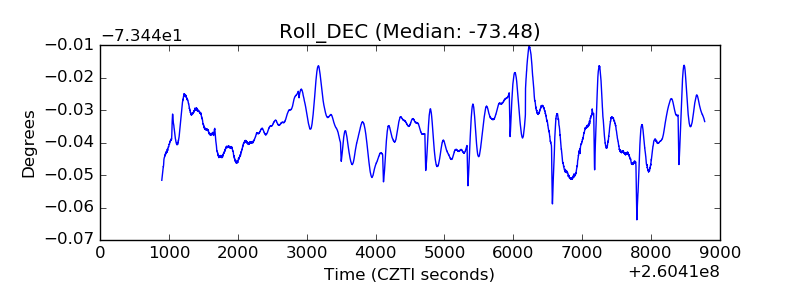 |
| _Roll_RA | 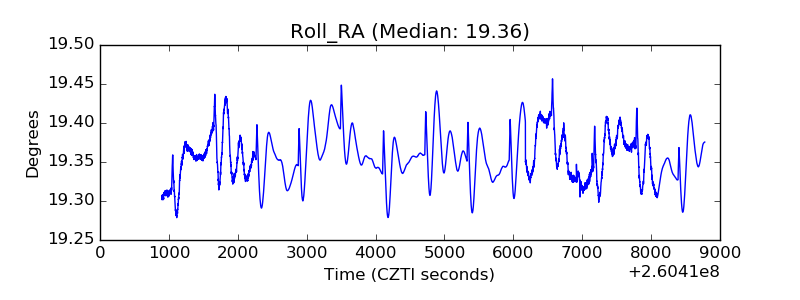 |
| Veto Counter |  |