| Param | Original file | Final file |
|---|---|---|
| Filename | modeM0/AS1A04_193T01_9000002004_13589cztM0_level2.evt | modeM0/AS1A04_193T01_9000002004_13589cztM0_level2_quad_clean.evt |
| Size (bytes) | 446,276,160 | 127,189,440 |
| Size | 425.6 MB | 121.3 MB |
| Events in quadrant A | 2,989,159 | 867,364 |
| Events in quadrant B | 3,325,318 | 877,747 |
| Events in quadrant C | 3,105,328 | 869,865 |
| Events in quadrant D | 3,683,229 | 813,325 |
| Mode M0 | |||
|---|---|---|---|
| Quadrant | BADHDUFLAG | Total packets | Discarded packets |
| A | 0 | 12671 | 2 |
| B | 0 | 13752 | 1 |
| C | 0 | 13009 | 1 |
| D | 0 | 14783 | 1 |
| Mode SS | |||
|---|---|---|---|
| Quadrant | BADHDUFLAG | Total packets | Discarded packets |
| A | 0 | 124 | 0 |
| B | 0 | 124 | 0 |
| C | 0 | 124 | 0 |
| D | 0 | 124 | 0 |
| Mode M9 | |||
|---|---|---|---|
| Quadrant | BADHDUFLAG | Total packets | Discarded packets |
| A | 0 | 12 | 0 |
| B | 0 | 12 | 0 |
| C | 0 | 12 | 0 |
| D | 0 | 12 | 0 |
| Quadrant | Total seconds | Saturated seconds | Saturation percentage |
|---|---|---|---|
| A | 6071 | 39 | 0.642398% |
| B | 6071 | 101 | 1.663647% |
| C | 6071 | 38 | 0.625927% |
| D | 6071 | 214 | 3.524955% |
Noise dominated data is calculated using 1-second bins in cleaned event files. If a bin has >2000 counts, and if more than 50% of those come from <1% of pixels, then it is considered to be noise-dominated and hence unusable.
| Quadrant | # 1 sec bins | Bins with >0 counts | Bins with >2000 counts | High rate bins dominated by noise | Noise dominated (total time) | Noise dominated (detector-on time) | Marked lightcurve |
|---|---|---|---|---|---|---|---|
| A | 7276 | 6071 | 0 | 0 | 0.00% | 0.00% | 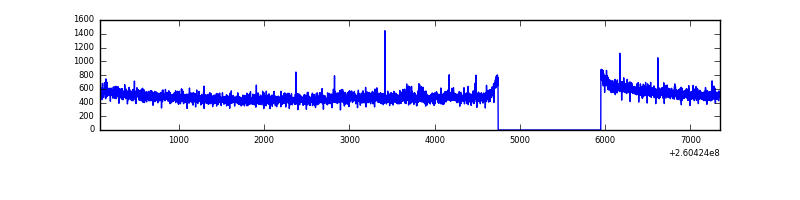 |
| B | 7276 | 6071 | 34 | 34 | 0.47% | 0.56% | 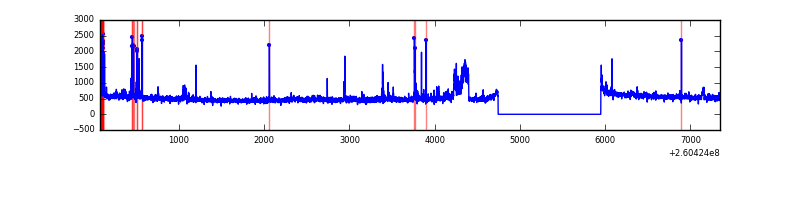 |
| C | 7276 | 6071 | 0 | 0 | 0.00% | 0.00% | 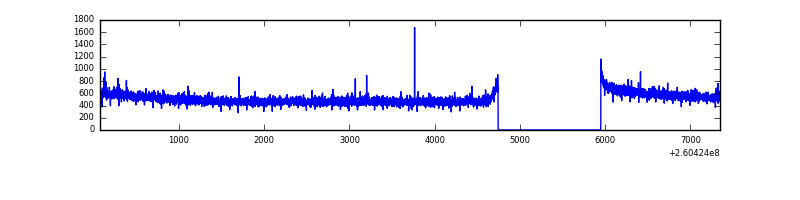 |
| D | 7276 | 6071 | 135 | 135 | 1.86% | 2.22% | 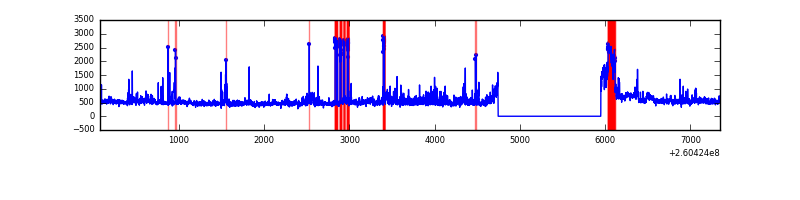 |
Top three noisy pixels from each quadrant. If the there are fewer than three noisy pixels in the level2.evt file, extra rows are filled as -1
| Pixel properties | Quadrant properties | ||||||
|---|---|---|---|---|---|---|---|
| Quadrant | DetID | PixID | Counts | Sigma | Mean | Median | Sigma |
| A | 1 | 162 | 18951 | 119.23 | 765 | 751 | 152.7 |
| A | 2 | 250 | 14366 | 89.19 | 765 | 751 | 152.7 |
| A | 0 | 226 | 7036 | 41.17 | 765 | 751 | 152.7 |
| B | 0 | 182 | 125757 | 895.47 | 761 | 743 | 139.6 |
| B | 0 | 85 | 99679 | 708.67 | 761 | 743 | 139.6 |
| B | 3 | 64 | 53730 | 379.54 | 761 | 743 | 139.6 |
| C | 3 | 233 | 149559 | 871.14 | 755 | 759 | 170.8 |
| C | 0 | 207 | 7185 | 37.62 | 755 | 759 | 170.8 |
| C | 13 | 61 | 5473 | 27.6 | 755 | 759 | 170.8 |
| D | 13 | 122 | 271003 | 1557.56 | 736 | 717 | 173.5 |
| D | 1 | 20 | 179468 | 1030.08 | 736 | 717 | 173.5 |
| D | 5 | 222 | 152418 | 874.2 | 736 | 717 | 173.5 |
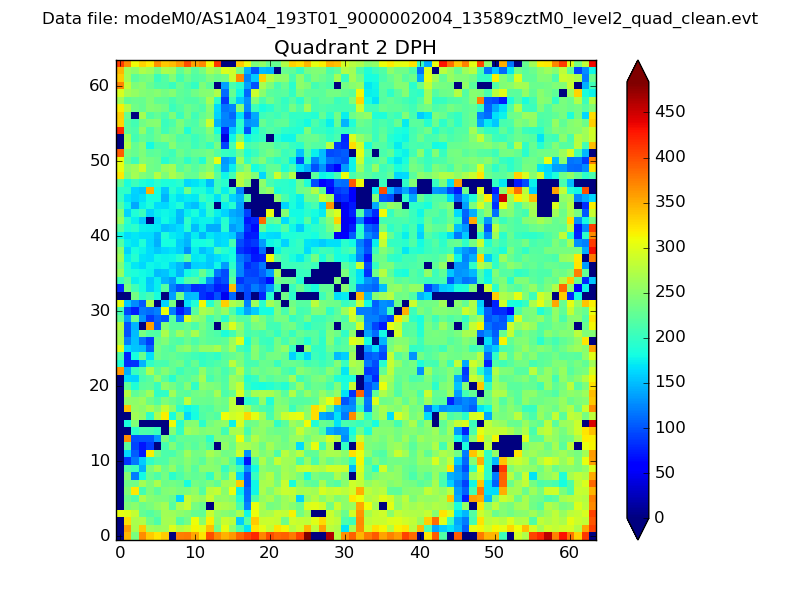
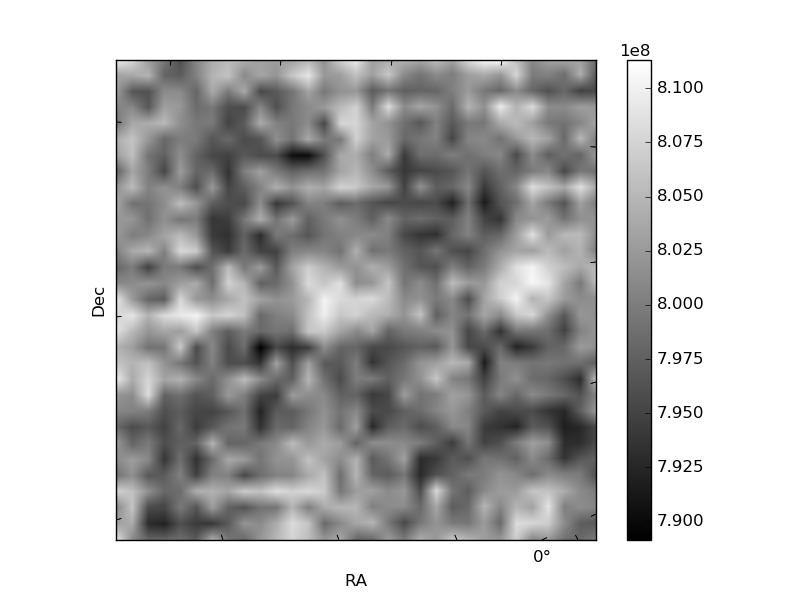
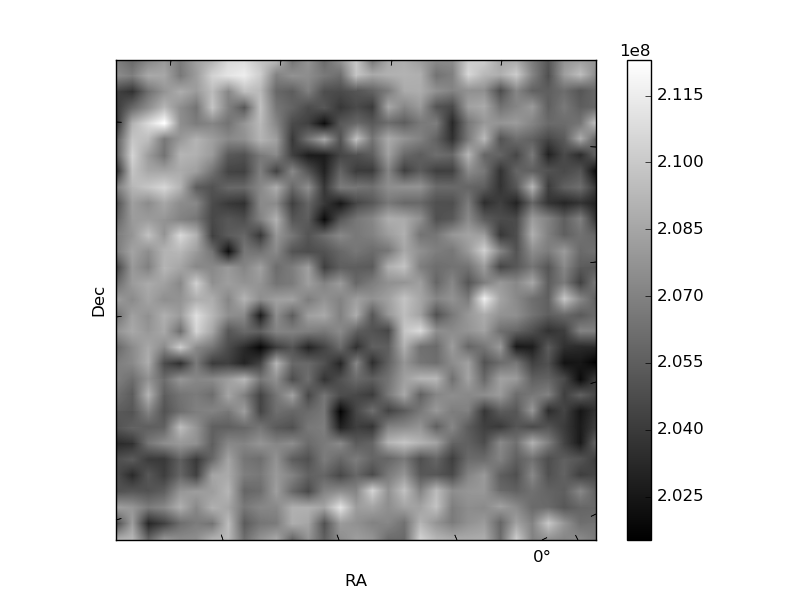
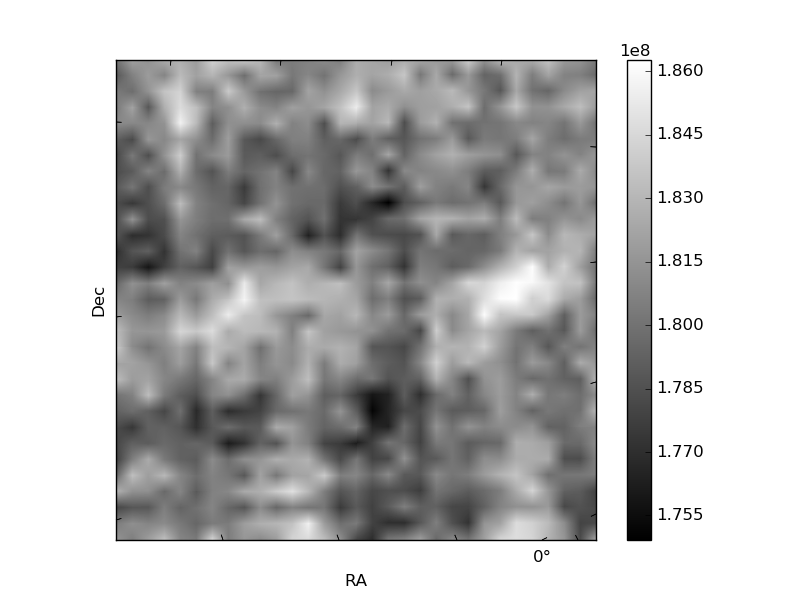
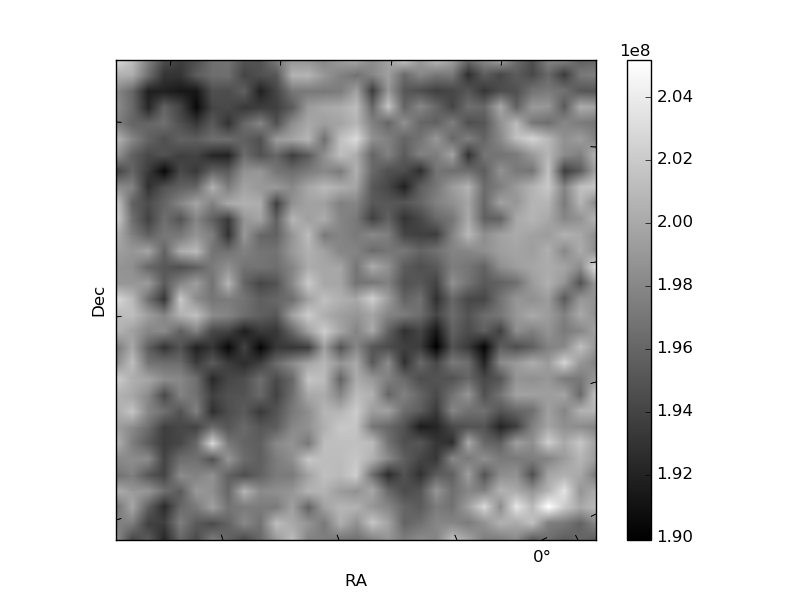
Histogram calculated using DETX and DETY for each event in the final _common_clean file
| Quadrant A | 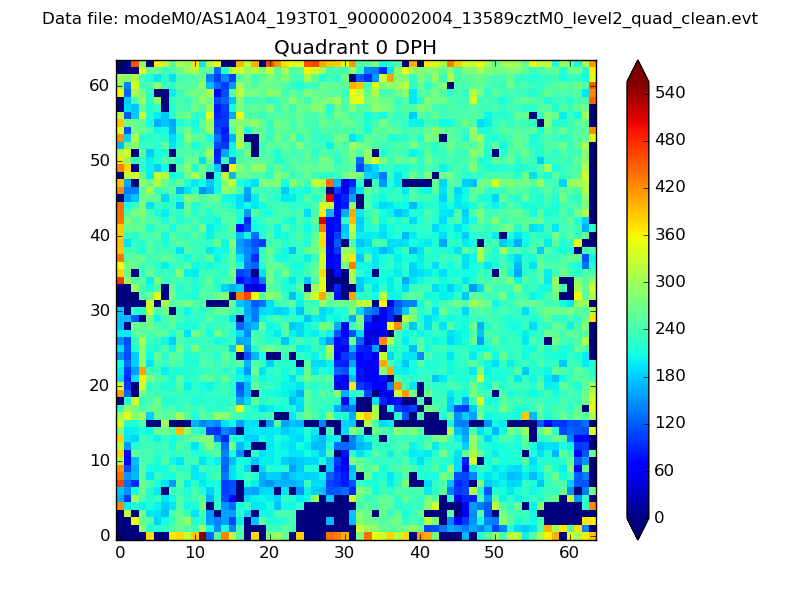 |
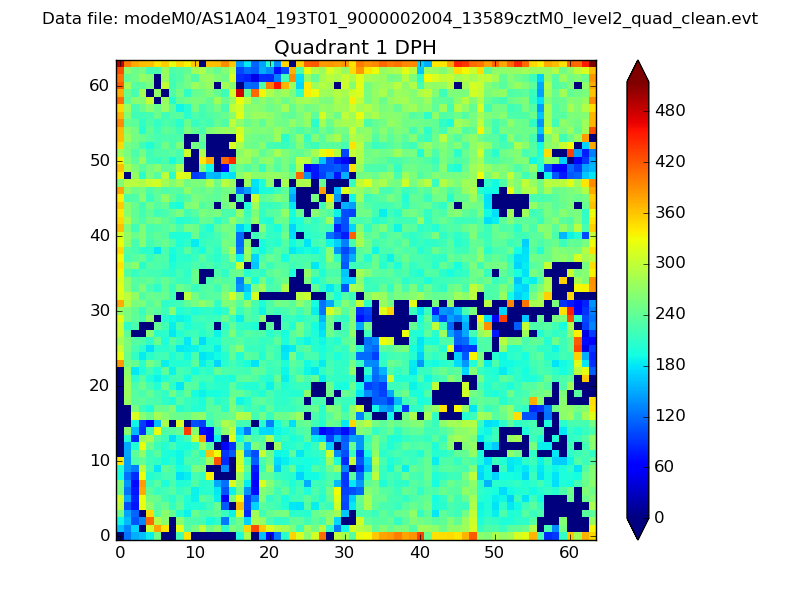 |
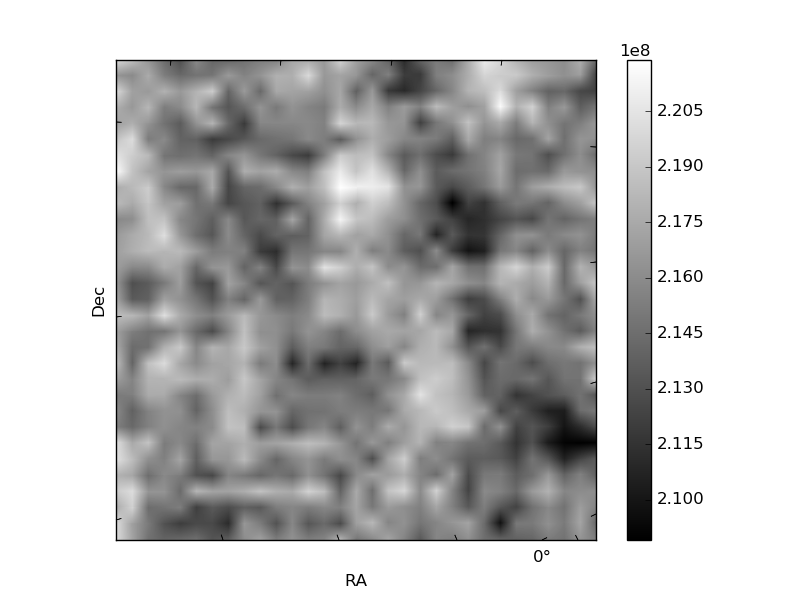
Quadrant B |
|---|---|---|---|
| Quadrant D | 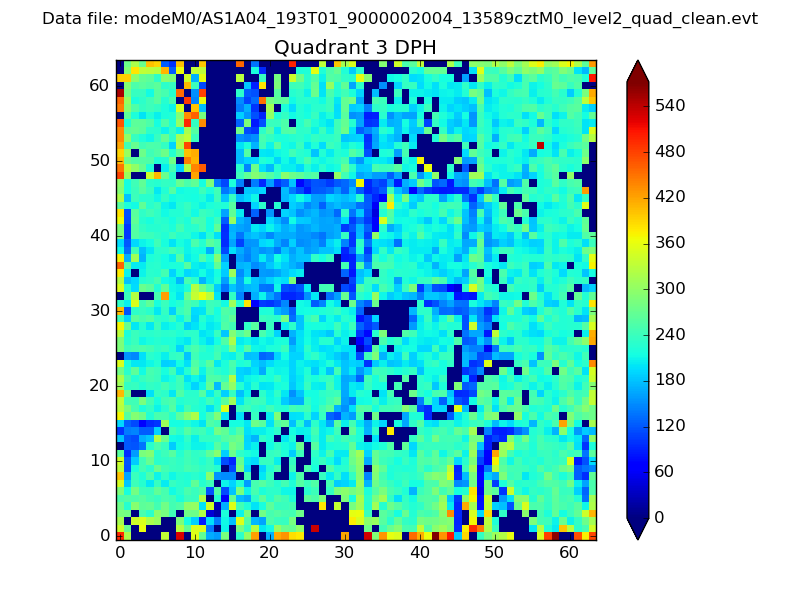 |
 |
Quadrant C |
| Plot type | Count rate plots | Images |
|---|---|---|
| Comparison with Poisson distribution Blue bars denote a histogram of data divided into 1 sec bins. Red curve is a Poisson curve with rate = median count rate of data. |
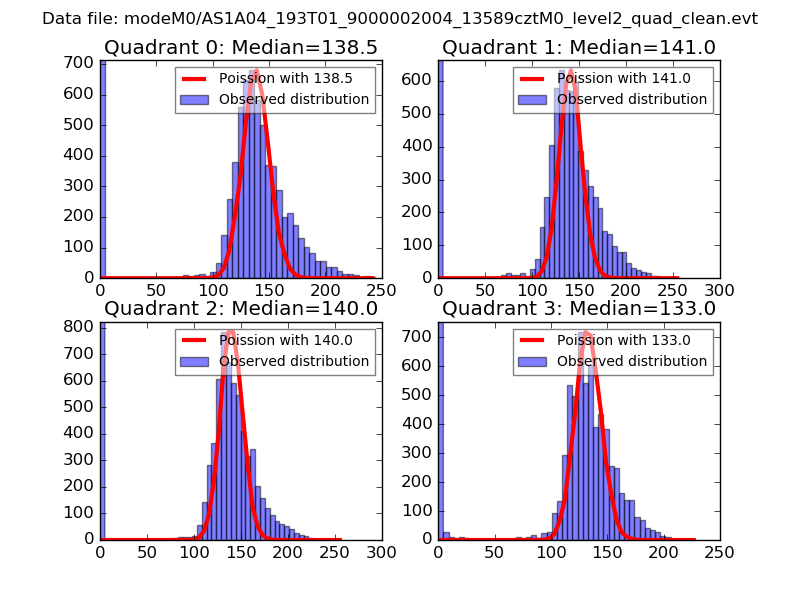 |
 |
| Quadrant-wise count rates Data is divided into 100 sec bins |
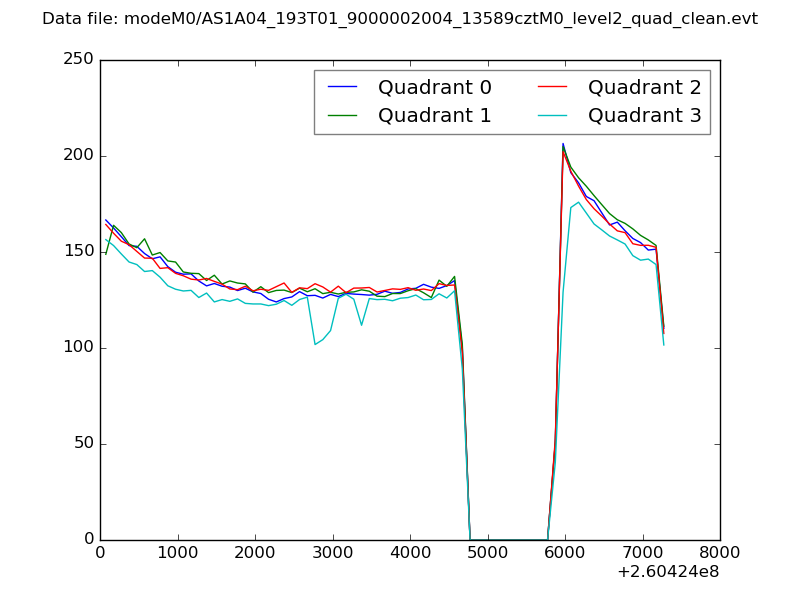 |
|
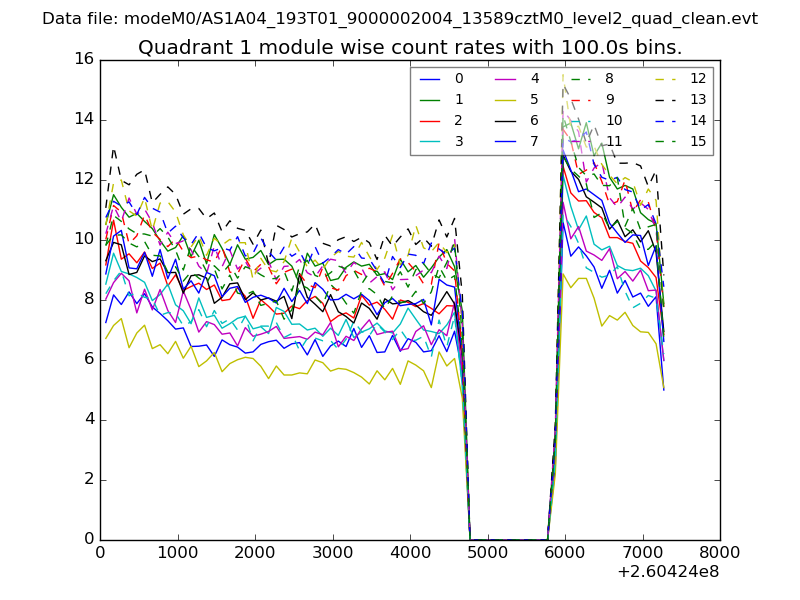
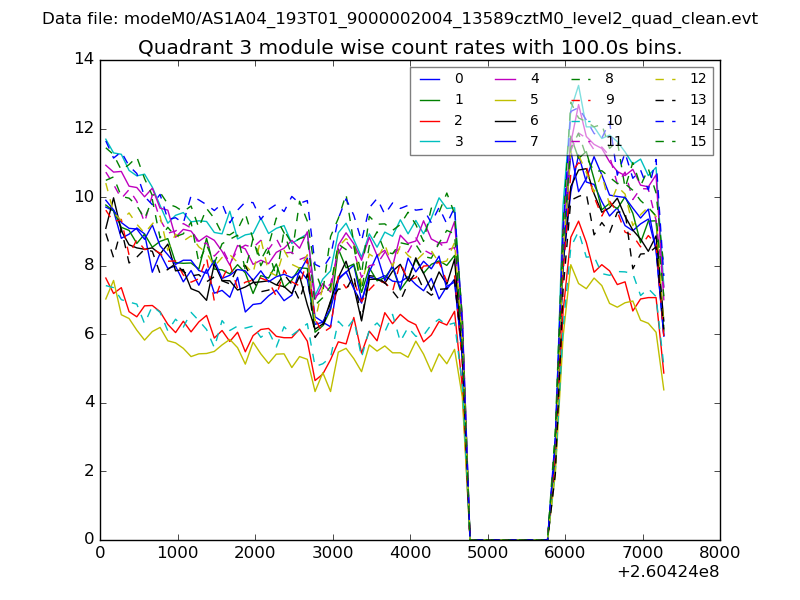
| Module-wise count rates for Quadrant A Data is divided into 100 sec bins |
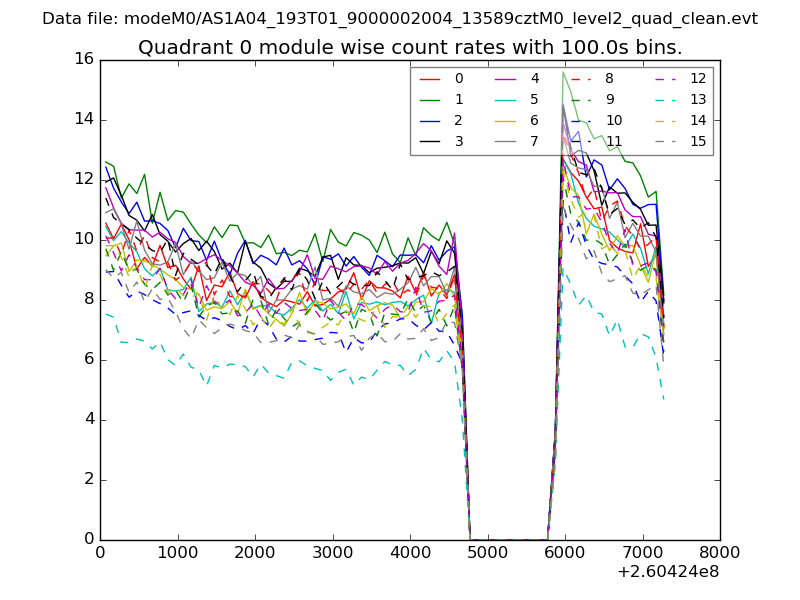 |
 |
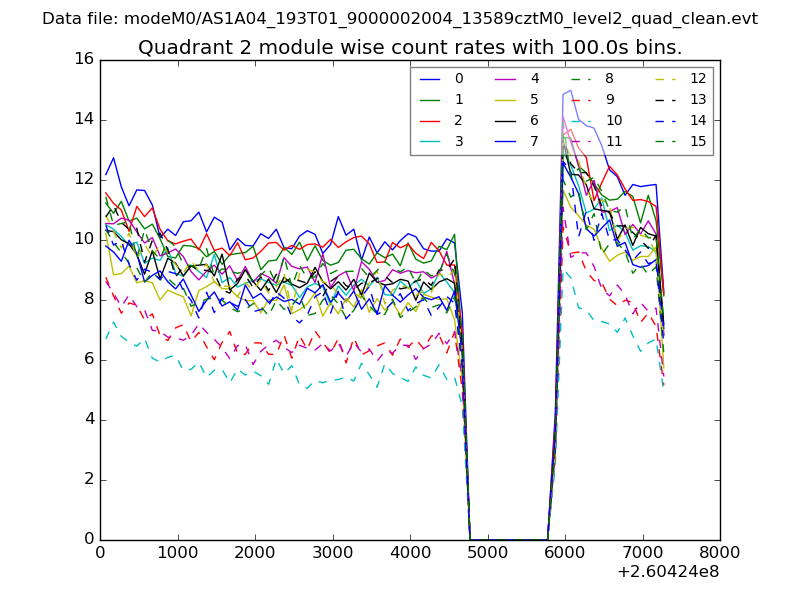
| Module-wise count rates for Quadrant B Data is divided into 100 sec bins |
 |
 |
| Module-wise count rates for Quadrant C Data is divided into 100 sec bins |
 |
 |
| Module-wise count rates for Quadrant D Data is divided into 100 sec bins |
 |
 |
| Parameter | Plot |
|---|---|
| CZT HV Monitor | 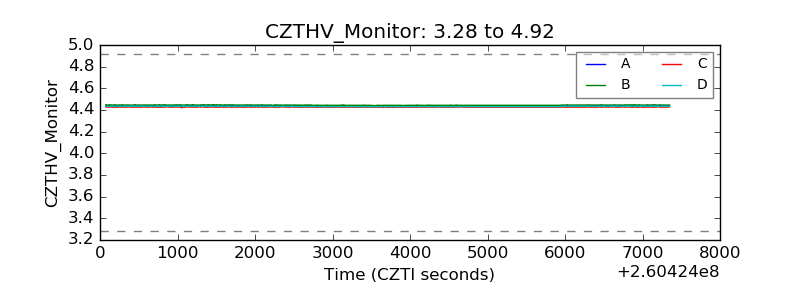 |
| D_VDD | 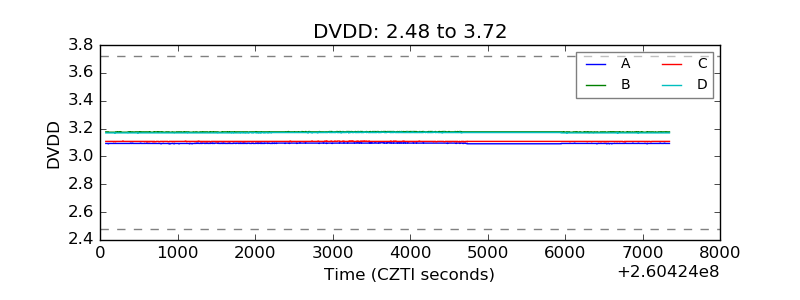 |
| Temperature 1 |  |
| Veto HV Monitor | 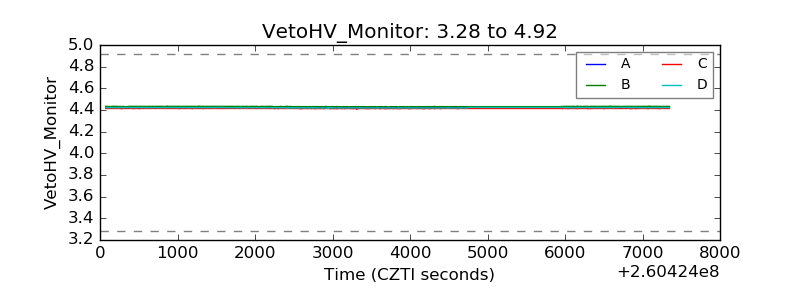 |
| Veto LLD |  |
| Alpha Counter | 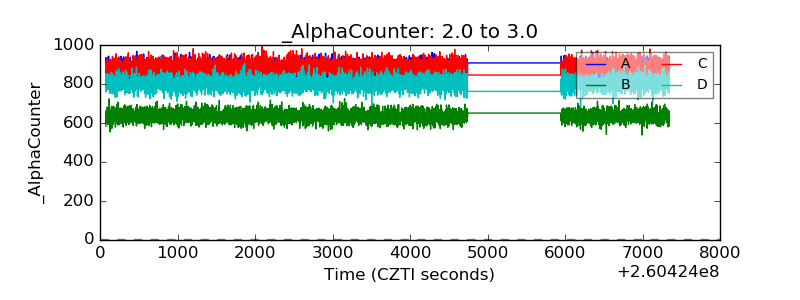 |
| _CPM_Rate | 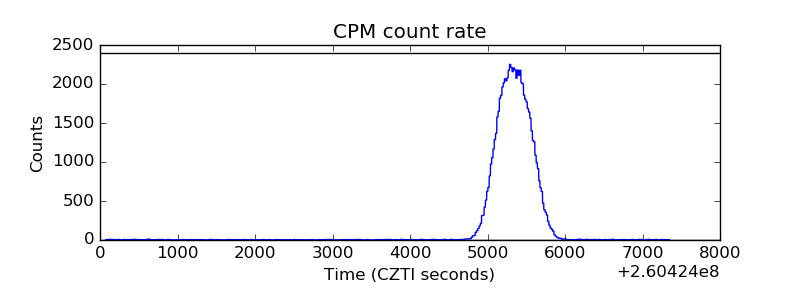 |
| CZT Counter | 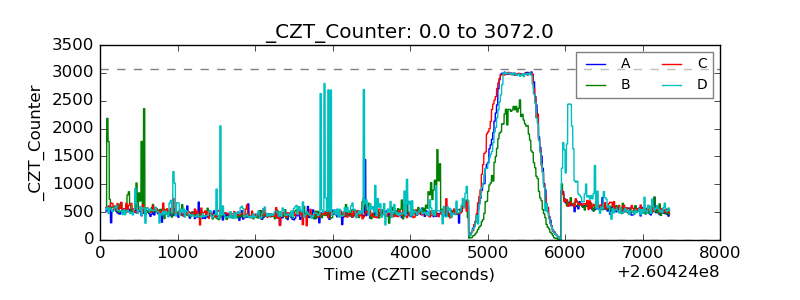 |
| +2.5 Volts monitor |  |
| +5 Volts monitor |  |
| _ROLL_ROT | 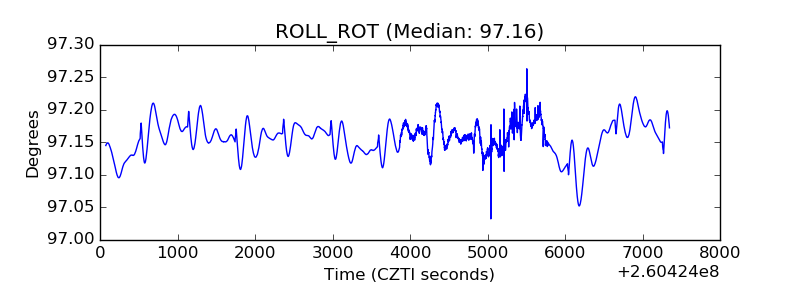 |
| _Roll_DEC | 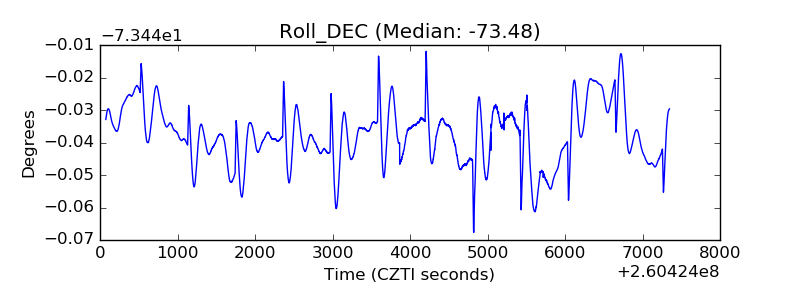 |
| _Roll_RA | 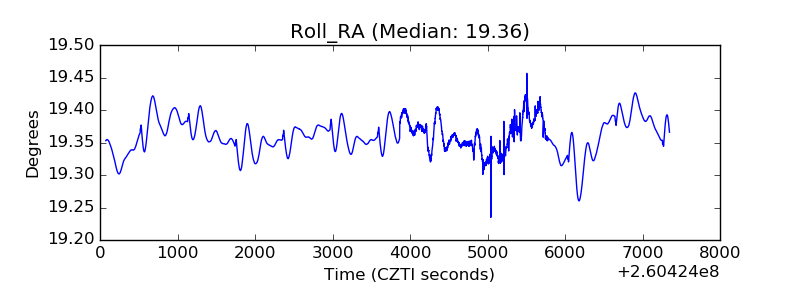 |
| Veto Counter | 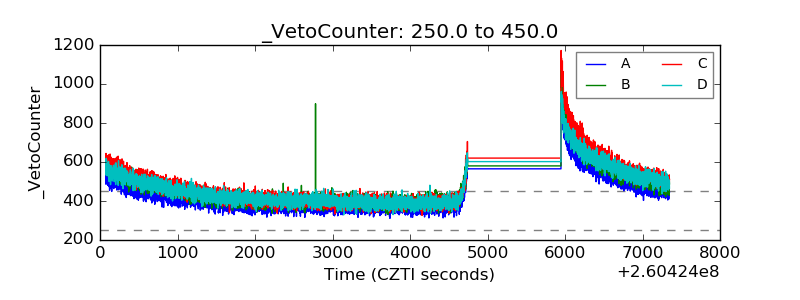 |