| Param | Original file | Final file |
|---|---|---|
| Filename | modeM0/AS1A04_193T01_9000002004_13590cztM0_level2.evt | modeM0/AS1A04_193T01_9000002004_13590cztM0_level2_quad_clean.evt |
| Size (bytes) | 427,147,200 | 121,207,680 |
| Size | 407.4 MB | 115.6 MB |
| Events in quadrant A | 2,874,141 | 827,333 |
| Events in quadrant B | 3,181,427 | 832,308 |
| Events in quadrant C | 2,933,936 | 829,952 |
| Events in quadrant D | 3,563,982 | 787,770 |
| Mode M0 | |||
|---|---|---|---|
| Quadrant | BADHDUFLAG | Total packets | Discarded packets |
| A | 0 | 11809 | 2 |
| B | 0 | 12891 | 1 |
| C | 0 | 12185 | 1 |
| D | 0 | 14132 | 1 |
| Mode SS | |||
|---|---|---|---|
| Quadrant | BADHDUFLAG | Total packets | Discarded packets |
| A | 0 | 116 | 0 |
| B | 0 | 116 | 0 |
| C | 0 | 116 | 0 |
| D | 0 | 116 | 0 |
| Mode M9 | |||
|---|---|---|---|
| Quadrant | BADHDUFLAG | Total packets | Discarded packets |
| A | 0 | 13 | 0 |
| B | 0 | 13 | 0 |
| C | 0 | 13 | 0 |
| D | 0 | 13 | 0 |
| Quadrant | Total seconds | Saturated seconds | Saturation percentage |
|---|---|---|---|
| A | 5628 | 17 | 0.302061% |
| B | 5628 | 91 | 1.616915% |
| C | 5628 | 15 | 0.266525% |
| D | 5628 | 113 | 2.007818% |
Noise dominated data is calculated using 1-second bins in cleaned event files. If a bin has >2000 counts, and if more than 50% of those come from <1% of pixels, then it is considered to be noise-dominated and hence unusable.
| Quadrant | # 1 sec bins | Bins with >0 counts | Bins with >2000 counts | High rate bins dominated by noise | Noise dominated (total time) | Noise dominated (detector-on time) | Marked lightcurve |
|---|---|---|---|---|---|---|---|
| A | 6943 | 5628 | 0 | 0 | 0.00% | 0.00% | 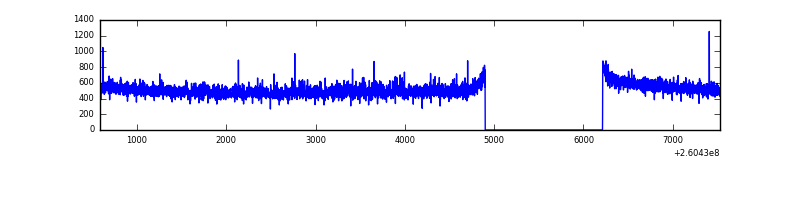 |
| B | 6944 | 5630 | 56 | 56 | 0.81% | 0.99% | 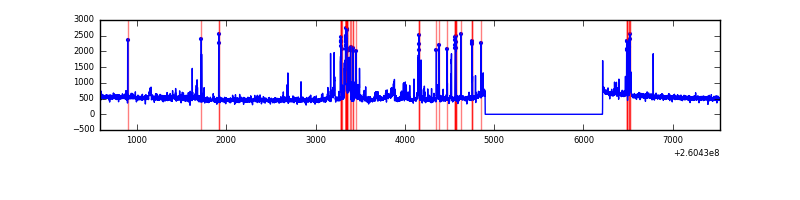 |
| C | 6943 | 5629 | 0 | 0 | 0.00% | 0.00% |  |
| D | 6943 | 5629 | 105 | 105 | 1.51% | 1.87% | 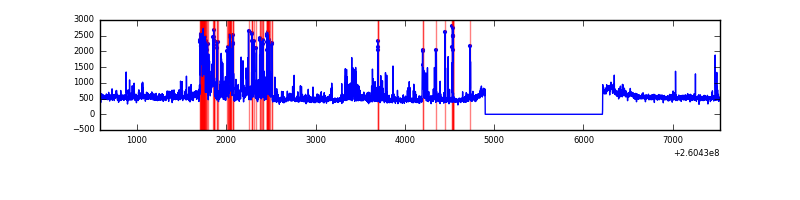 |
Top three noisy pixels from each quadrant. If the there are fewer than three noisy pixels in the level2.evt file, extra rows are filled as -1
| Pixel properties | Quadrant properties | ||||||
|---|---|---|---|---|---|---|---|
| Quadrant | DetID | PixID | Counts | Sigma | Mean | Median | Sigma |
| A | 2 | 250 | 63349 | 434.29 | 722 | 709 | 144.2 |
| A | 1 | 162 | 22098 | 148.29 | 722 | 709 | 144.2 |
| A | 0 | 226 | 6622 | 41.0 | 722 | 709 | 144.2 |
| B | 0 | 182 | 206601 | 1579.42 | 711 | 695 | 130.4 |
| B | 3 | 64 | 100943 | 768.96 | 711 | 695 | 130.4 |
| B | 0 | 189 | 46914 | 354.53 | 711 | 695 | 130.4 |
| C | 3 | 233 | 178442 | 1114.53 | 703 | 707 | 159.5 |
| C | 0 | 207 | 15668 | 93.81 | 703 | 707 | 159.5 |
| C | 13 | 61 | 5097 | 27.53 | 703 | 707 | 159.5 |
| D | 13 | 249 | 497307 | 2946.7 | 702 | 683 | 168.5 |
| D | 5 | 222 | 160350 | 947.38 | 702 | 683 | 168.5 |
| D | 12 | 110 | 112448 | 663.15 | 702 | 683 | 168.5 |
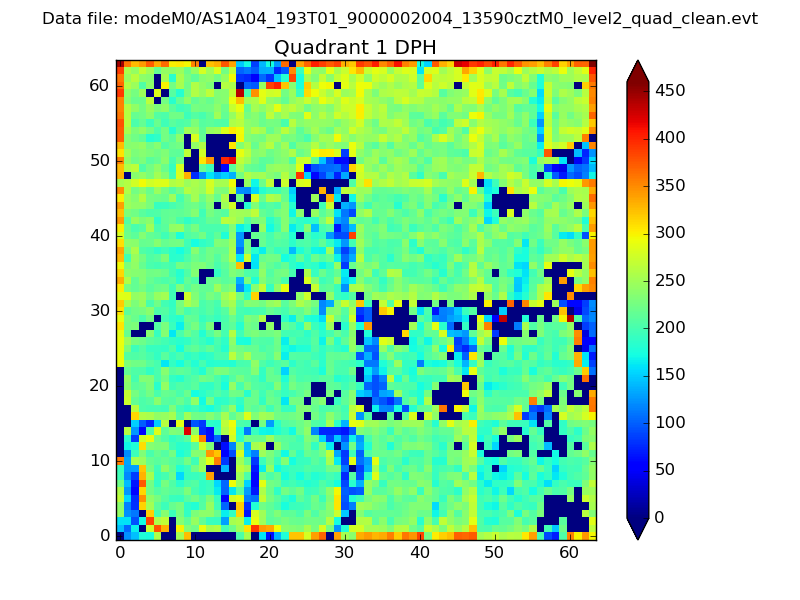
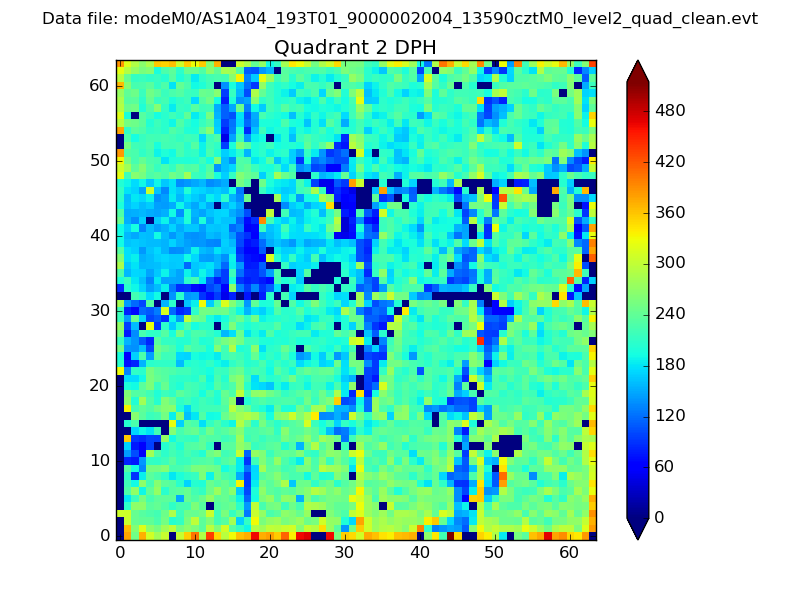
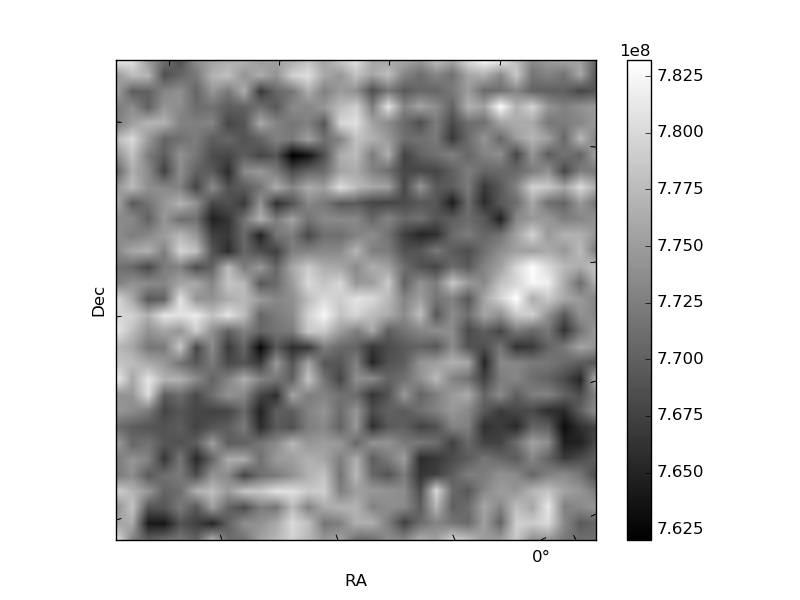
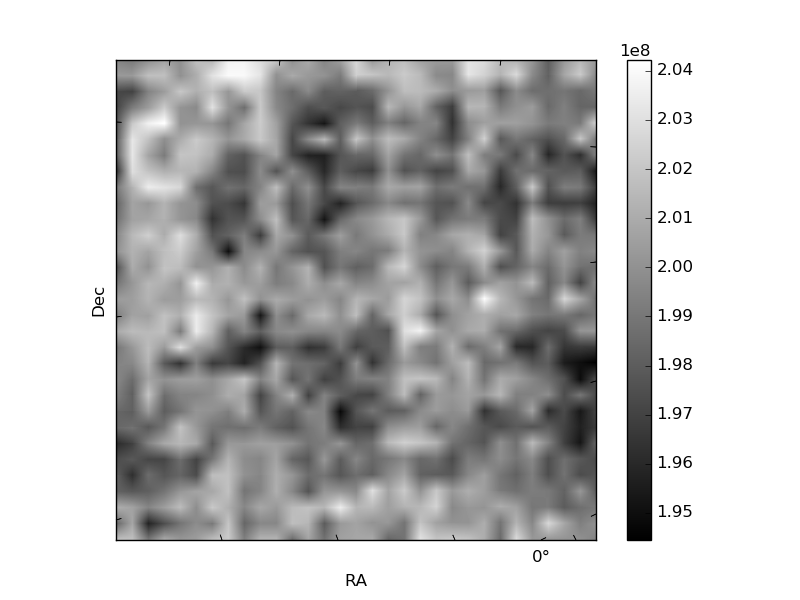
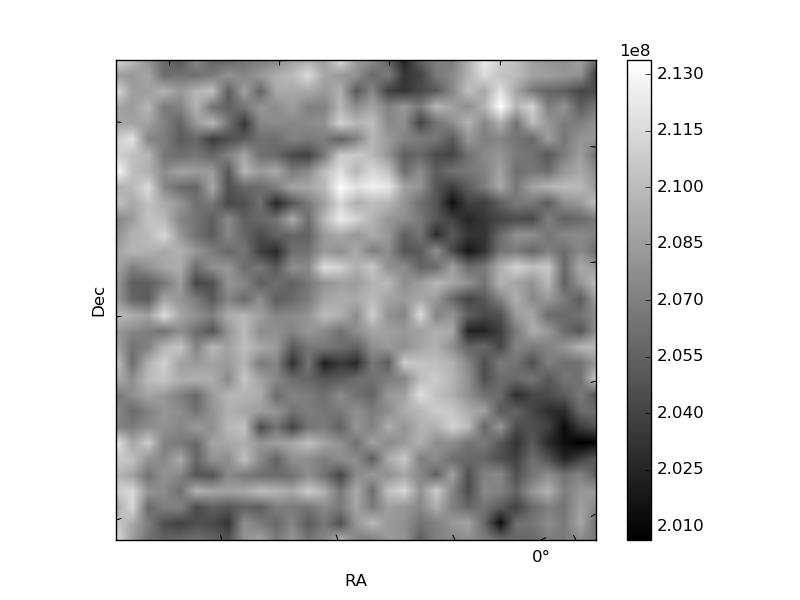
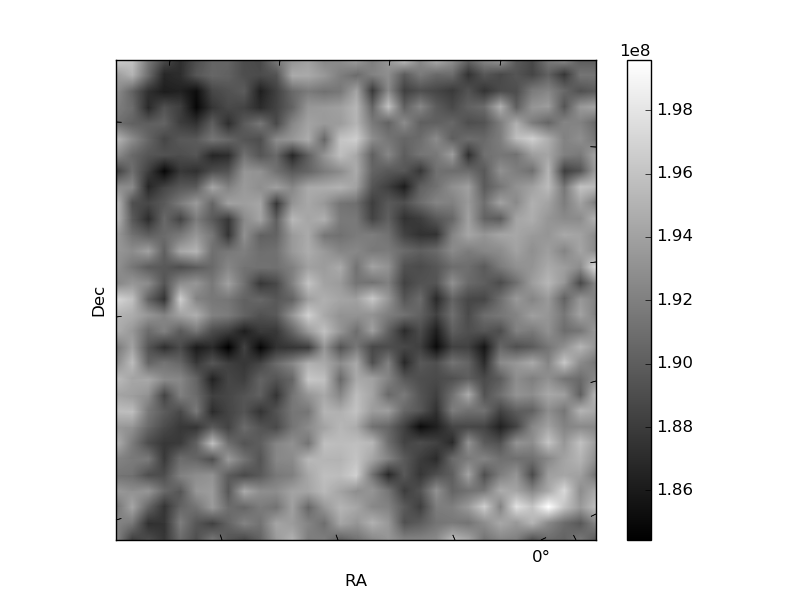
Histogram calculated using DETX and DETY for each event in the final _common_clean file
| Quadrant A | 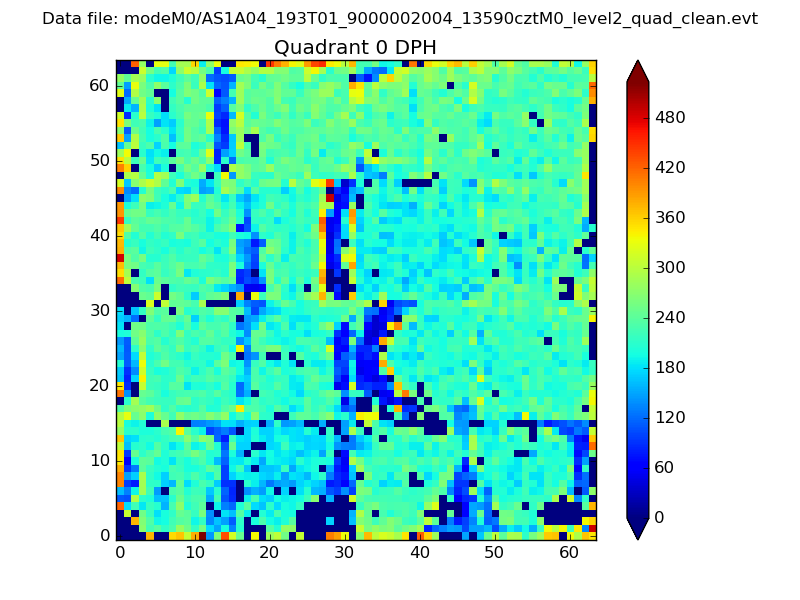 |
 |
Quadrant B |
|---|---|---|---|
| Quadrant D | 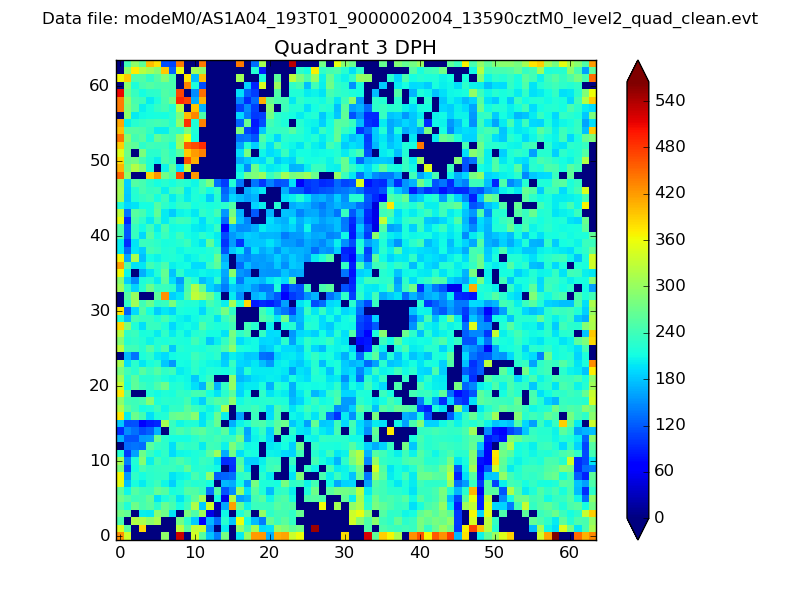 |
 |
Quadrant C |
| Plot type | Count rate plots | Images |
|---|---|---|
| Comparison with Poisson distribution Blue bars denote a histogram of data divided into 1 sec bins. Red curve is a Poisson curve with rate = median count rate of data. |
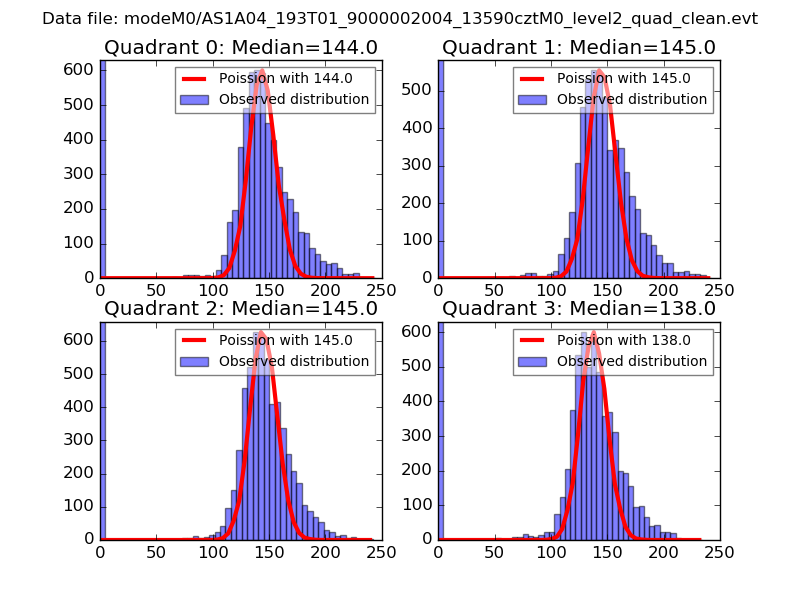 |
 |
| Quadrant-wise count rates Data is divided into 100 sec bins |
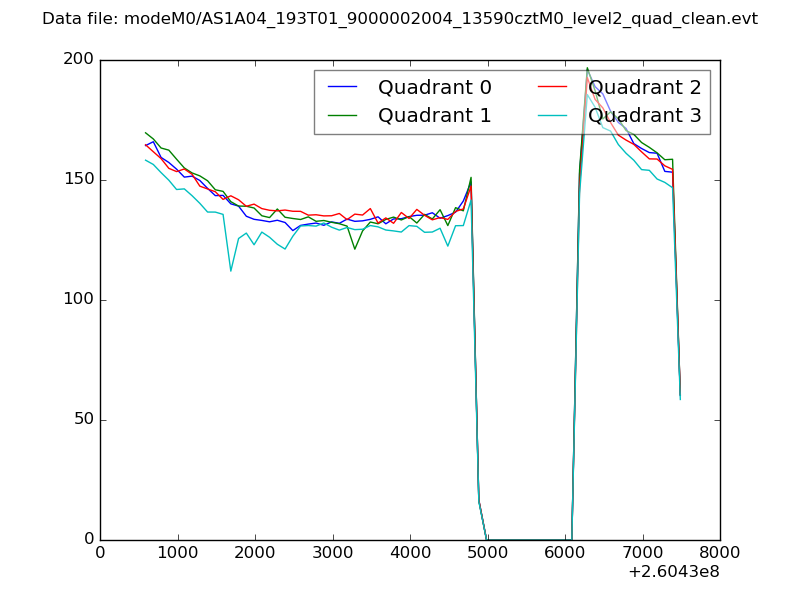 |
|
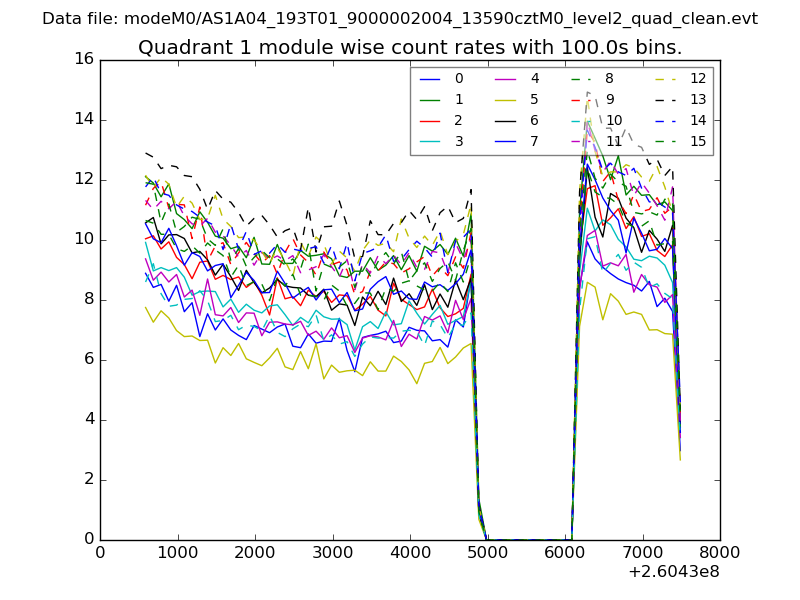
| Module-wise count rates for Quadrant A Data is divided into 100 sec bins |
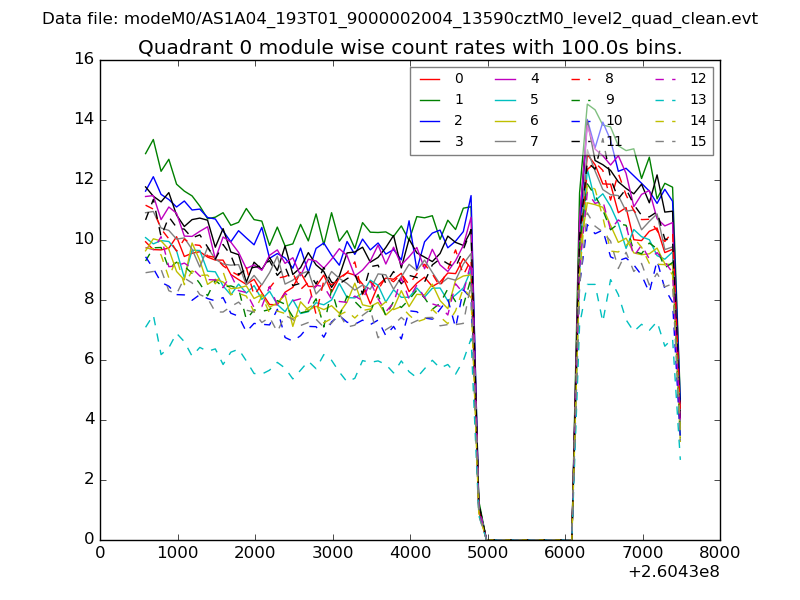 |
 |
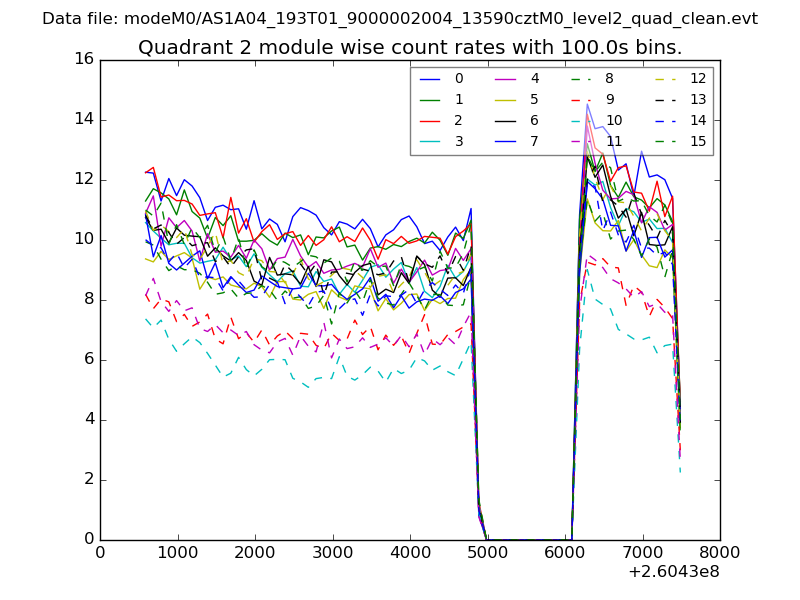
| Module-wise count rates for Quadrant B Data is divided into 100 sec bins |
 |
 |
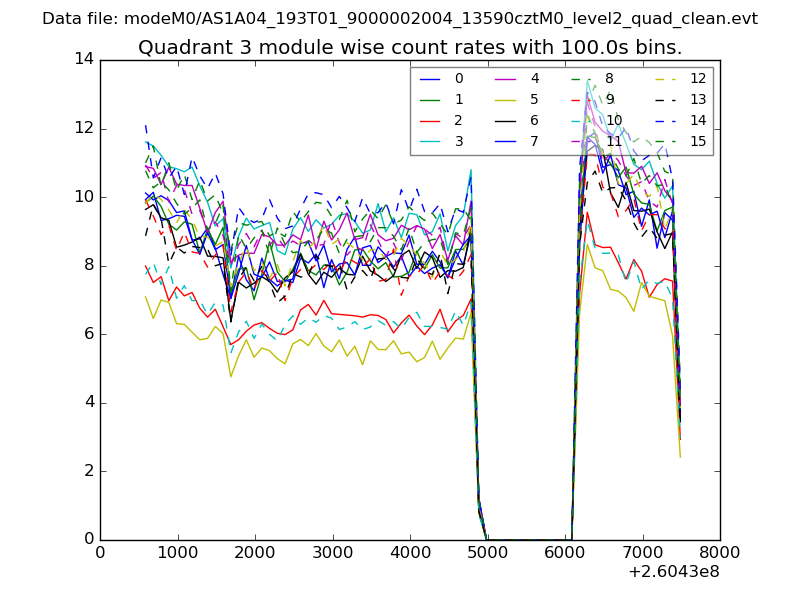
| Module-wise count rates for Quadrant C Data is divided into 100 sec bins |
 |
 |
| Module-wise count rates for Quadrant D Data is divided into 100 sec bins |
 |
 |
| Parameter | Plot |
|---|---|
| CZT HV Monitor | 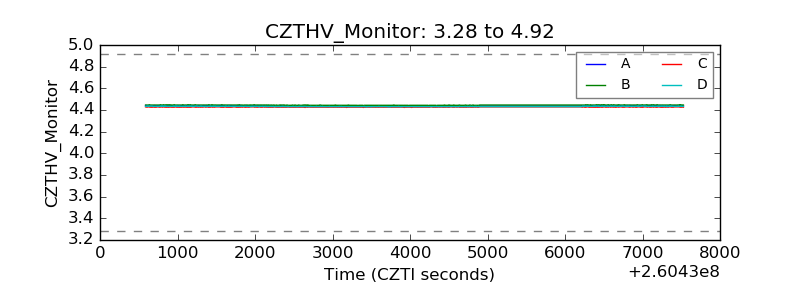 |
| D_VDD | 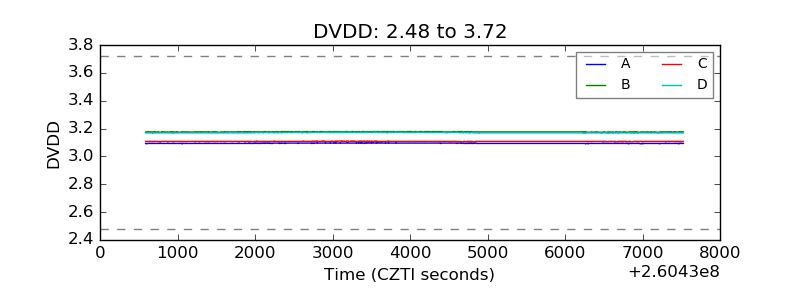 |
| Temperature 1 | 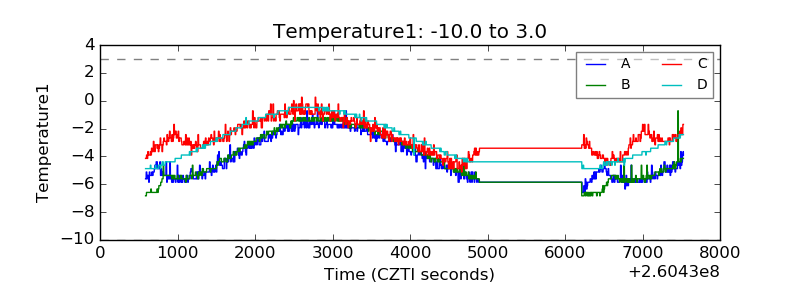 |
| Veto HV Monitor | 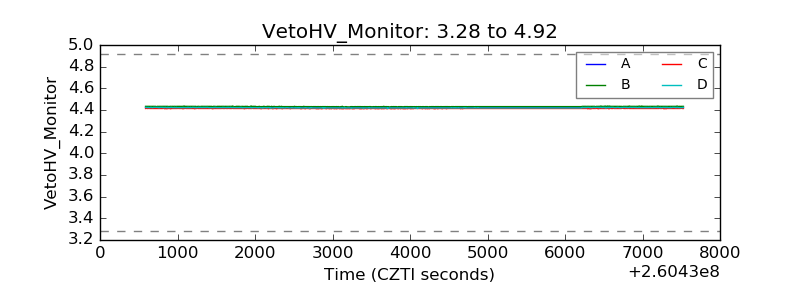 |
| Veto LLD |  |
| Alpha Counter | 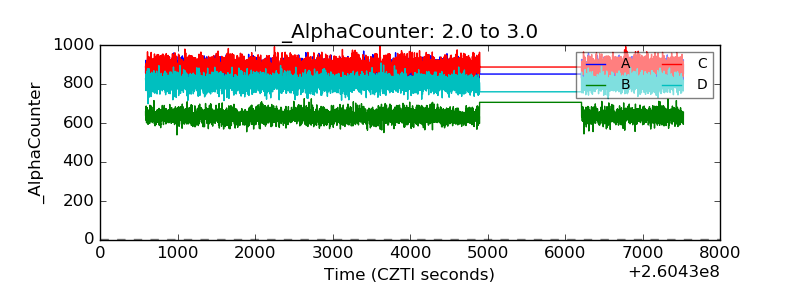 |
| _CPM_Rate | 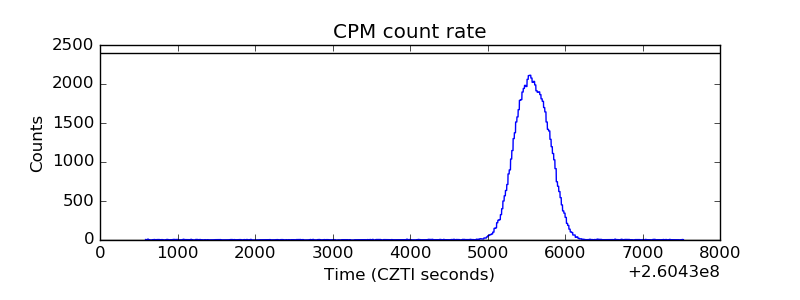 |
| CZT Counter | 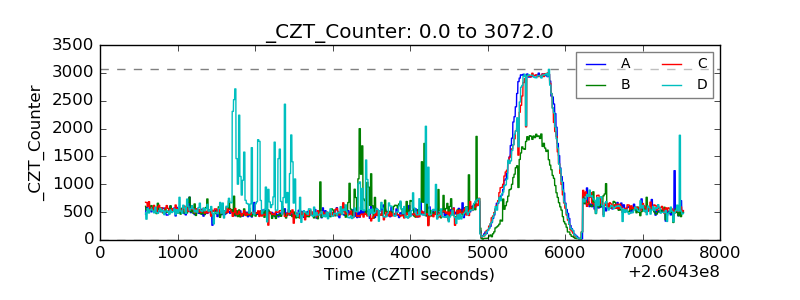 |
| +2.5 Volts monitor |  |
| +5 Volts monitor |  |
| _ROLL_ROT | 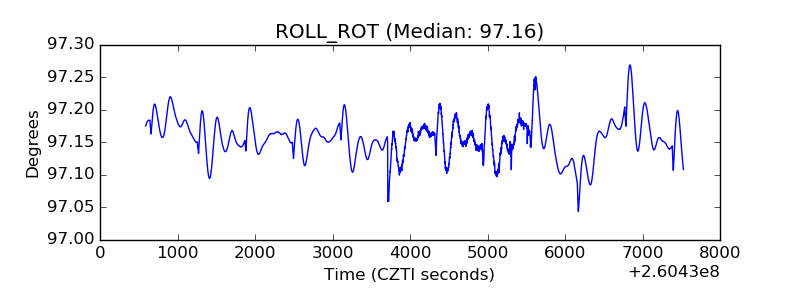 |
| _Roll_DEC | 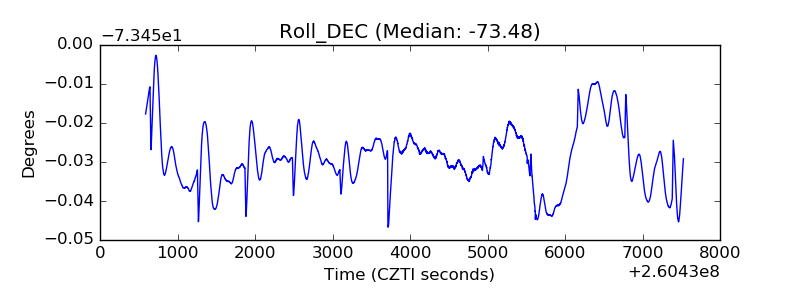 |
| _Roll_RA | 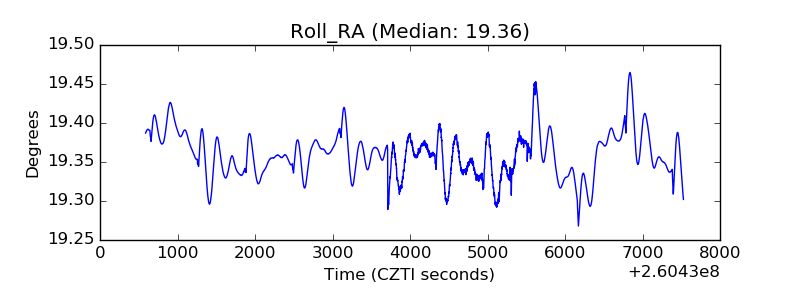 |
| Veto Counter | 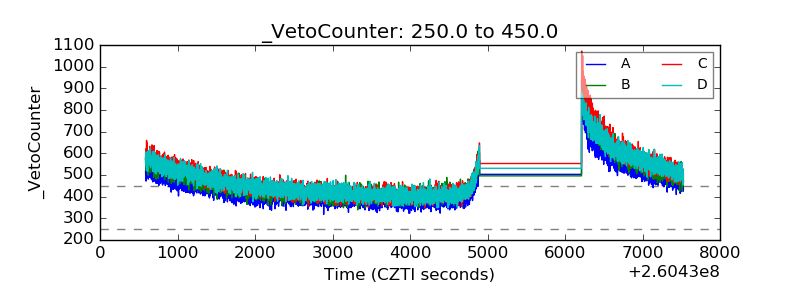 |