| Param | Original file | Final file |
|---|---|---|
| Filename | modeM0/AS1A04_193T01_9000002004_13591cztM0_level2.evt | modeM0/AS1A04_193T01_9000002004_13591cztM0_level2_quad_clean.evt |
| Size (bytes) | 561,000,960 | 138,248,640 |
| Size | 535.0 MB | 131.8 MB |
| Events in quadrant A | 3,268,201 | 963,776 |
| Events in quadrant B | 4,715,749 | 931,451 |
| Events in quadrant C | 3,435,650 | 953,860 |
| Events in quadrant D | 5,133,014 | 887,880 |
| Mode M0 | |||
|---|---|---|---|
| Quadrant | BADHDUFLAG | Total packets | Discarded packets |
| A | 0 | 13616 | 2 |
| B | 0 | 17939 | 1 |
| C | 0 | 14183 | 1 |
| D | 0 | 19527 | 1 |
| Mode SS | |||
|---|---|---|---|
| Quadrant | BADHDUFLAG | Total packets | Discarded packets |
| A | 0 | 130 | 0 |
| B | 0 | 130 | 0 |
| C | 0 | 130 | 0 |
| D | 0 | 130 | 0 |
| Mode M9 | |||
|---|---|---|---|
| Quadrant | BADHDUFLAG | Total packets | Discarded packets |
| A | 0 | 13 | 0 |
| B | 0 | 13 | 0 |
| C | 0 | 13 | 0 |
| D | 0 | 13 | 0 |
| Quadrant | Total seconds | Saturated seconds | Saturation percentage |
|---|---|---|---|
| A | 6456 | 70 | 1.084263% |
| B | 6456 | 576 | 8.921933% |
| C | 6456 | 60 | 0.929368% |
| D | 6456 | 571 | 8.844486% |
Noise dominated data is calculated using 1-second bins in cleaned event files. If a bin has >2000 counts, and if more than 50% of those come from <1% of pixels, then it is considered to be noise-dominated and hence unusable.
| Quadrant | # 1 sec bins | Bins with >0 counts | Bins with >2000 counts | High rate bins dominated by noise | Noise dominated (total time) | Noise dominated (detector-on time) | Marked lightcurve |
|---|---|---|---|---|---|---|---|
| A | 7742 | 6458 | 1 | 1 | 0.01% | 0.02% | 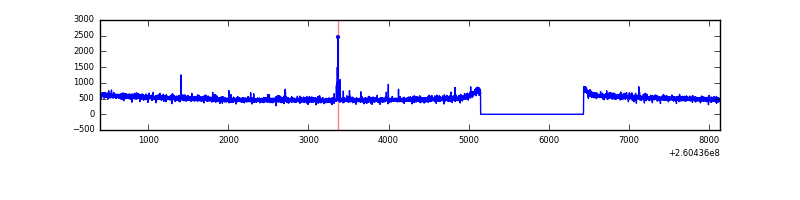 |
| B | 7742 | 6458 | 464 | 464 | 5.99% | 7.18% | 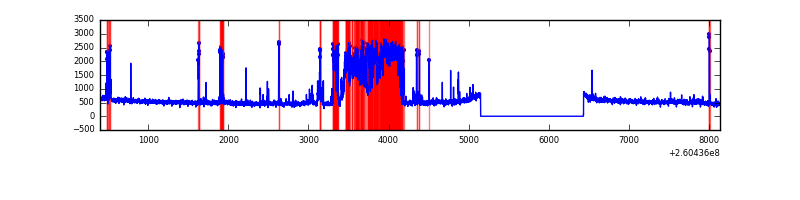 |
| C | 7742 | 6458 | 2 | 2 | 0.03% | 0.03% | 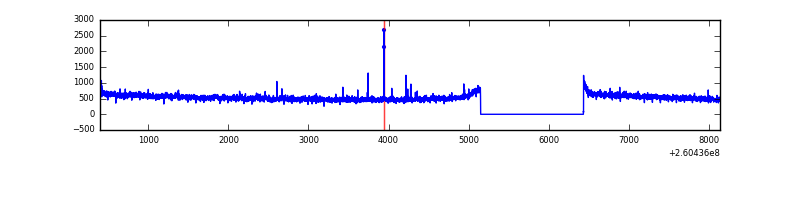 |
| D | 7742 | 6458 | 411 | 411 | 5.31% | 6.36% | 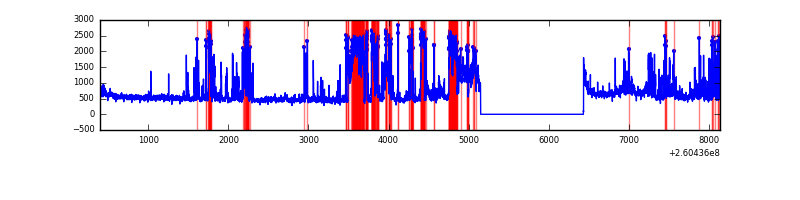 |
Top three noisy pixels from each quadrant. If the there are fewer than three noisy pixels in the level2.evt file, extra rows are filled as -1
| Pixel properties | Quadrant properties | ||||||
|---|---|---|---|---|---|---|---|
| Quadrant | DetID | PixID | Counts | Sigma | Mean | Median | Sigma |
| A | 9 | 143 | 15649 | 89.25 | 838 | 823 | 166.1 |
| A | 1 | 162 | 15289 | 87.08 | 838 | 823 | 166.1 |
| A | 0 | 226 | 7671 | 41.22 | 838 | 823 | 166.1 |
| B | 0 | 182 | 1368153 | 9255.24 | 804 | 786 | 147.7 |
| B | 3 | 64 | 136939 | 921.57 | 804 | 786 | 147.7 |
| B | 0 | 214 | 28431 | 187.12 | 804 | 786 | 147.7 |
| C | 3 | 233 | 234914 | 1272.06 | 813 | 817 | 184.0 |
| C | 0 | 207 | 28811 | 152.12 | 813 | 817 | 184.0 |
| C | 13 | 61 | 5933 | 27.8 | 813 | 817 | 184.0 |
| D | 13 | 122 | 1479048 | 7875.4 | 798 | 779 | 187.7 |
| D | 13 | 249 | 290362 | 1542.74 | 798 | 779 | 187.7 |
| D | 5 | 222 | 262727 | 1395.51 | 798 | 779 | 187.7 |
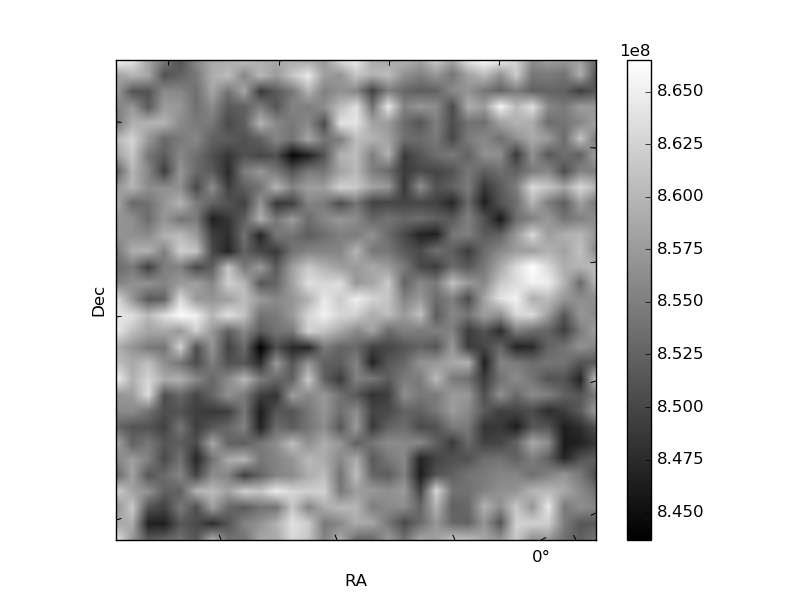
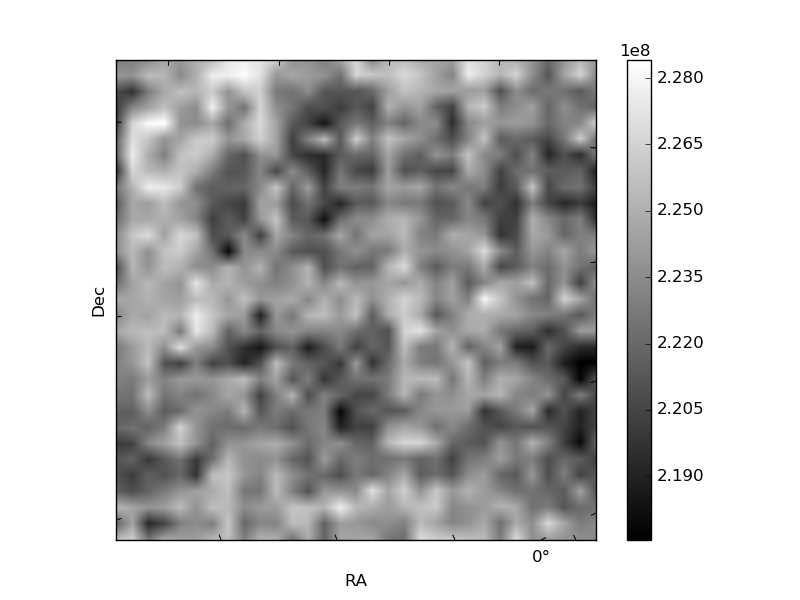
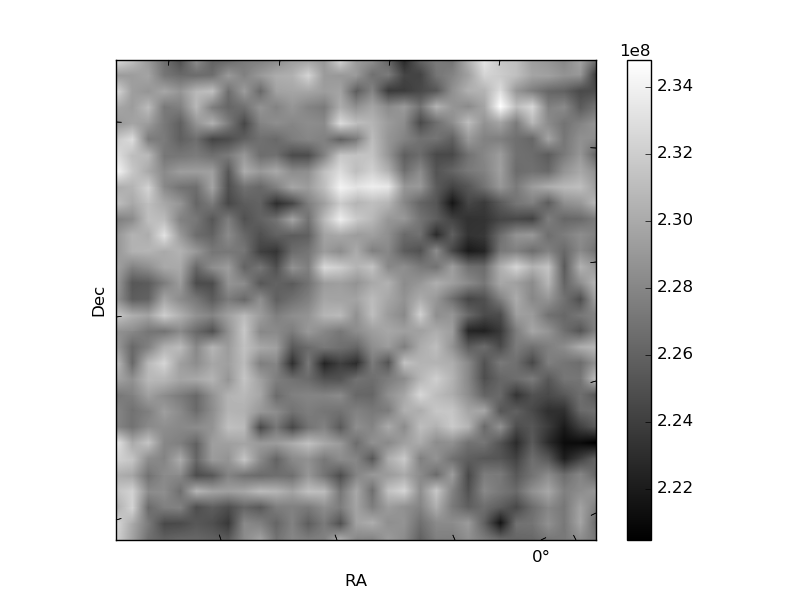
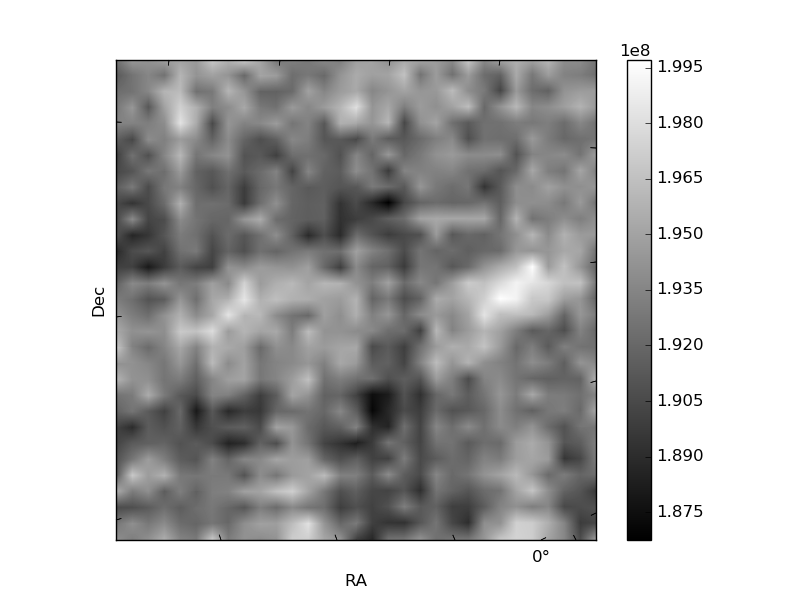
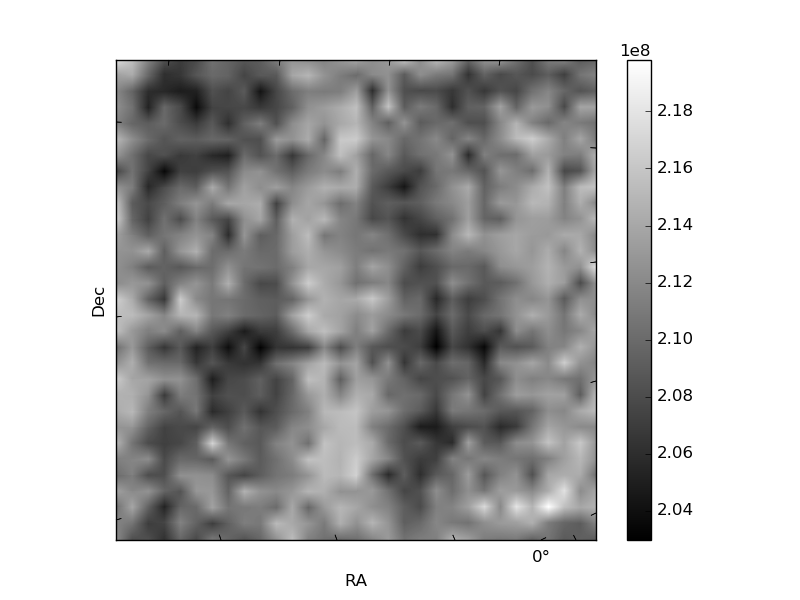
Histogram calculated using DETX and DETY for each event in the final _common_clean file
| Quadrant A | 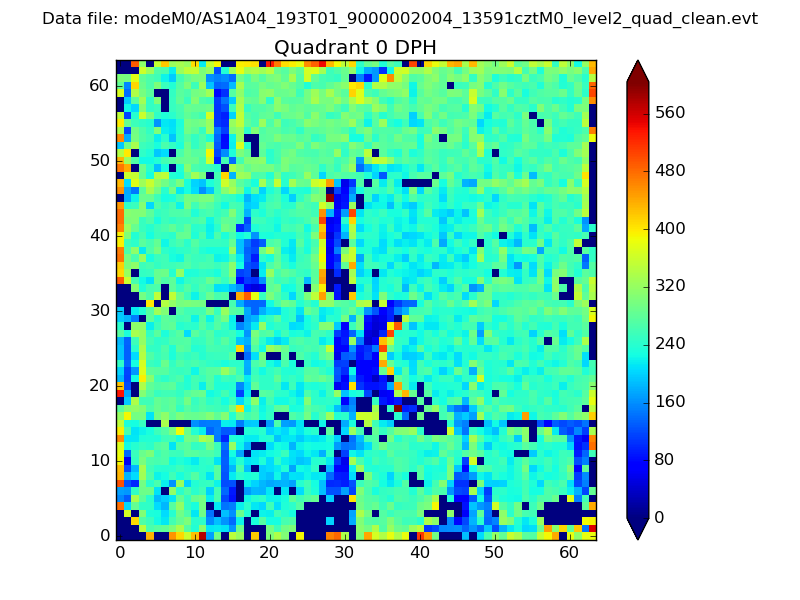 |
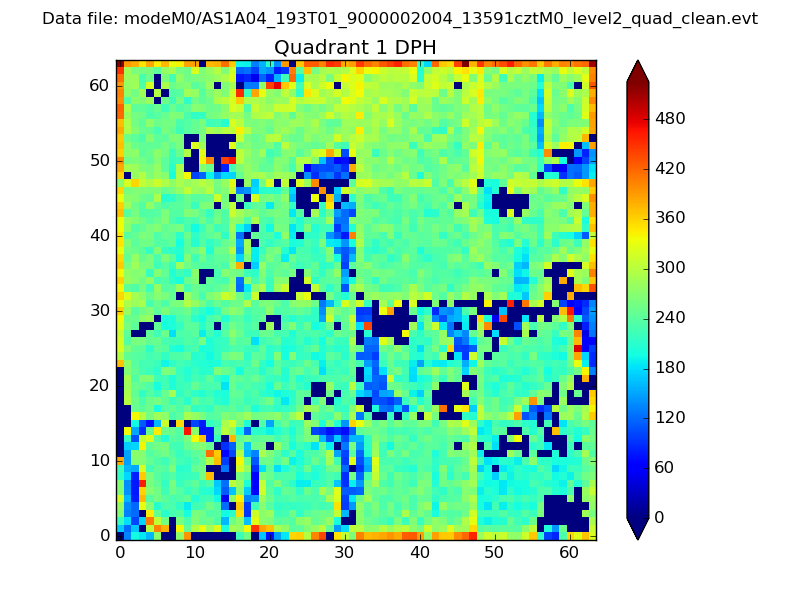 |
Quadrant B |
|---|---|---|---|
| Quadrant D | 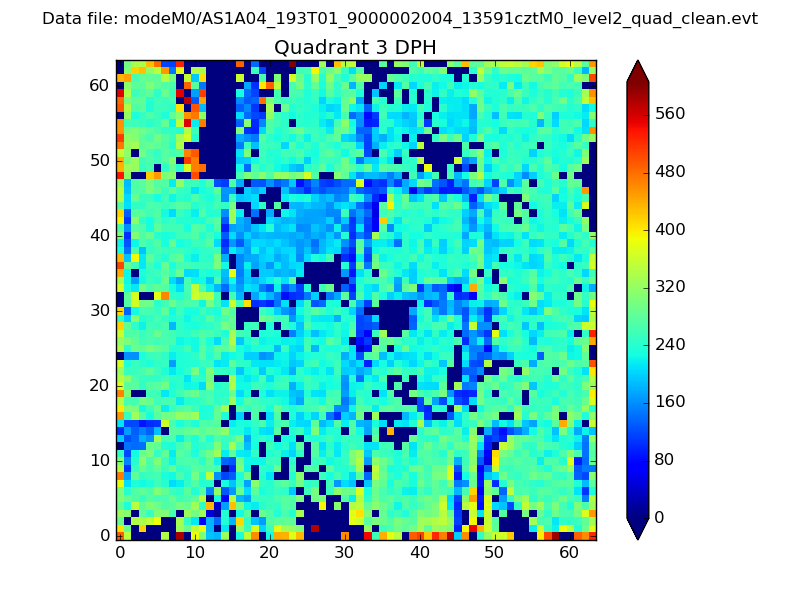 |
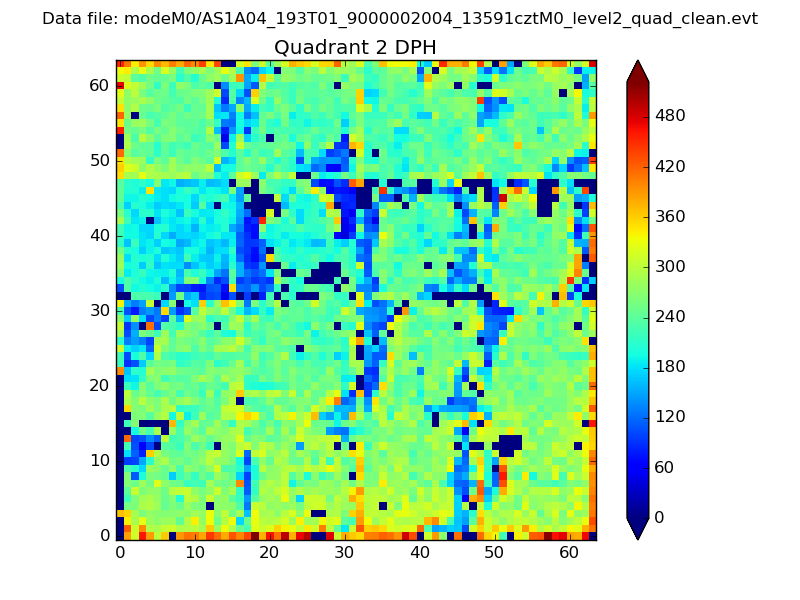 |
Quadrant C |
| Plot type | Count rate plots | Images |
|---|---|---|
| Comparison with Poisson distribution Blue bars denote a histogram of data divided into 1 sec bins. Red curve is a Poisson curve with rate = median count rate of data. |
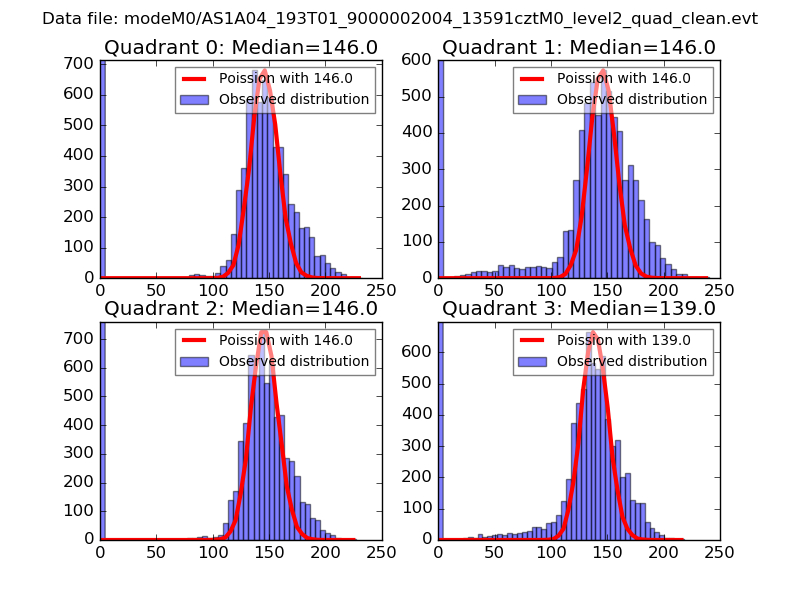 |
 |
| Quadrant-wise count rates Data is divided into 100 sec bins |
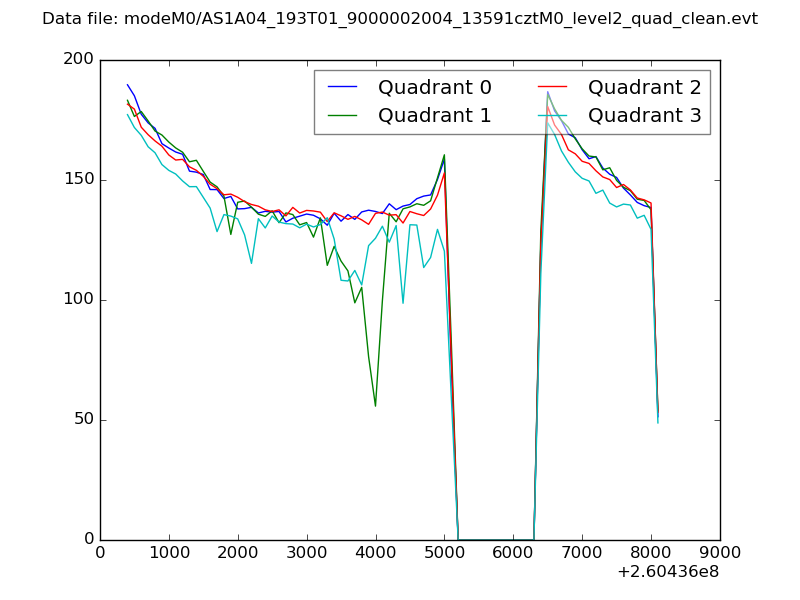 |
|
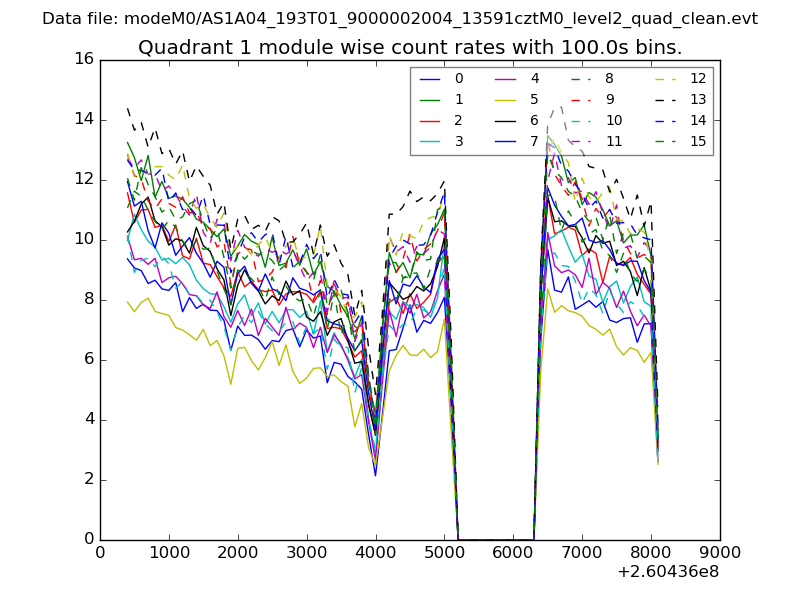
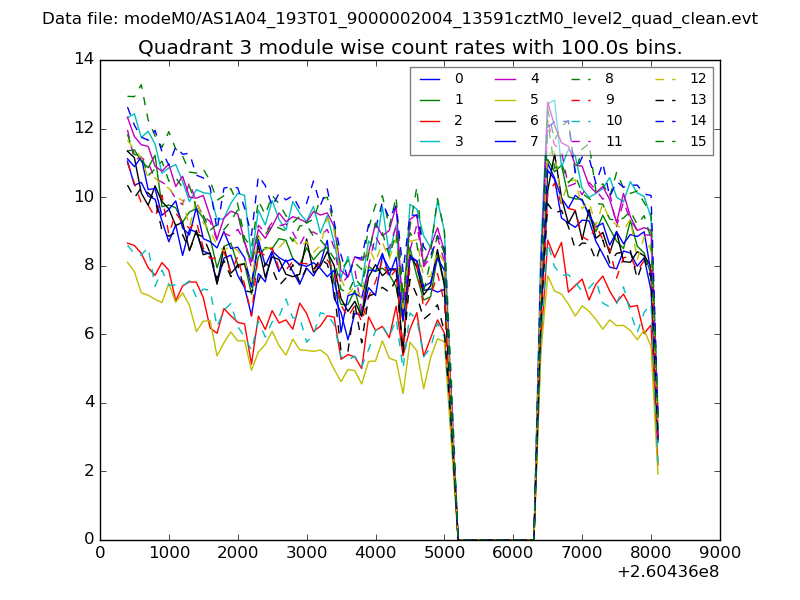
| Module-wise count rates for Quadrant A Data is divided into 100 sec bins |
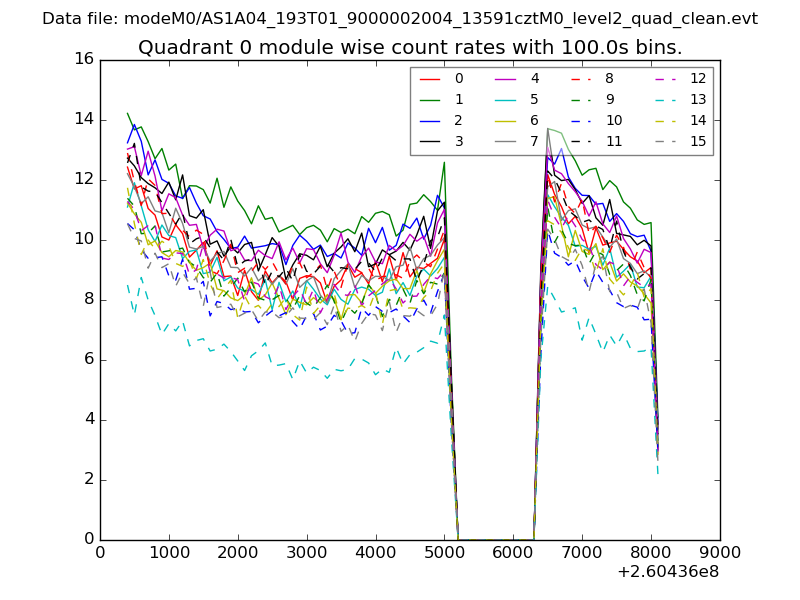 |
 |
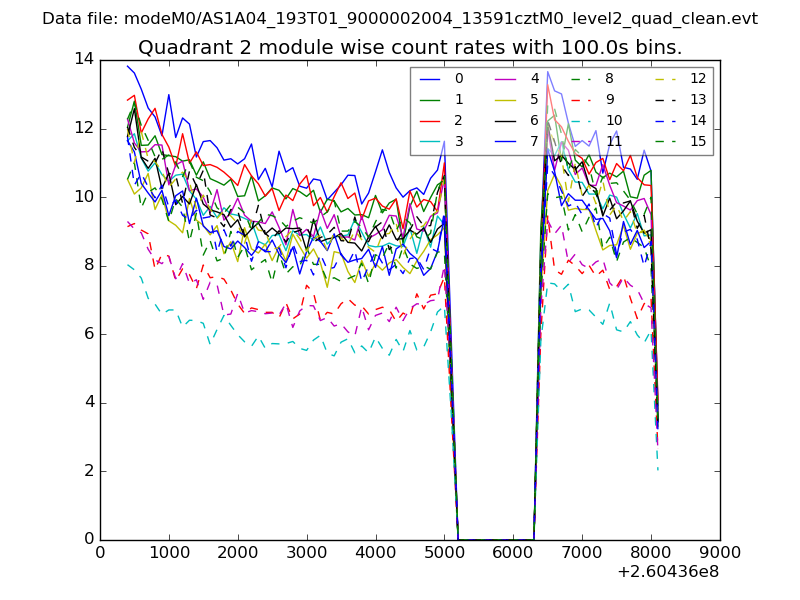
| Module-wise count rates for Quadrant B Data is divided into 100 sec bins |
 |
 |
| Module-wise count rates for Quadrant C Data is divided into 100 sec bins |
 |
 |
| Module-wise count rates for Quadrant D Data is divided into 100 sec bins |
 |
 |
| Parameter | Plot |
|---|---|
| CZT HV Monitor | 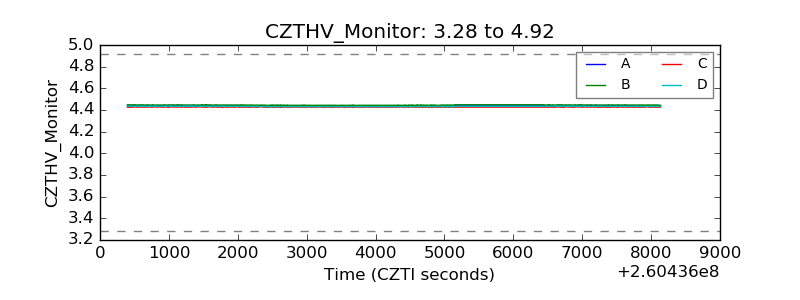 |
| D_VDD | 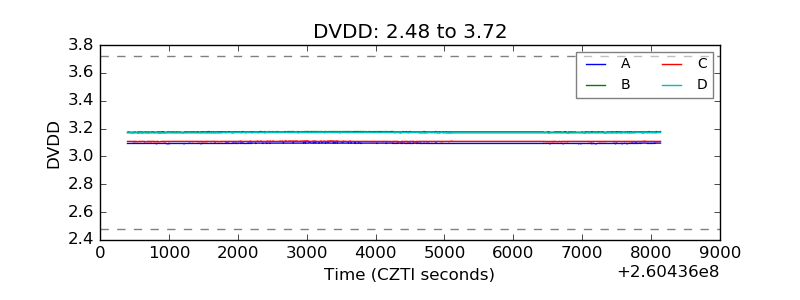 |
| Temperature 1 |  |
| Veto HV Monitor | 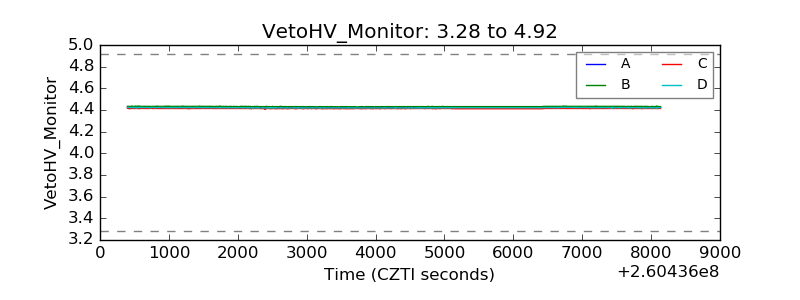 |
| Veto LLD |  |
| Alpha Counter | 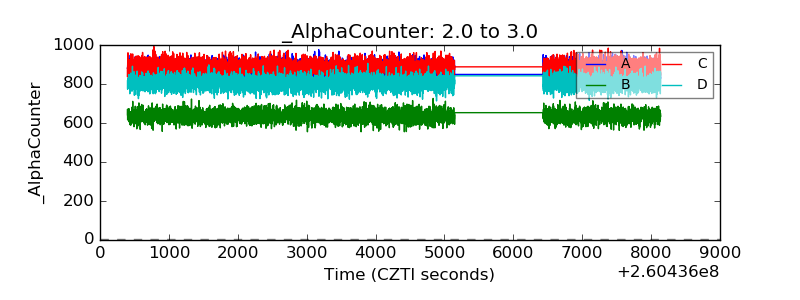 |
| _CPM_Rate | 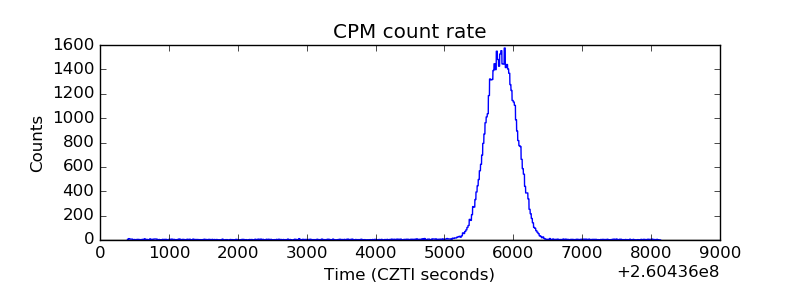 |
| CZT Counter | 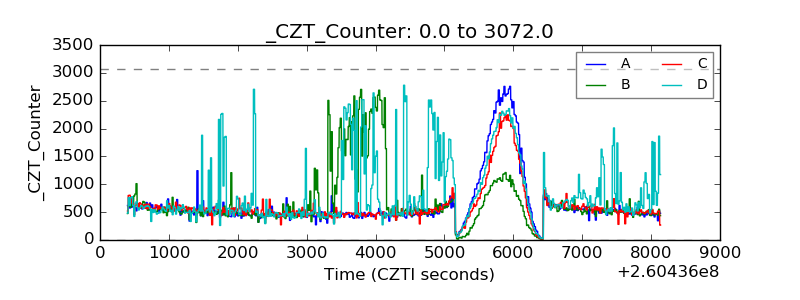 |
| +2.5 Volts monitor |  |
| +5 Volts monitor |  |
| _ROLL_ROT |  |
| _Roll_DEC |  |
| _Roll_RA | 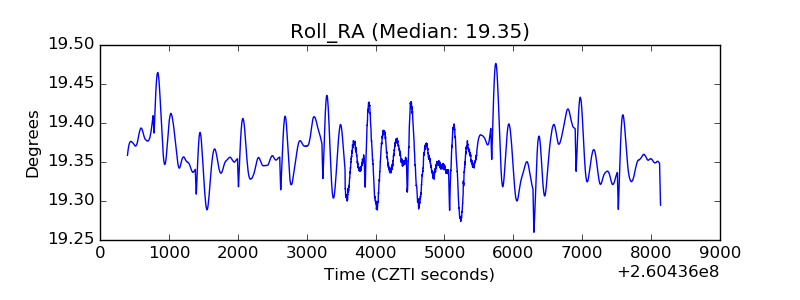 |
| Veto Counter | 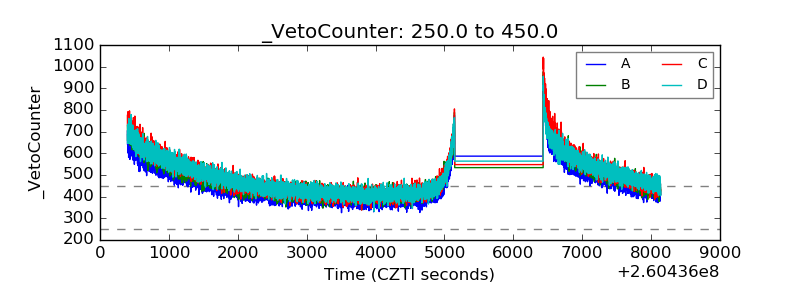 |