| Param | Original file | Final file |
|---|---|---|
| Filename | modeM0/AS1A04_193T01_9000002004_13593cztM0_level2.evt | modeM0/AS1A04_193T01_9000002004_13593cztM0_level2_quad_clean.evt |
| Size (bytes) | 537,514,560 | 124,787,520 |
| Size | 512.6 MB | 119.0 MB |
| Events in quadrant A | 3,074,759 | 858,289 |
| Events in quadrant B | 3,491,948 | 854,958 |
| Events in quadrant C | 3,117,027 | 851,305 |
| Events in quadrant D | 6,156,297 | 763,557 |
| Mode M0 | |||
|---|---|---|---|
| Quadrant | BADHDUFLAG | Total packets | Discarded packets |
| A | 0 | 13321 | 2 |
| B | 0 | 14441 | 1 |
| C | 0 | 13360 | 1 |
| D | 0 | 22476 | 1 |
| Mode SS | |||
|---|---|---|---|
| Quadrant | BADHDUFLAG | Total packets | Discarded packets |
| A | 0 | 132 | 0 |
| B | 0 | 132 | 0 |
| C | 0 | 132 | 0 |
| D | 0 | 132 | 0 |
| Mode M9 | |||
|---|---|---|---|
| Quadrant | BADHDUFLAG | Total packets | Discarded packets |
| A | 0 | 10 | 0 |
| B | 0 | 10 | 0 |
| C | 0 | 10 | 0 |
| D | 0 | 10 | 0 |
| Quadrant | Total seconds | Saturated seconds | Saturation percentage |
|---|---|---|---|
| A | 6462 | 64 | 0.990405% |
| B | 6462 | 145 | 2.243887% |
| C | 6462 | 39 | 0.603528% |
| D | 6462 | 1027 | 15.892912% |
Noise dominated data is calculated using 1-second bins in cleaned event files. If a bin has >2000 counts, and if more than 50% of those come from <1% of pixels, then it is considered to be noise-dominated and hence unusable.
| Quadrant | # 1 sec bins | Bins with >0 counts | Bins with >2000 counts | High rate bins dominated by noise | Noise dominated (total time) | Noise dominated (detector-on time) | Marked lightcurve |
|---|---|---|---|---|---|---|---|
| A | 7488 | 6464 | 0 | 0 | 0.00% | 0.00% | 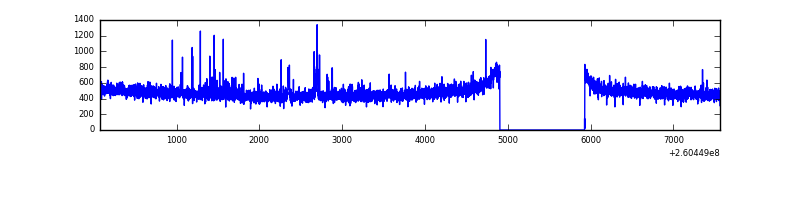 |
| B | 7488 | 6464 | 81 | 81 | 1.08% | 1.25% | 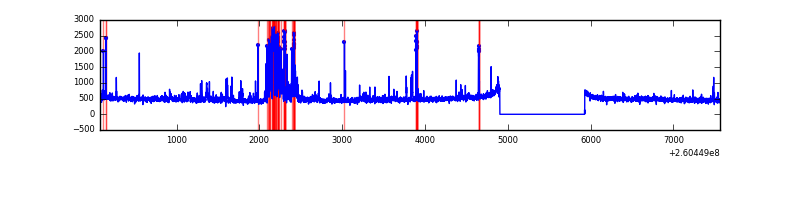 |
| C | 7488 | 6464 | 3 | 3 | 0.04% | 0.05% | 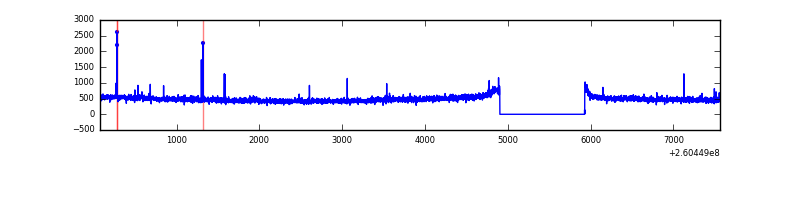 |
| D | 7488 | 6464 | 917 | 917 | 12.25% | 14.19% | 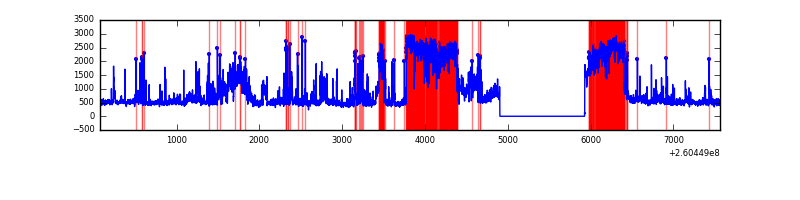 |
Top three noisy pixels from each quadrant. If the there are fewer than three noisy pixels in the level2.evt file, extra rows are filled as -1
| Pixel properties | Quadrant properties | ||||||
|---|---|---|---|---|---|---|---|
| Quadrant | DetID | PixID | Counts | Sigma | Mean | Median | Sigma |
| A | 1 | 162 | 32900 | 206.67 | 776 | 760 | 155.5 |
| A | 2 | 250 | 13615 | 82.66 | 776 | 760 | 155.5 |
| A | 4 | 2 | 11818 | 71.11 | 776 | 760 | 155.5 |
| B | 0 | 182 | 248138 | 1718.09 | 766 | 746 | 144.0 |
| B | 0 | 85 | 92283 | 635.71 | 766 | 746 | 144.0 |
| B | 3 | 64 | 65028 | 446.43 | 766 | 746 | 144.0 |
| C | 3 | 233 | 180812 | 1056.86 | 744 | 747 | 170.4 |
| C | 0 | 207 | 19231 | 108.49 | 744 | 747 | 170.4 |
| C | 14 | 234 | 17045 | 95.66 | 744 | 747 | 170.4 |
| D | 13 | 122 | 2816523 | 16494.09 | 713 | 691 | 170.7 |
| D | 5 | 222 | 308390 | 1802.39 | 713 | 691 | 170.7 |
| D | 8 | 195 | 249721 | 1458.72 | 713 | 691 | 170.7 |
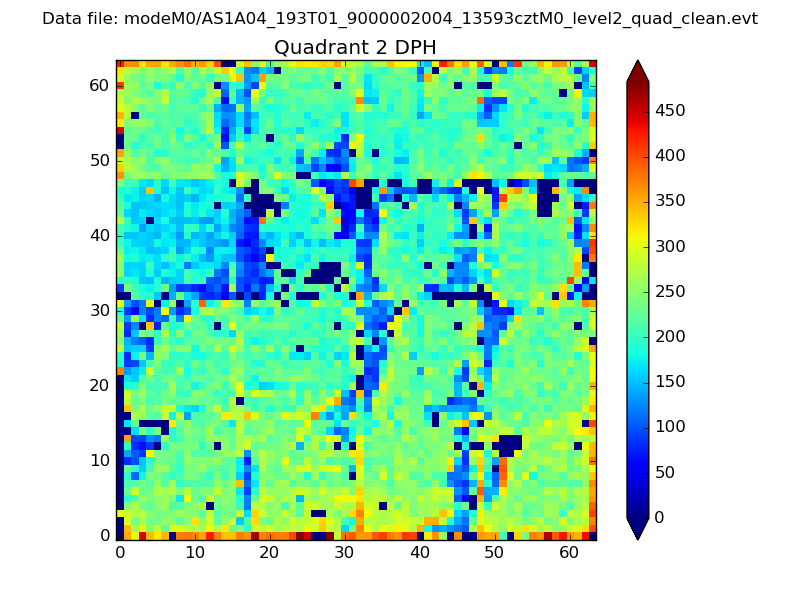
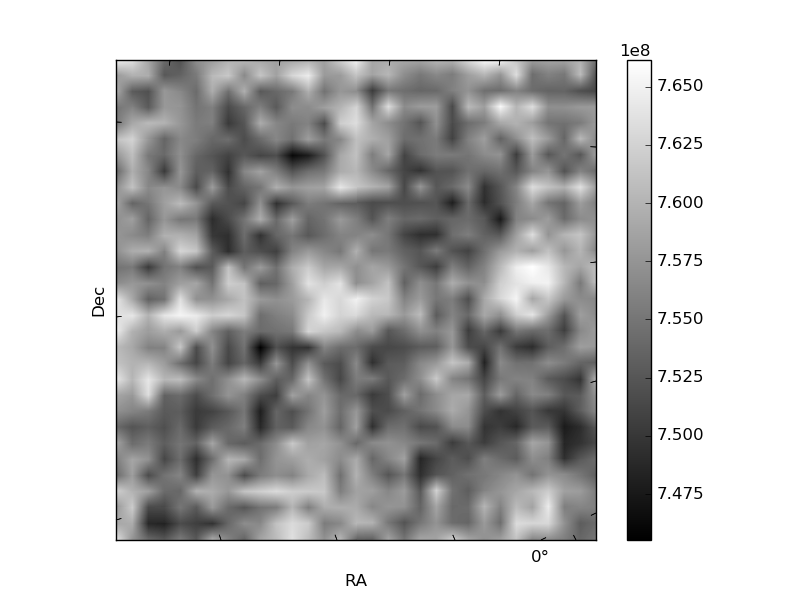
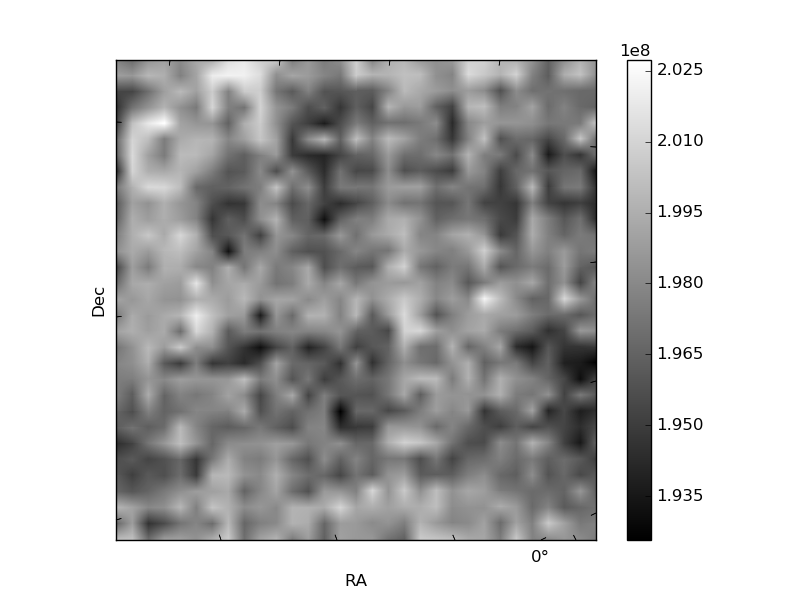
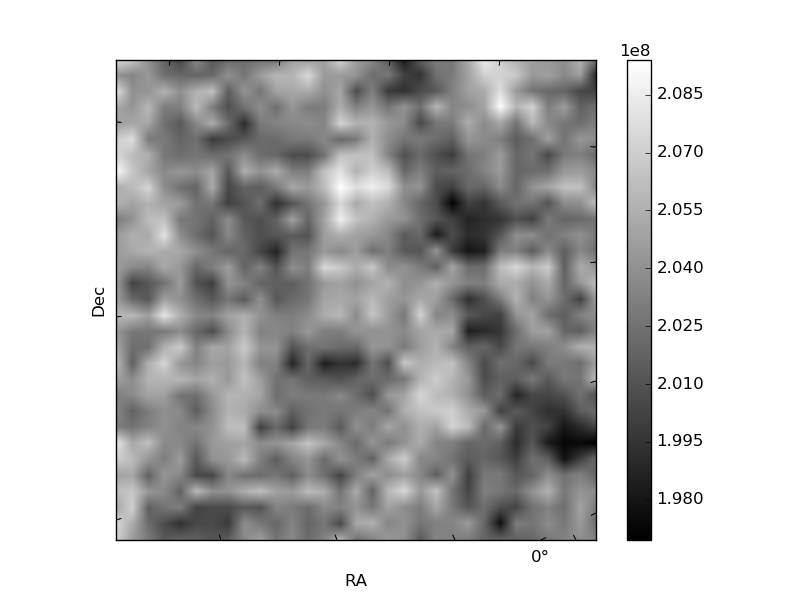
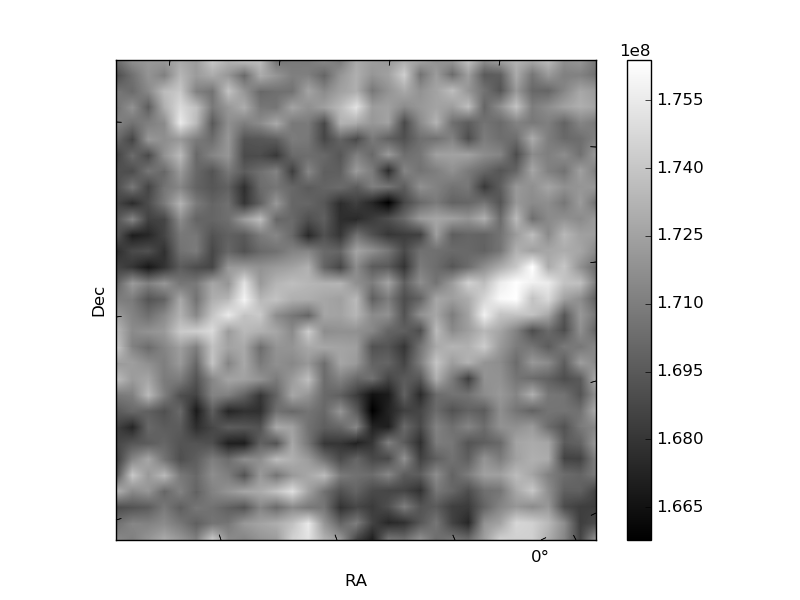
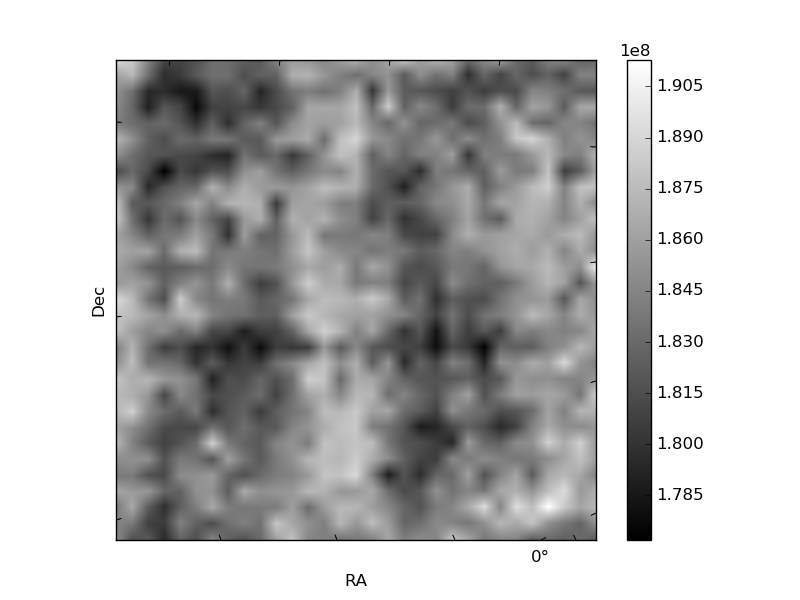
Histogram calculated using DETX and DETY for each event in the final _common_clean file
| Quadrant A | 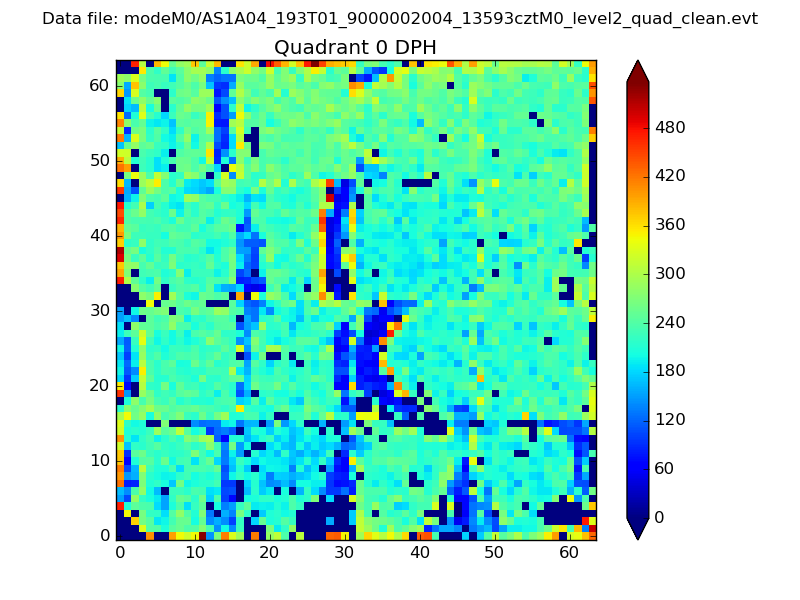 |
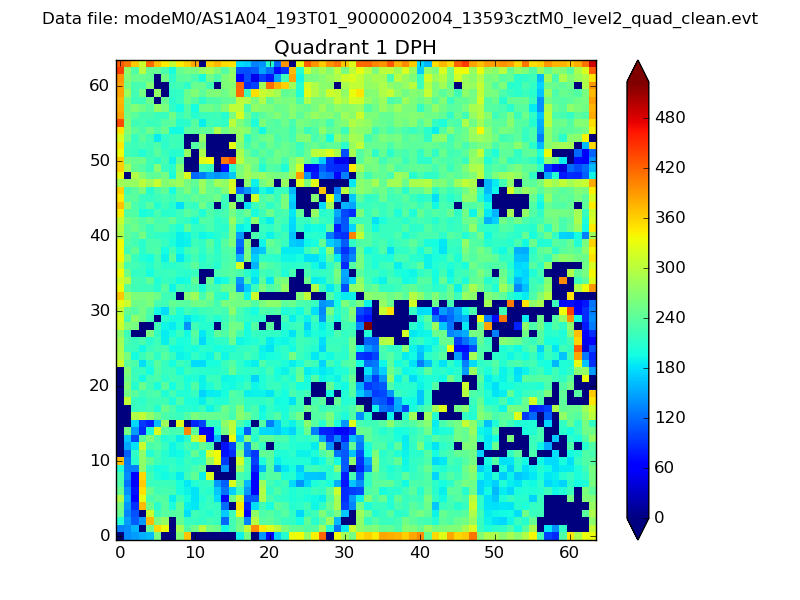 |
Quadrant B |
|---|---|---|---|
| Quadrant D | 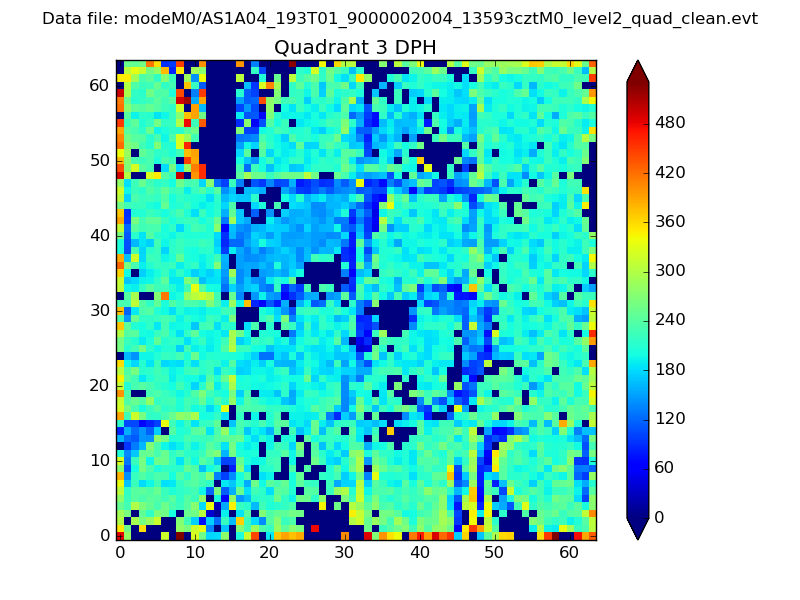 |
 |
Quadrant C |
| Plot type | Count rate plots | Images |
|---|---|---|
| Comparison with Poisson distribution Blue bars denote a histogram of data divided into 1 sec bins. Red curve is a Poisson curve with rate = median count rate of data. |
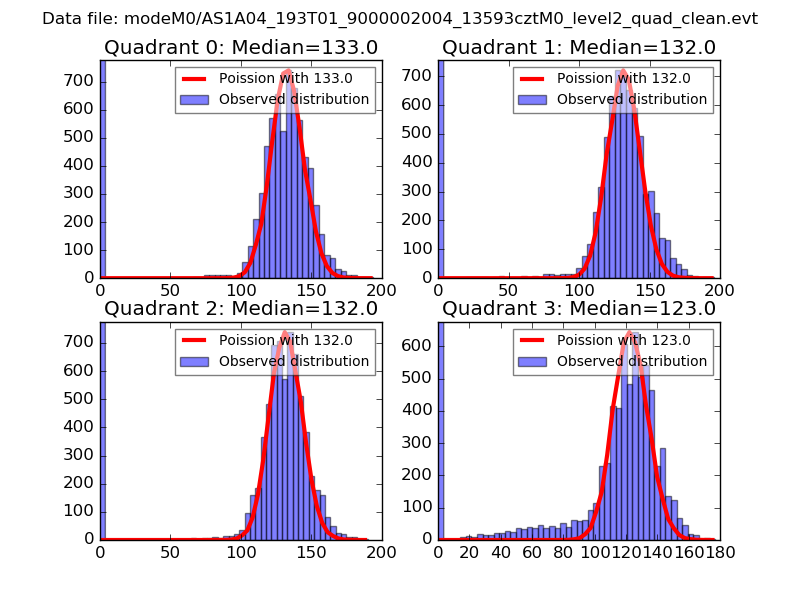 |
 |
| Quadrant-wise count rates Data is divided into 100 sec bins |
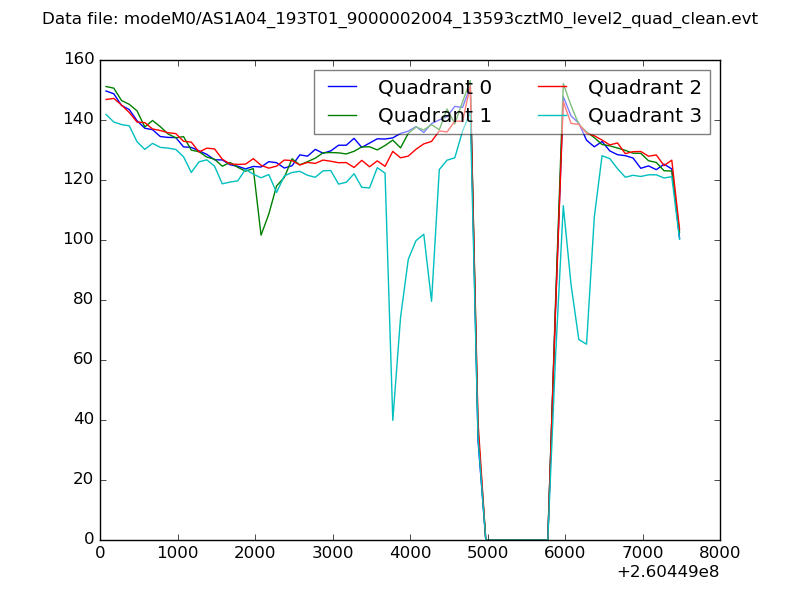 |
|
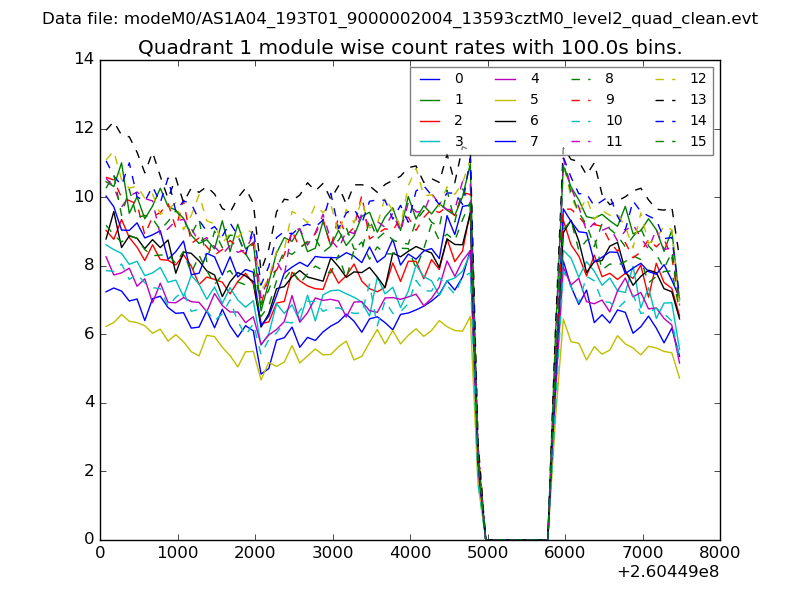
| Module-wise count rates for Quadrant A Data is divided into 100 sec bins |
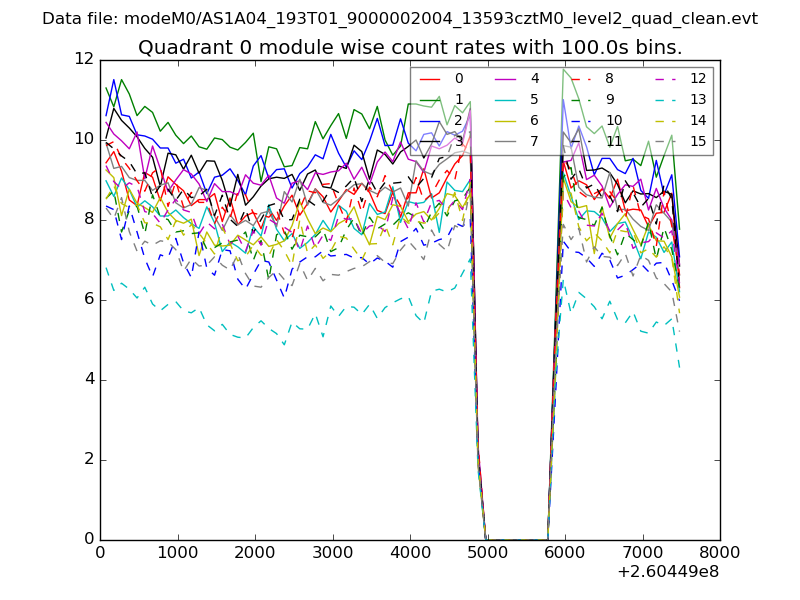 |
 |
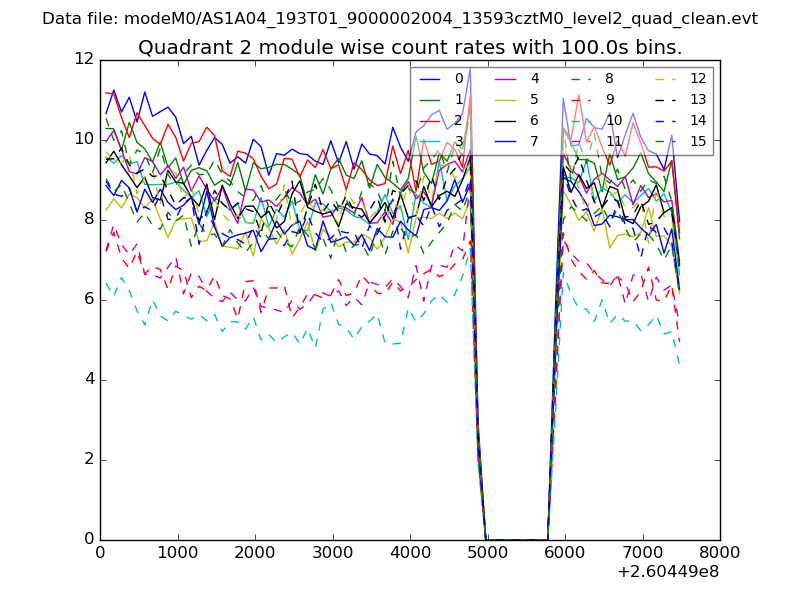
| Module-wise count rates for Quadrant B Data is divided into 100 sec bins |
 |
 |
| Module-wise count rates for Quadrant C Data is divided into 100 sec bins |
 |
 |
| Module-wise count rates for Quadrant D Data is divided into 100 sec bins |
 |
 |
| Parameter | Plot |
|---|---|
| CZT HV Monitor | 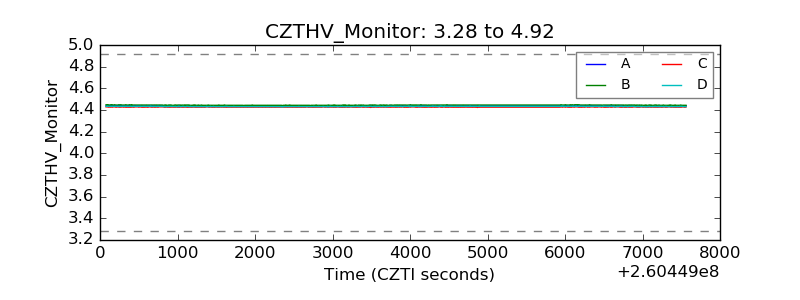 |
| D_VDD | 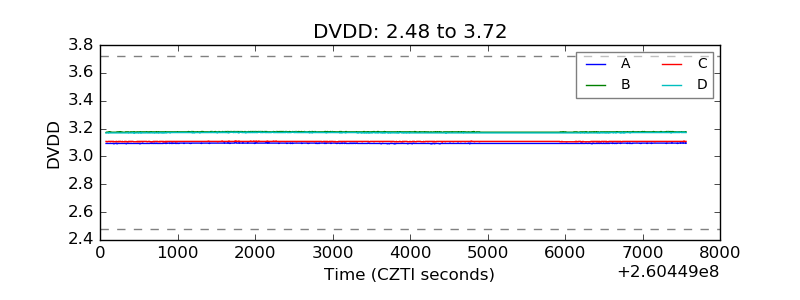 |
| Temperature 1 | 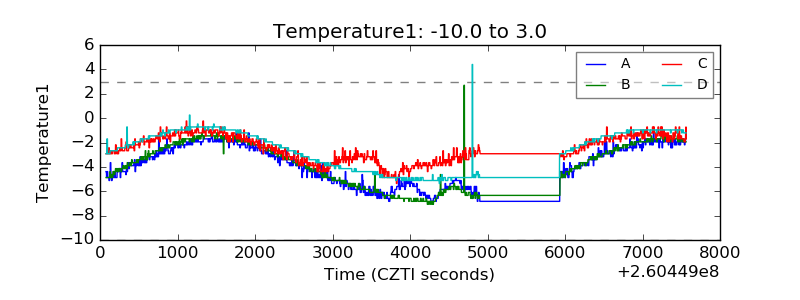 |
| Veto HV Monitor | 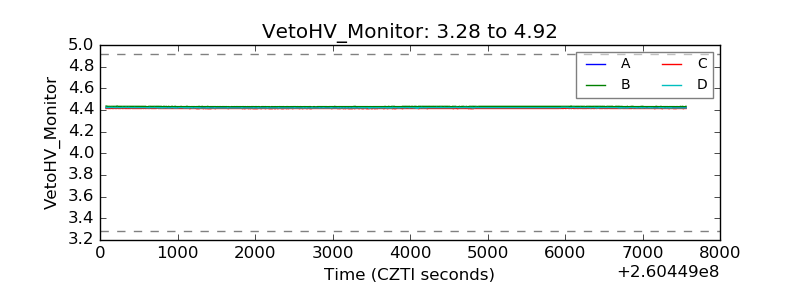 |
| Veto LLD | 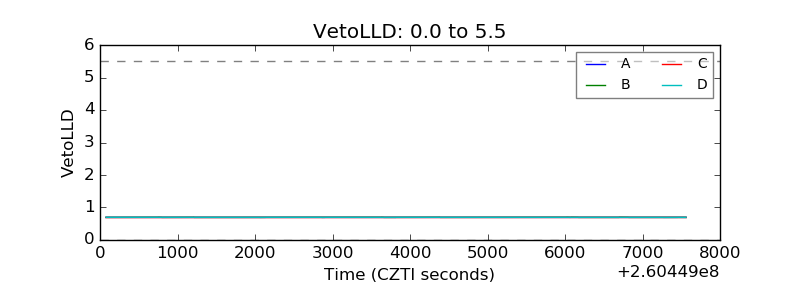 |
| Alpha Counter | 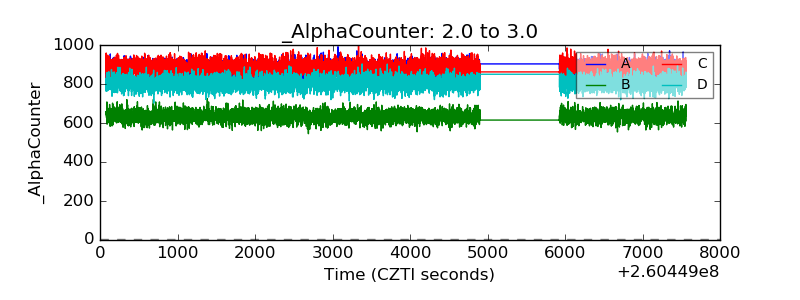 |
| _CPM_Rate | 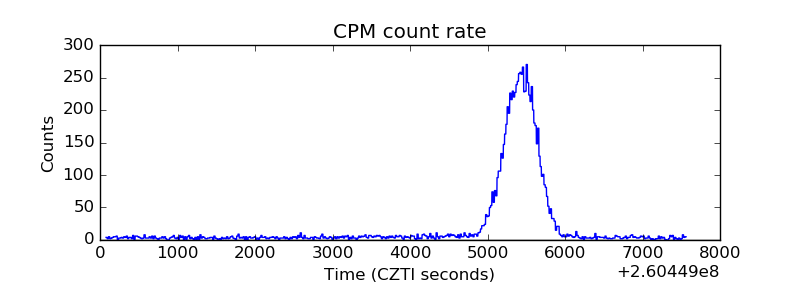 |
| CZT Counter | 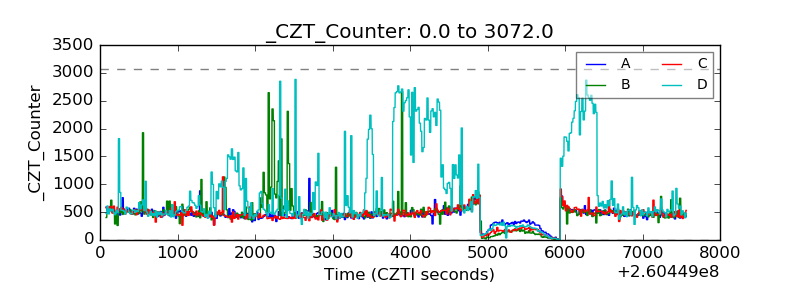 |
| +2.5 Volts monitor |  |
| +5 Volts monitor |  |
| _ROLL_ROT | 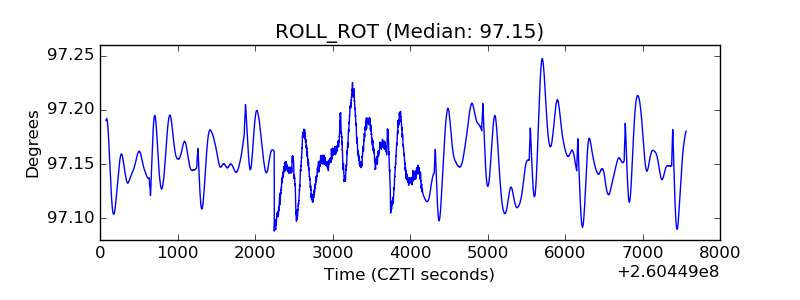 |
| _Roll_DEC | 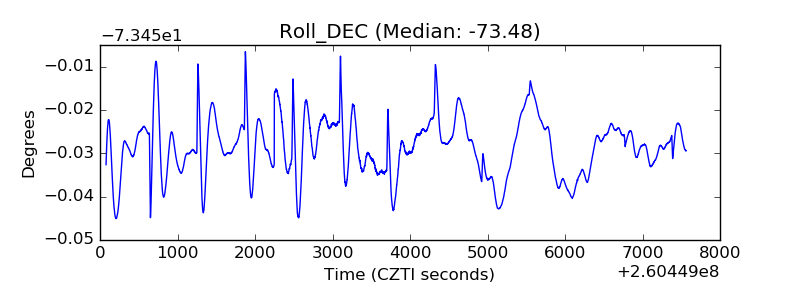 |
| _Roll_RA | 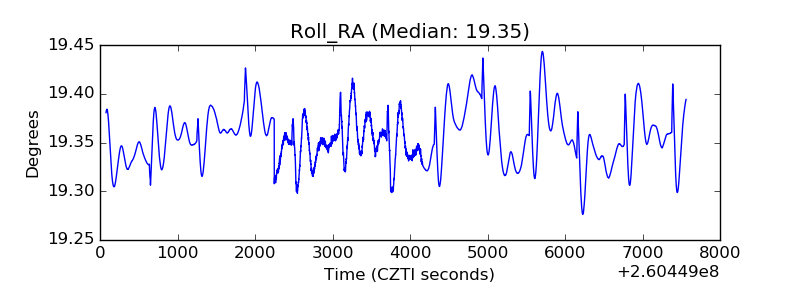 |
| Veto Counter | 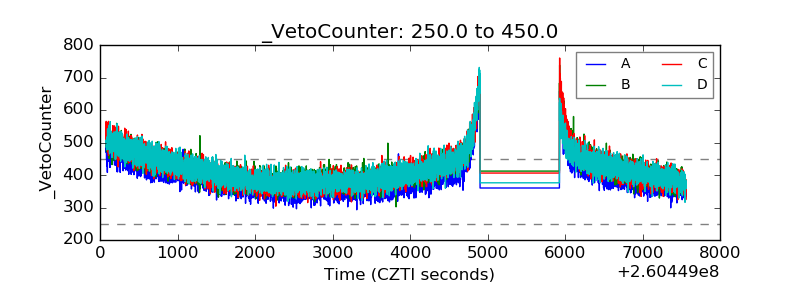 |