| Param | Original file | Final file |
|---|---|---|
| Filename | modeM0/AS1A04_193T01_9000002004_13594cztM0_level2.evt | modeM0/AS1A04_193T01_9000002004_13594cztM0_level2_quad_clean.evt |
| Size (bytes) | 504,665,280 | 117,544,320 |
| Size | 481.3 MB | 112.1 MB |
| Events in quadrant A | 2,879,858 | 795,317 |
| Events in quadrant B | 3,122,229 | 796,133 |
| Events in quadrant C | 2,946,164 | 790,367 |
| Events in quadrant D | 5,909,468 | 739,685 |
| Mode M0 | |||
|---|---|---|---|
| Quadrant | BADHDUFLAG | Total packets | Discarded packets |
| A | 0 | 12834 | 2 |
| B | 0 | 13393 | 1 |
| C | 0 | 12936 | 1 |
| D | 0 | 21857 | 1 |
| Mode SS | |||
|---|---|---|---|
| Quadrant | BADHDUFLAG | Total packets | Discarded packets |
| A | 0 | 128 | 0 |
| B | 0 | 128 | 0 |
| C | 0 | 128 | 0 |
| D | 0 | 128 | 0 |
| Mode M9 | |||
|---|---|---|---|
| Quadrant | BADHDUFLAG | Total packets | Discarded packets |
| A | 0 | 7 | 0 |
| B | 0 | 7 | 0 |
| C | 0 | 7 | 0 |
| D | 0 | 7 | 0 |
| Quadrant | Total seconds | Saturated seconds | Saturation percentage |
|---|---|---|---|
| A | 6281 | 55 | 0.875657% |
| B | 6281 | 107 | 1.703550% |
| C | 6281 | 38 | 0.604999% |
| D | 6281 | 313 | 4.983283% |
Noise dominated data is calculated using 1-second bins in cleaned event files. If a bin has >2000 counts, and if more than 50% of those come from <1% of pixels, then it is considered to be noise-dominated and hence unusable.
| Quadrant | # 1 sec bins | Bins with >0 counts | Bins with >2000 counts | High rate bins dominated by noise | Noise dominated (total time) | Noise dominated (detector-on time) | Marked lightcurve |
|---|---|---|---|---|---|---|---|
| A | 6932 | 6283 | 1 | 1 | 0.01% | 0.02% | 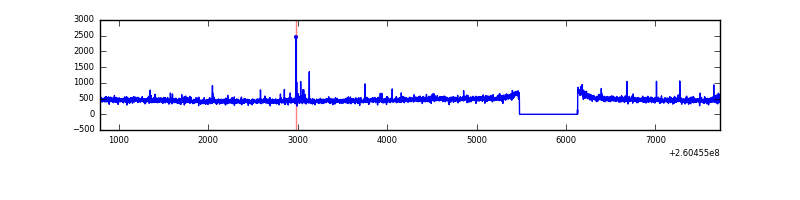 |
| B | 6932 | 6283 | 35 | 35 | 0.50% | 0.56% | 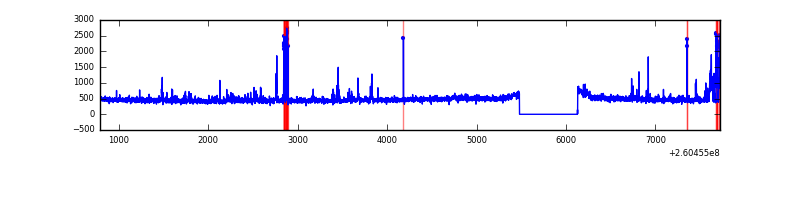 |
| C | 6932 | 6283 | 0 | 0 | 0.00% | 0.00% | 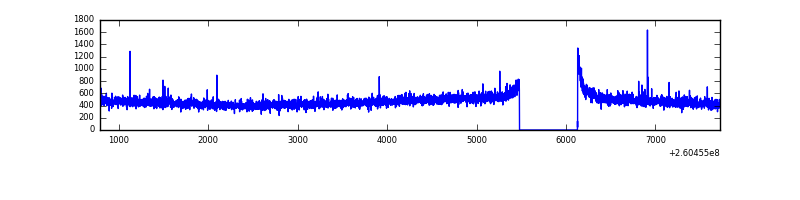 |
| D | 6932 | 6283 | 147 | 147 | 2.12% | 2.34% | 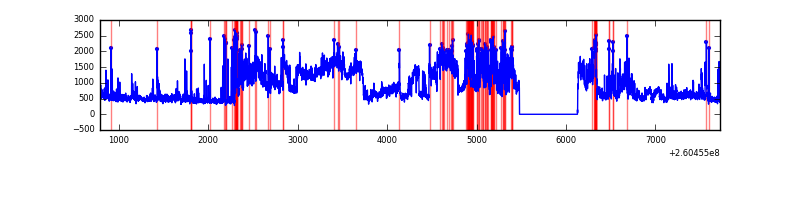 |
Top three noisy pixels from each quadrant. If the there are fewer than three noisy pixels in the level2.evt file, extra rows are filled as -1
| Pixel properties | Quadrant properties | ||||||
|---|---|---|---|---|---|---|---|
| Quadrant | DetID | PixID | Counts | Sigma | Mean | Median | Sigma |
| A | 2 | 250 | 19495 | 126.42 | 731 | 713 | 148.6 |
| A | 1 | 162 | 18306 | 118.42 | 731 | 713 | 148.6 |
| A | 15 | 69 | 15634 | 100.43 | 731 | 713 | 148.6 |
| B | 0 | 182 | 106321 | 773.02 | 726 | 708 | 136.6 |
| B | 0 | 85 | 50767 | 366.4 | 726 | 708 | 136.6 |
| B | 3 | 64 | 41845 | 301.1 | 726 | 708 | 136.6 |
| C | 3 | 233 | 169557 | 1046.74 | 704 | 707 | 161.3 |
| C | 0 | 207 | 19268 | 115.06 | 704 | 707 | 161.3 |
| C | 8 | 229 | 6609 | 36.58 | 704 | 707 | 161.3 |
| D | 13 | 122 | 2272767 | 13484.26 | 699 | 679 | 168.5 |
| D | 5 | 222 | 474059 | 2809.39 | 699 | 679 | 168.5 |
| D | 1 | 20 | 168933 | 998.54 | 699 | 679 | 168.5 |
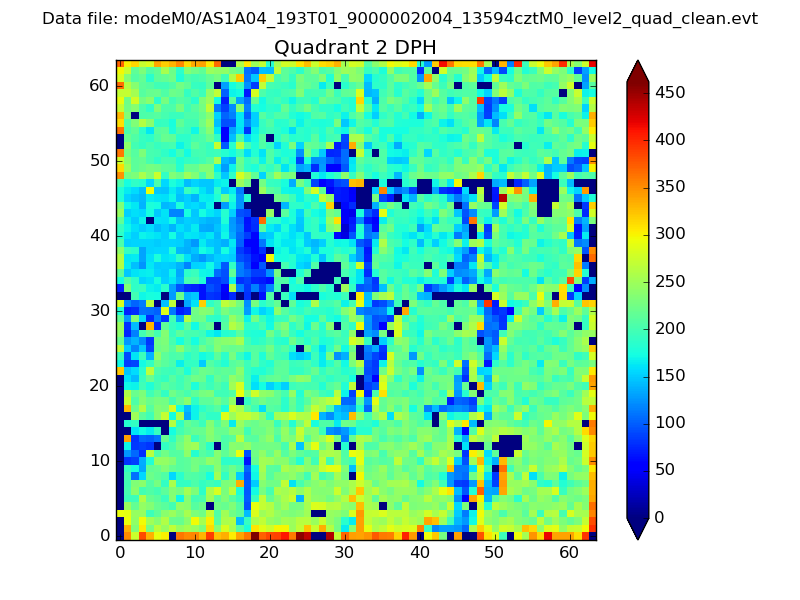
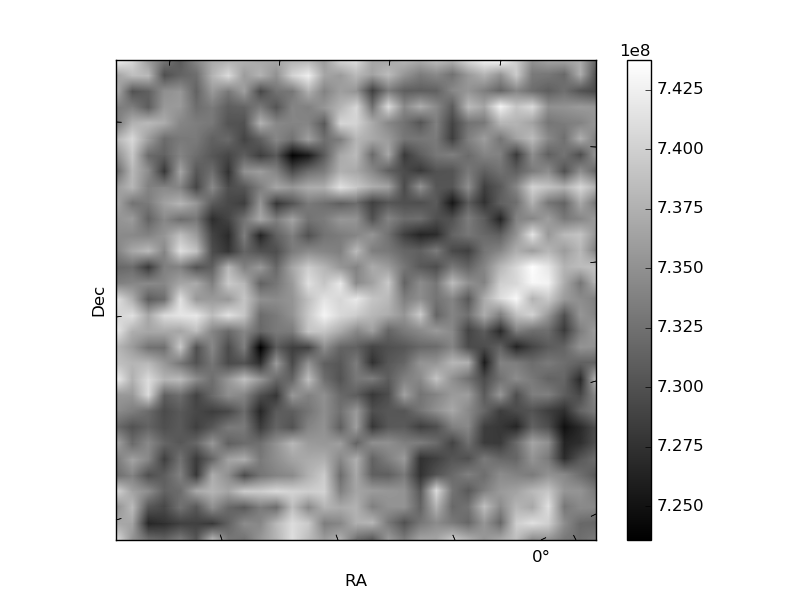
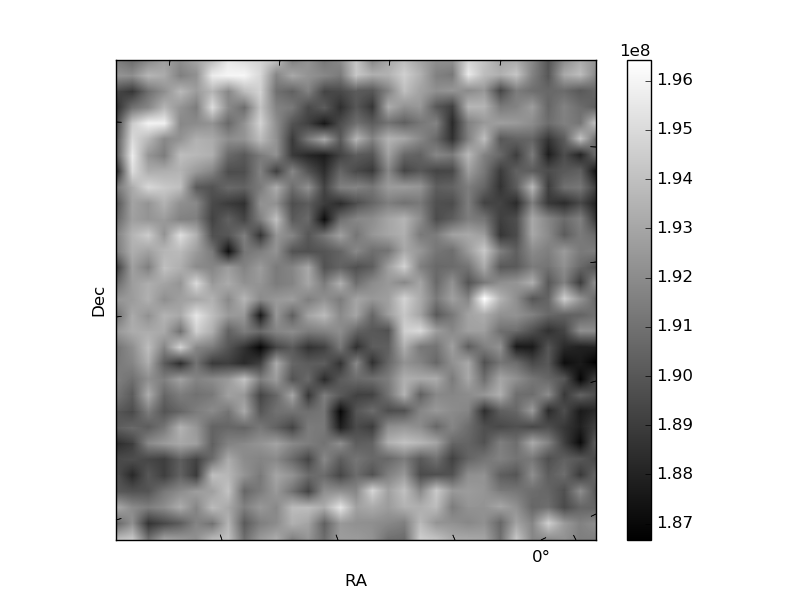
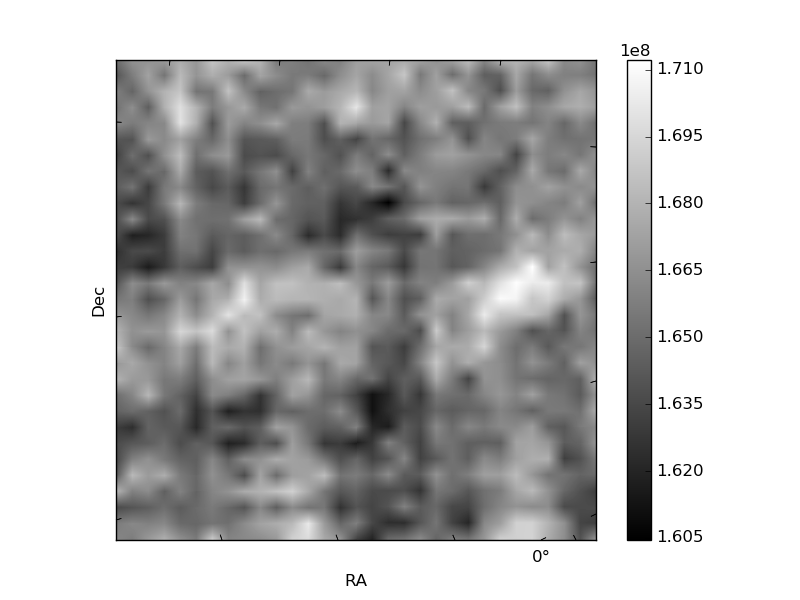
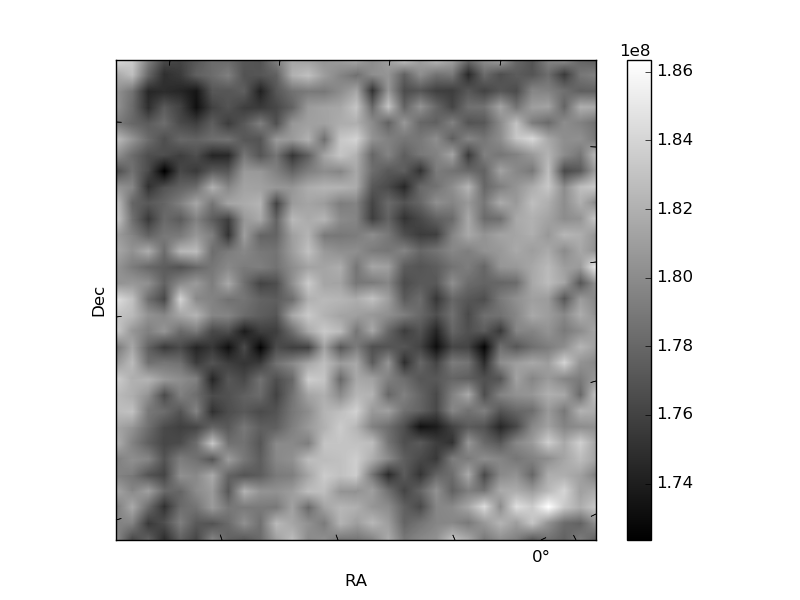
Histogram calculated using DETX and DETY for each event in the final _common_clean file
| Quadrant A | 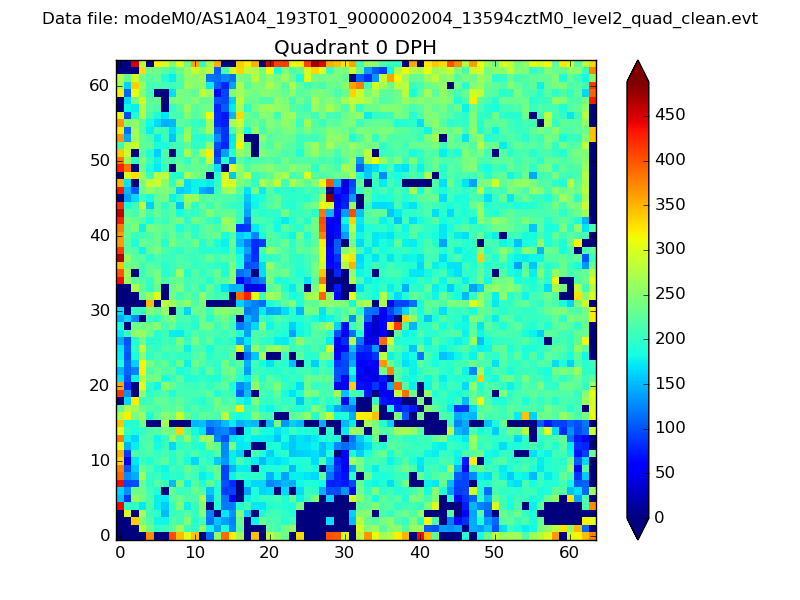 |
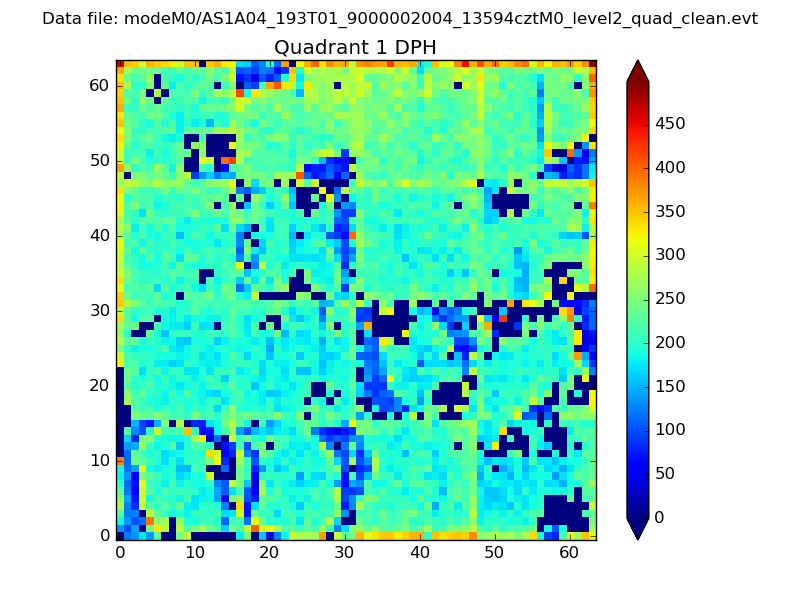 |
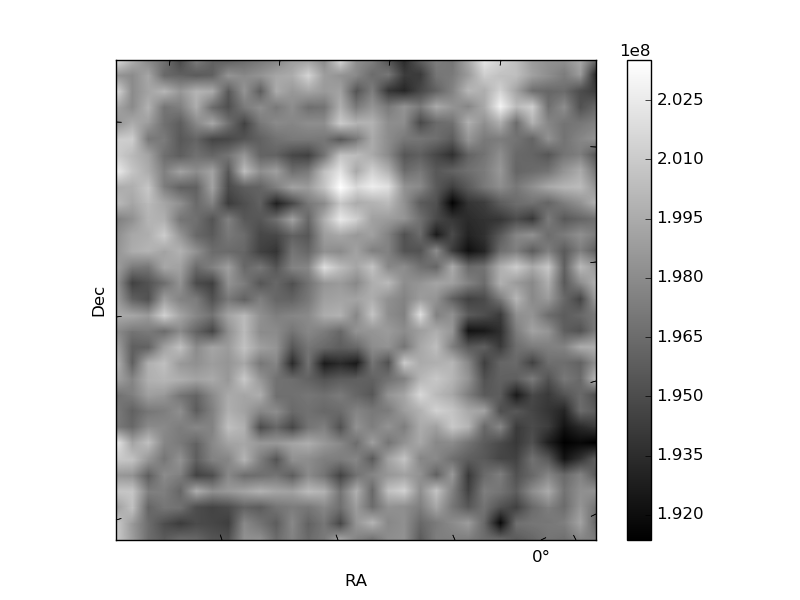
Quadrant B |
|---|---|---|---|
| Quadrant D | 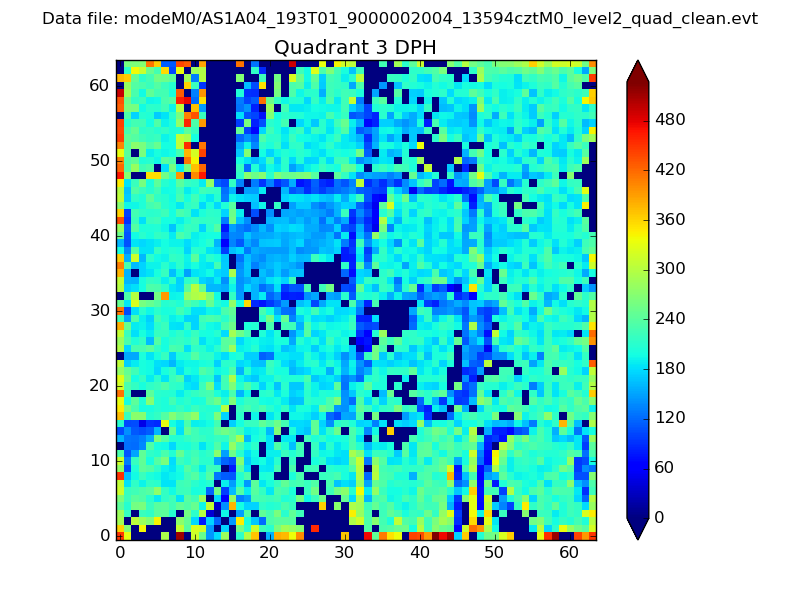 |
 |
Quadrant C |
| Plot type | Count rate plots | Images |
|---|---|---|
| Comparison with Poisson distribution Blue bars denote a histogram of data divided into 1 sec bins. Red curve is a Poisson curve with rate = median count rate of data. |
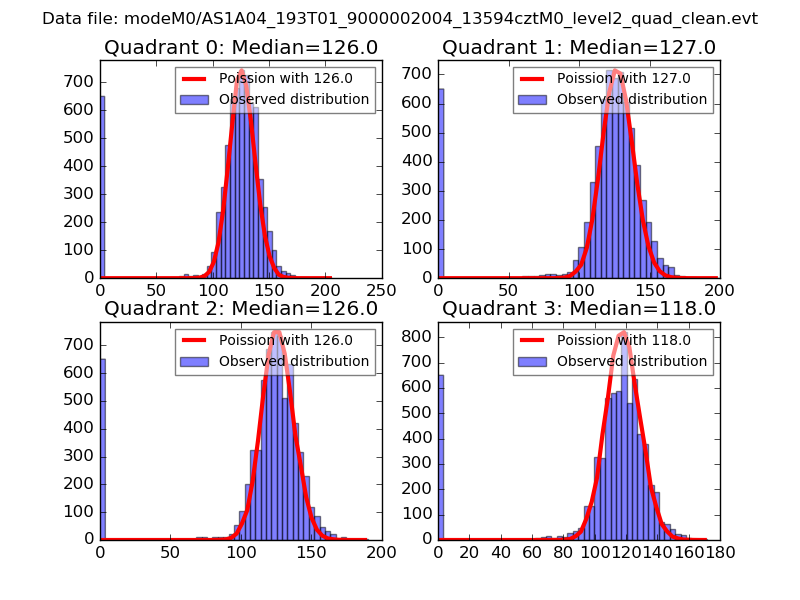 |
 |
| Quadrant-wise count rates Data is divided into 100 sec bins |
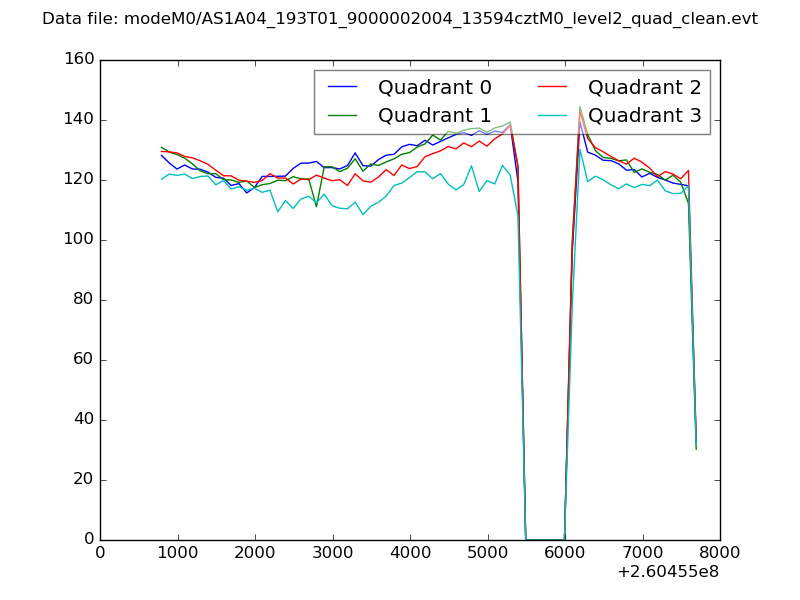 |
|
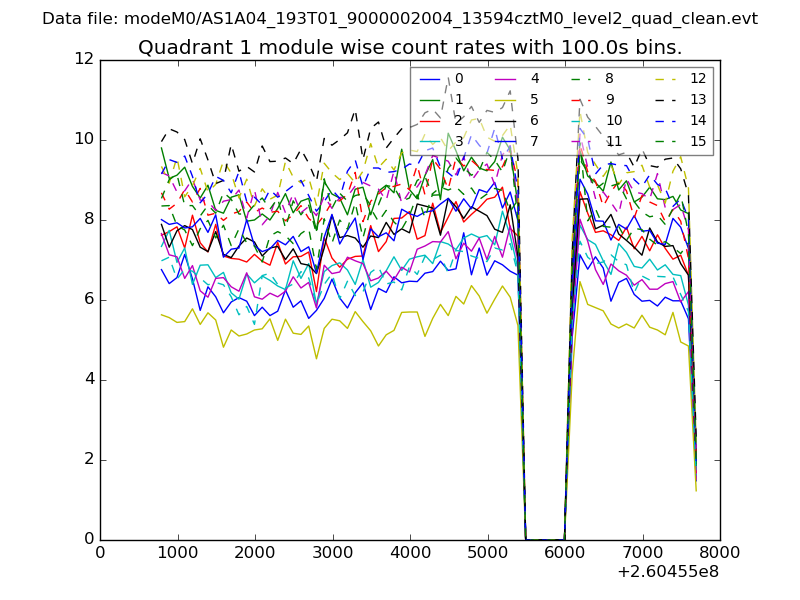
| Module-wise count rates for Quadrant A Data is divided into 100 sec bins |
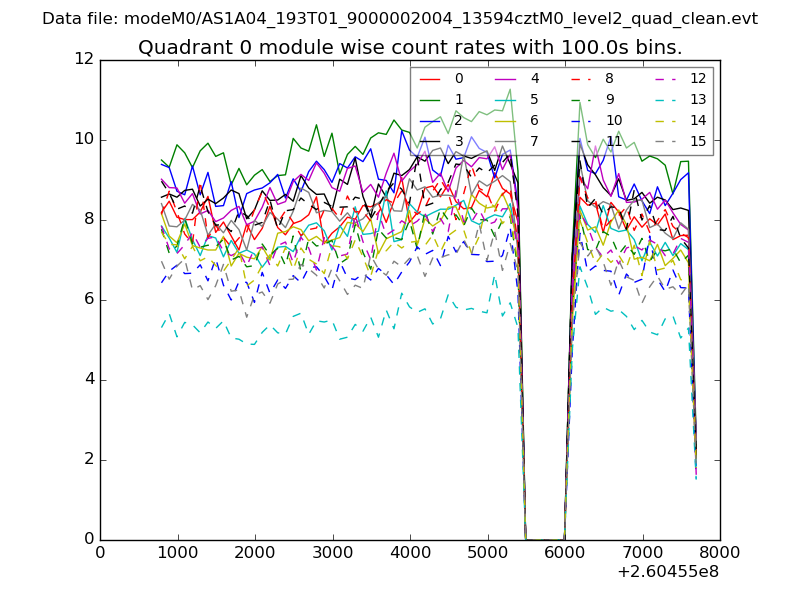 |
 |
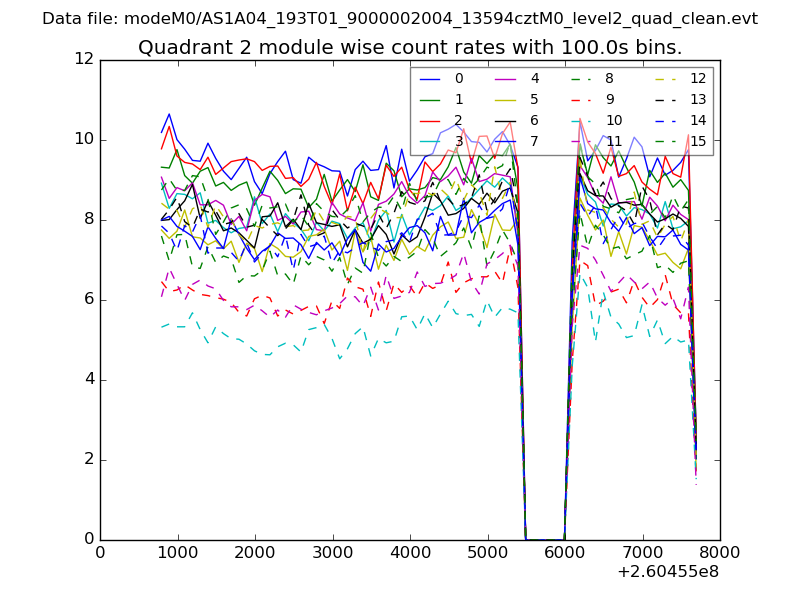
| Module-wise count rates for Quadrant B Data is divided into 100 sec bins |
 |
 |
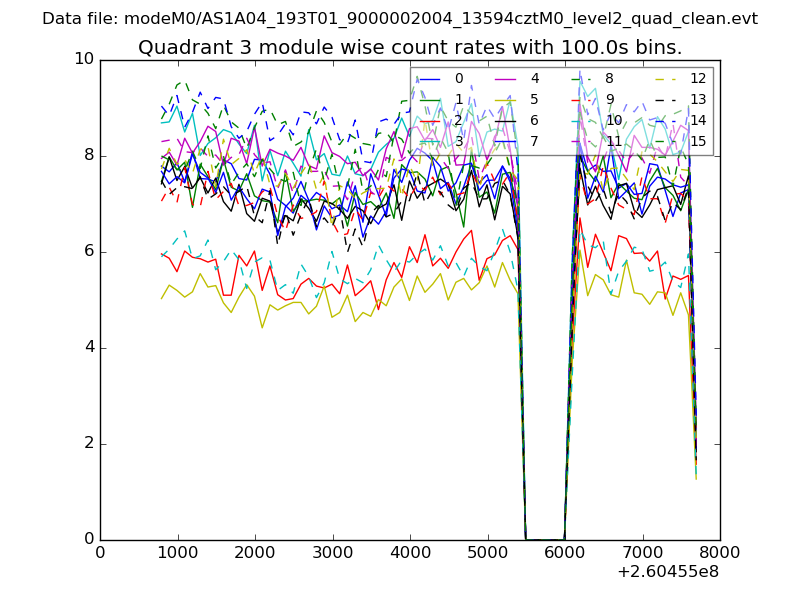
| Module-wise count rates for Quadrant C Data is divided into 100 sec bins |
 |
 |
| Module-wise count rates for Quadrant D Data is divided into 100 sec bins |
 |
 |
| Parameter | Plot |
|---|---|
| CZT HV Monitor | 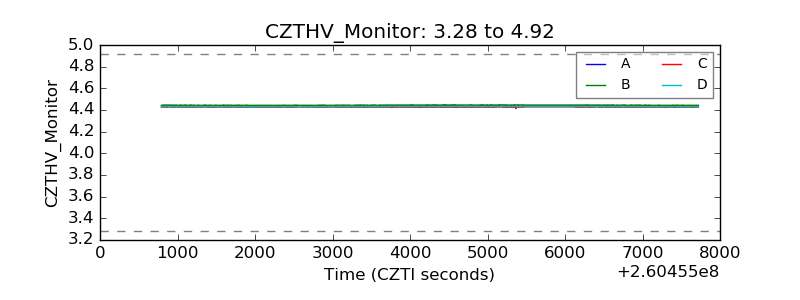 |
| D_VDD | 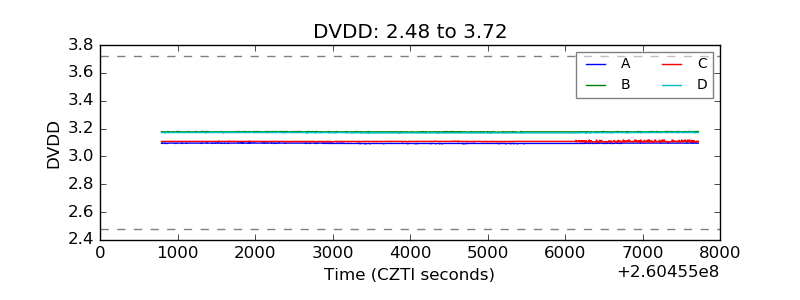 |
| Temperature 1 | 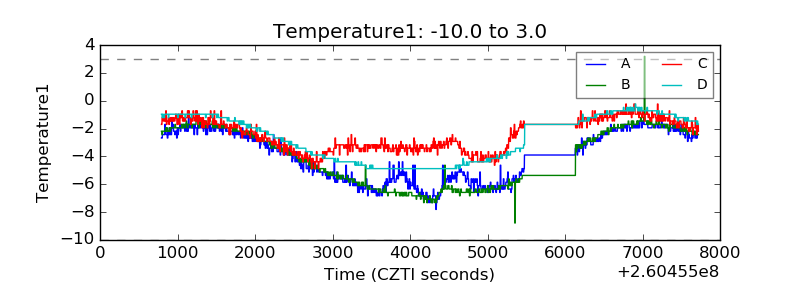 |
| Veto HV Monitor | 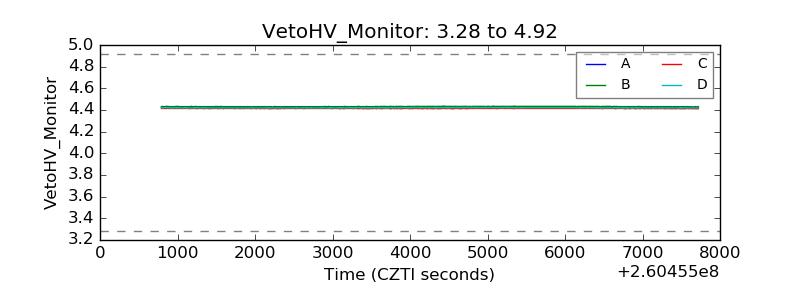 |
| Veto LLD | 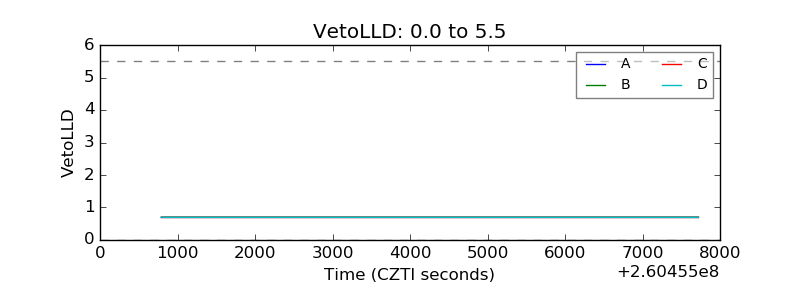 |
| Alpha Counter | 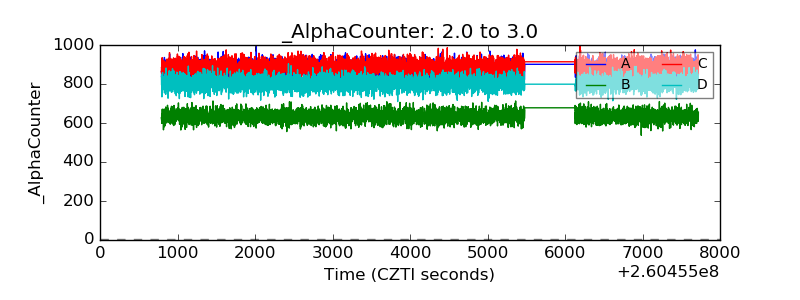 |
| _CPM_Rate | 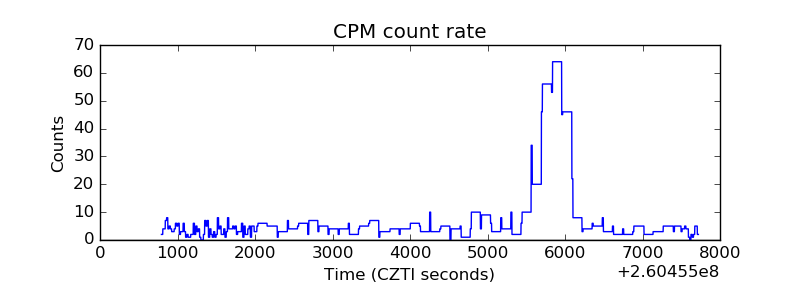 |
| CZT Counter | 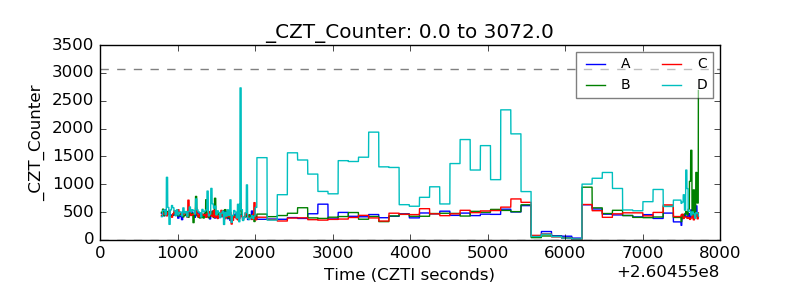 |
| +2.5 Volts monitor |  |
| +5 Volts monitor |  |
| _ROLL_ROT | 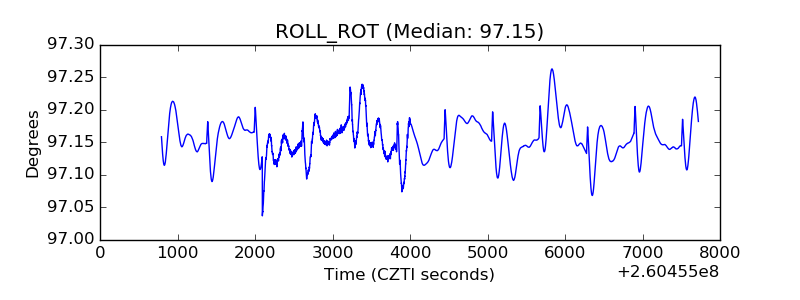 |
| _Roll_DEC | 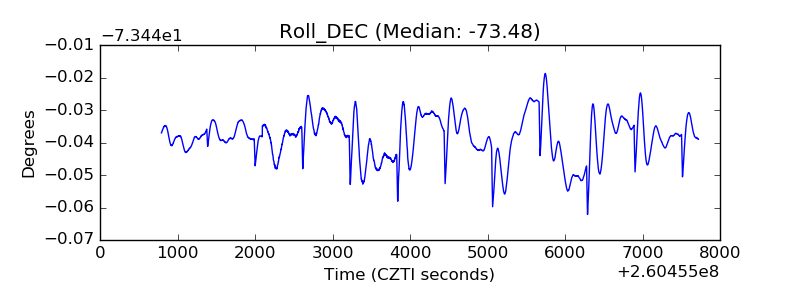 |
| _Roll_RA | 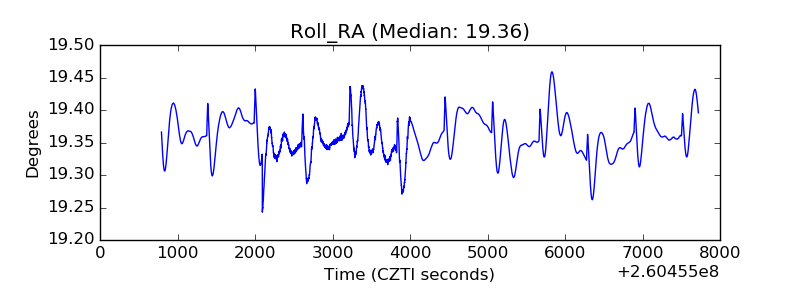 |
| Veto Counter | 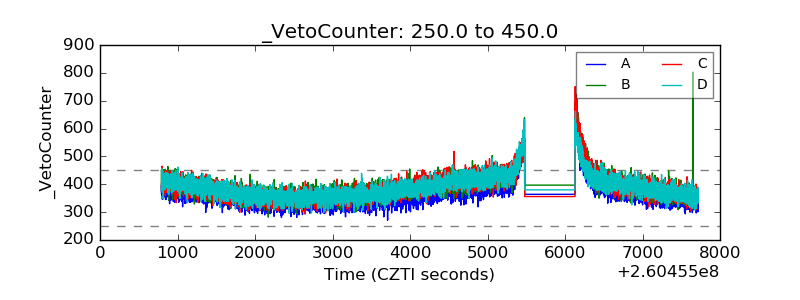 |