| Param | Original file | Final file |
|---|---|---|
| Filename | modeM0/AS1A04_193T01_9000002004_13596cztM0_level2.evt | modeM0/AS1A04_193T01_9000002004_13596cztM0_level2_quad_clean.evt |
| Size (bytes) | 331,672,320 | 89,844,480 |
| Size | 316.3 MB | 85.7 MB |
| Events in quadrant A | 2,181,894 | 607,411 |
| Events in quadrant B | 2,881,268 | 595,933 |
| Events in quadrant C | 2,187,976 | 595,290 |
| Events in quadrant D | 2,456,537 | 575,533 |
| Mode M0 | |||
|---|---|---|---|
| Quadrant | BADHDUFLAG | Total packets | Discarded packets |
| A | 0 | 9958 | 0 |
| B | 0 | 11859 | 0 |
| C | 0 | 9947 | 0 |
| D | 0 | 10746 | 0 |
| Mode SS | |||
|---|---|---|---|
| Quadrant | BADHDUFLAG | Total packets | Discarded packets |
| A | 0 | 98 | 0 |
| B | 0 | 98 | 0 |
| C | 0 | 98 | 0 |
| D | 0 | 98 | 0 |
| Quadrant | Total seconds | Saturated seconds | Saturation percentage |
|---|---|---|---|
| A | 4945 | 3 | 0.060667% |
| B | 4945 | 150 | 3.033367% |
| C | 4945 | 5 | 0.101112% |
| D | 4945 | 12 | 0.242669% |
Noise dominated data is calculated using 1-second bins in cleaned event files. If a bin has >2000 counts, and if more than 50% of those come from <1% of pixels, then it is considered to be noise-dominated and hence unusable.
| Quadrant | # 1 sec bins | Bins with >0 counts | Bins with >2000 counts | High rate bins dominated by noise | Noise dominated (total time) | Noise dominated (detector-on time) | Marked lightcurve |
|---|---|---|---|---|---|---|---|
| A | 4946 | 4946 | 1 | 1 | 0.02% | 0.02% | 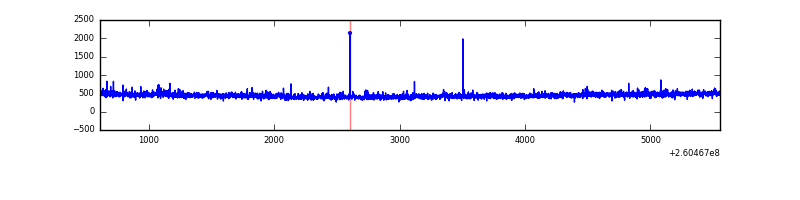 |
| B | 4946 | 4946 | 138 | 138 | 2.79% | 2.79% | 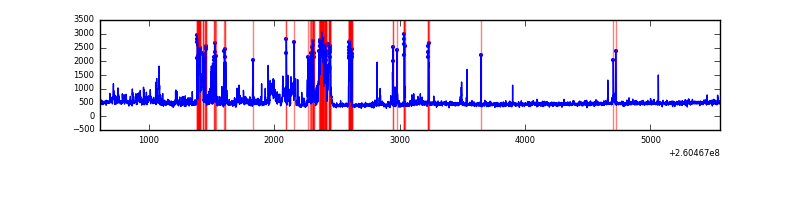 |
| C | 4946 | 4946 | 2 | 2 | 0.04% | 0.04% |  |
| D | 4946 | 4946 | 21 | 21 | 0.42% | 0.42% | 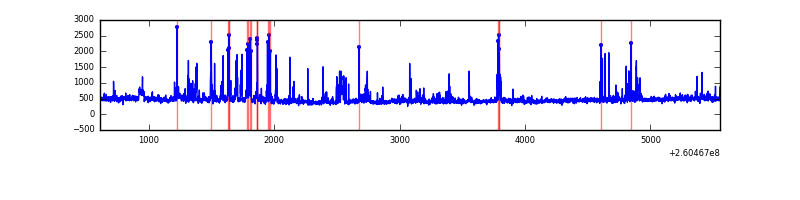 |
Top three noisy pixels from each quadrant. If the there are fewer than three noisy pixels in the level2.evt file, extra rows are filled as -1
| Pixel properties | Quadrant properties | ||||||
|---|---|---|---|---|---|---|---|
| Quadrant | DetID | PixID | Counts | Sigma | Mean | Median | Sigma |
| A | 1 | 162 | 28261 | 243.78 | 552 | 540 | 113.7 |
| A | 1 | 178 | 8351 | 68.69 | 552 | 540 | 113.7 |
| A | 1 | 161 | 7533 | 61.5 | 552 | 540 | 113.7 |
| B | 0 | 182 | 445670 | 4324.85 | 546 | 532 | 102.9 |
| B | 3 | 64 | 66167 | 637.69 | 546 | 532 | 102.9 |
| B | 0 | 189 | 65939 | 635.48 | 546 | 532 | 102.9 |
| C | 3 | 233 | 88602 | 708.25 | 534 | 537 | 124.3 |
| C | 14 | 234 | 7723 | 57.79 | 534 | 537 | 124.3 |
| C | 0 | 207 | 7583 | 56.67 | 534 | 537 | 124.3 |
| D | 5 | 222 | 123823 | 946.16 | 533 | 518 | 130.3 |
| D | 10 | 157 | 118246 | 903.36 | 533 | 518 | 130.3 |
| D | 8 | 195 | 74418 | 567.06 | 533 | 518 | 130.3 |
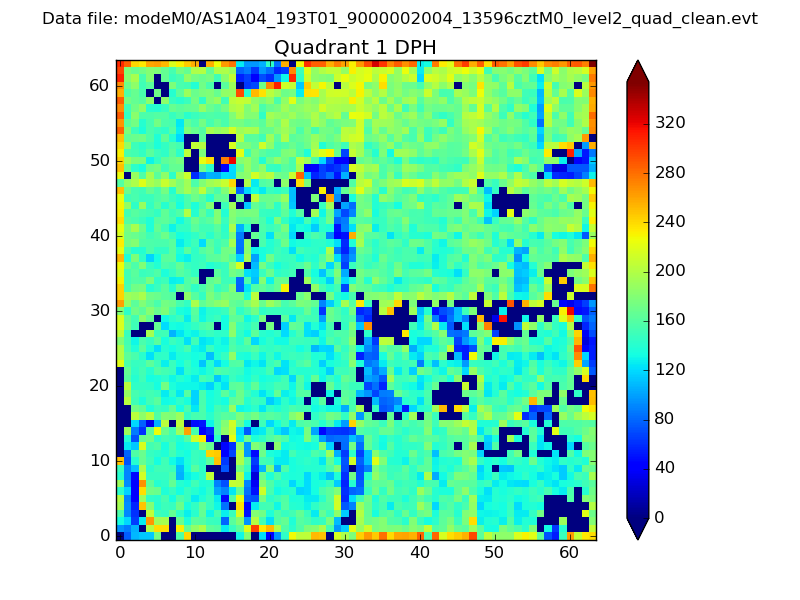
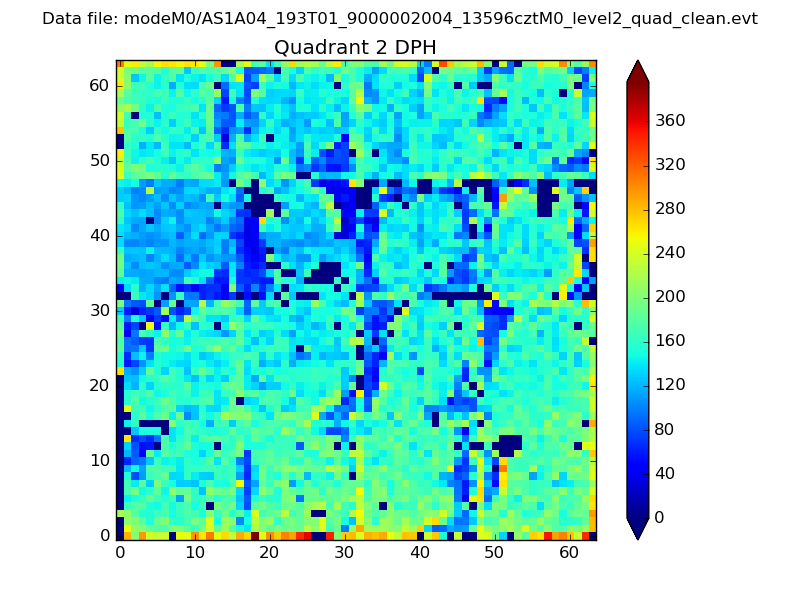
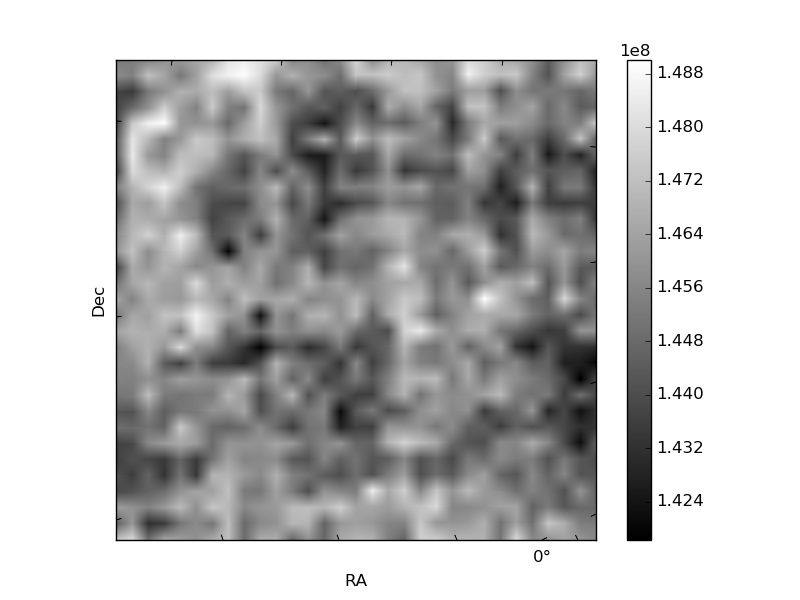
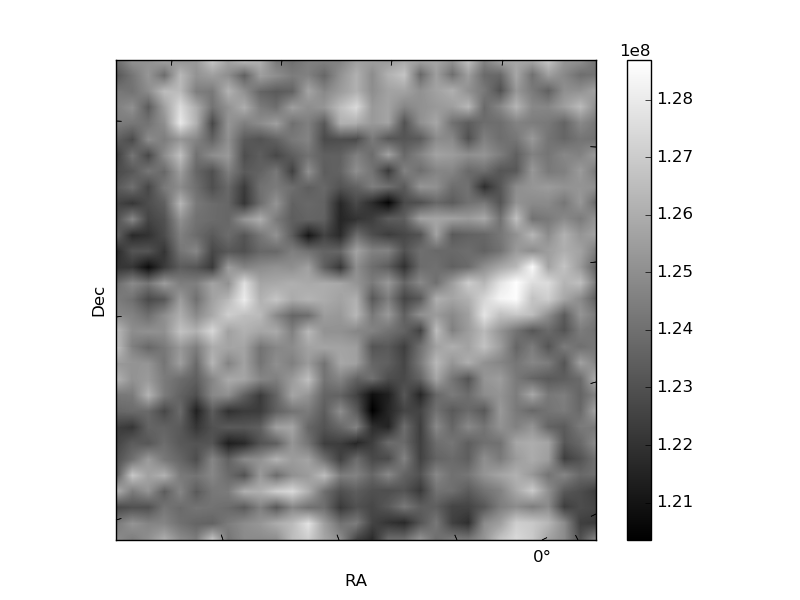
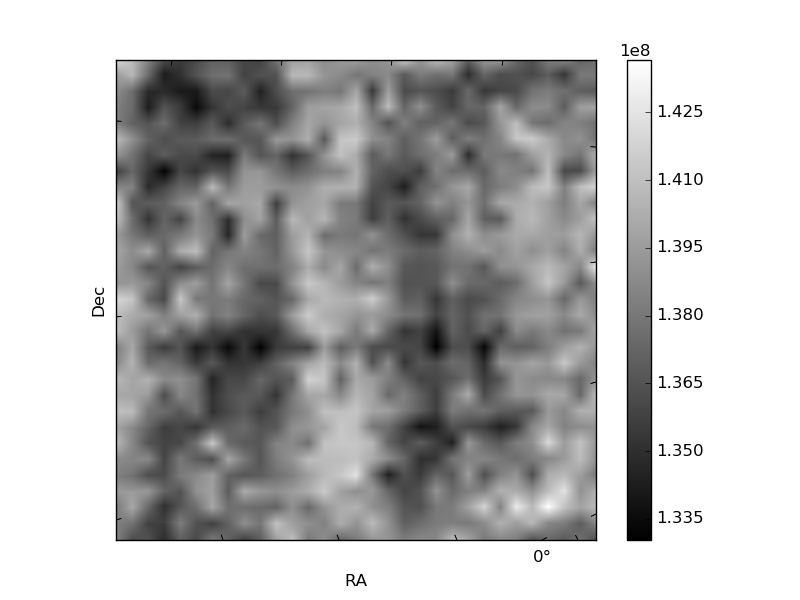
Histogram calculated using DETX and DETY for each event in the final _common_clean file
| Quadrant A | 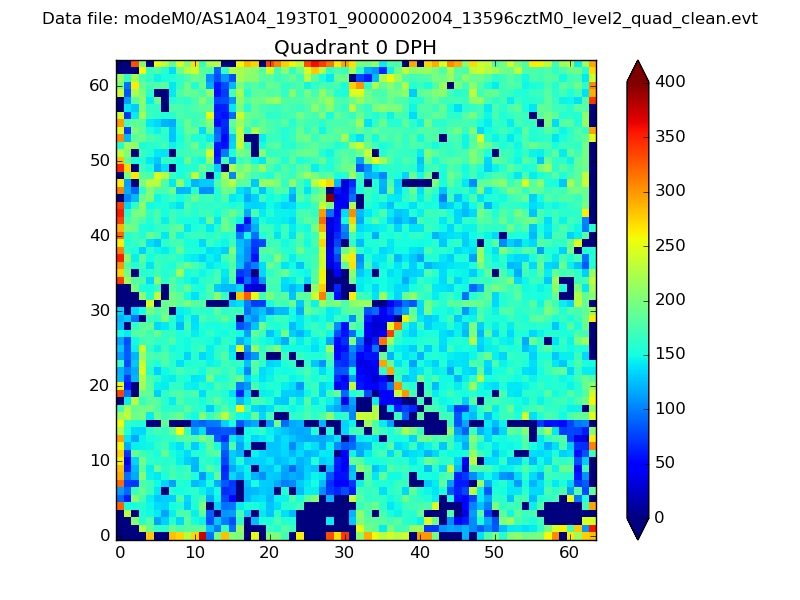 |
 |
Quadrant B |
|---|---|---|---|
| Quadrant D | 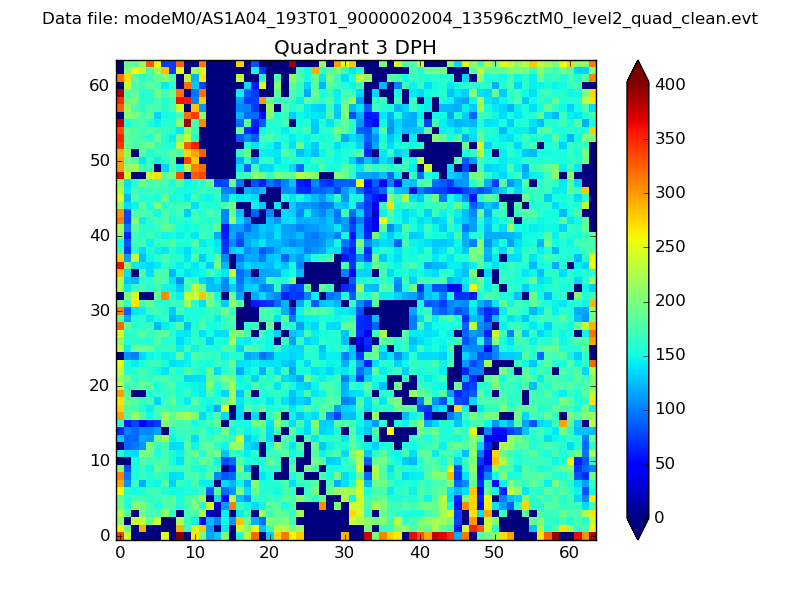 |
 |
Quadrant C |
| Plot type | Count rate plots | Images |
|---|---|---|
| Comparison with Poisson distribution Blue bars denote a histogram of data divided into 1 sec bins. Red curve is a Poisson curve with rate = median count rate of data. |
 |
 |
| Quadrant-wise count rates Data is divided into 100 sec bins |
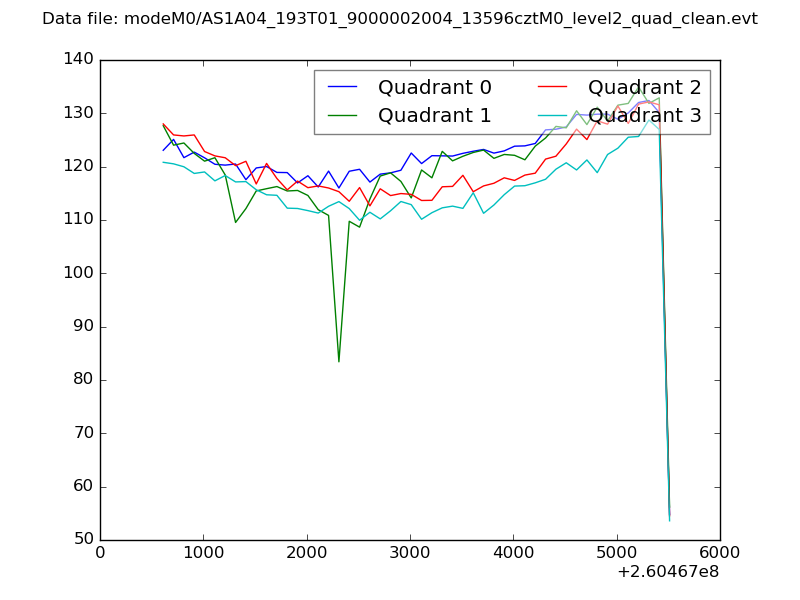 |
|
| Module-wise count rates for Quadrant A Data is divided into 100 sec bins |
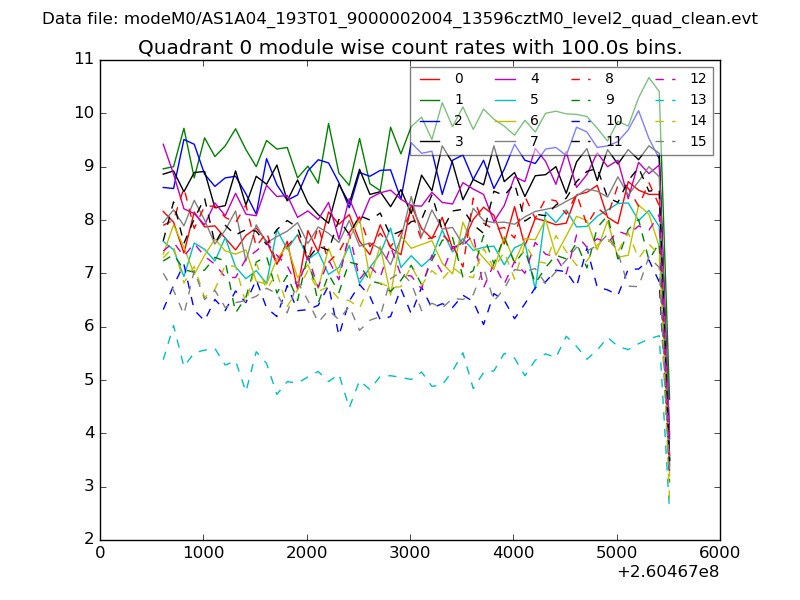 |
 |
| Module-wise count rates for Quadrant B Data is divided into 100 sec bins |
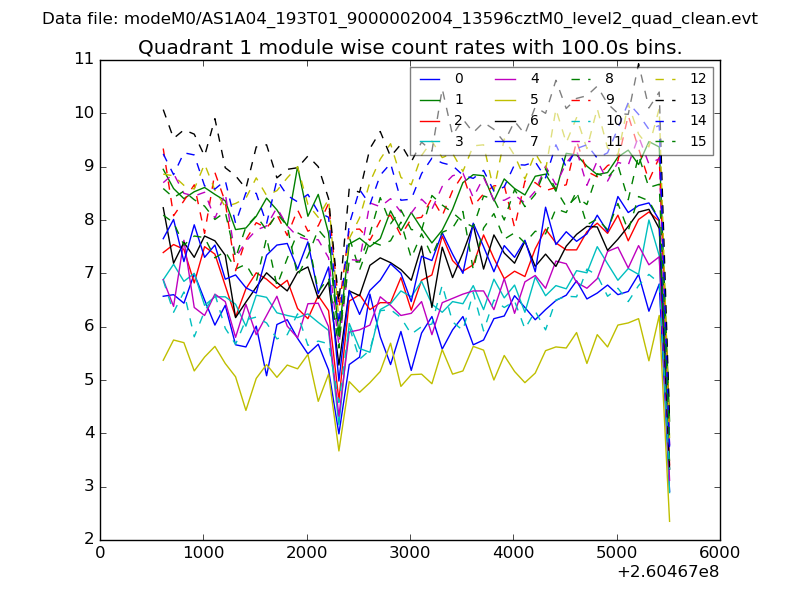 |
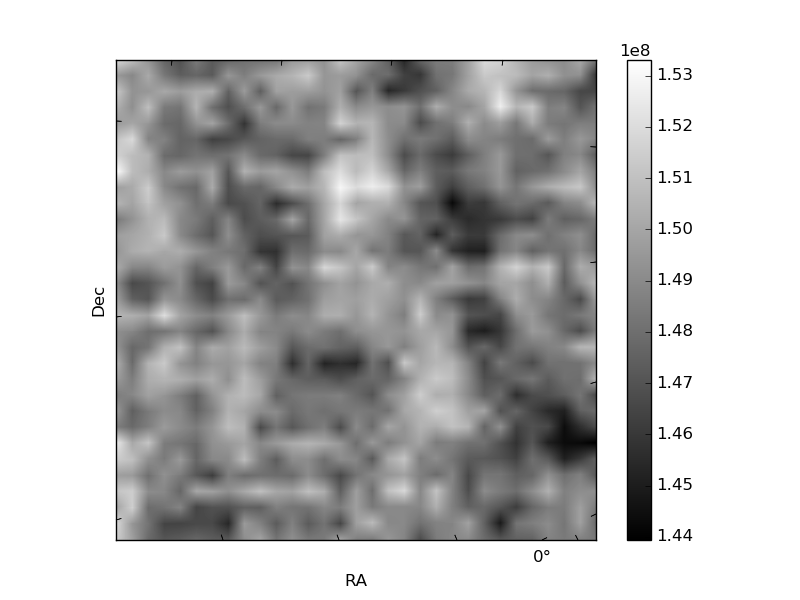 |
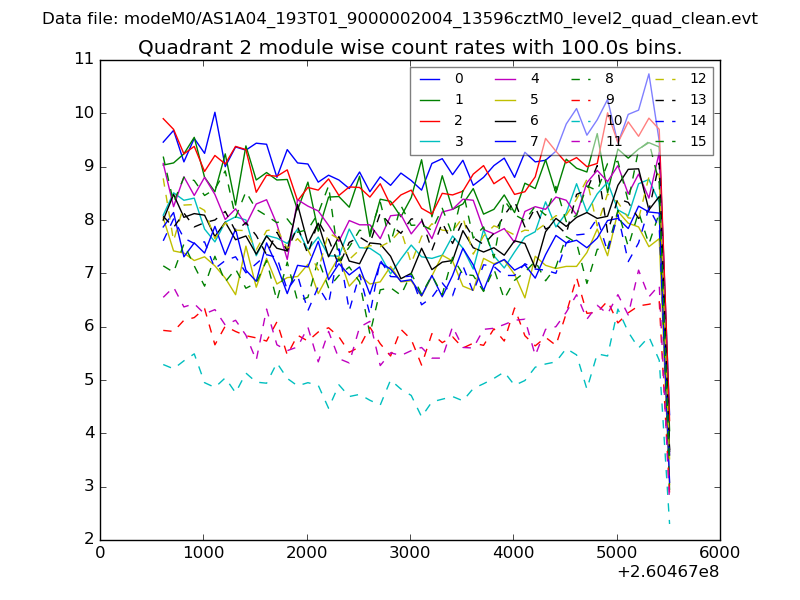
| Module-wise count rates for Quadrant C Data is divided into 100 sec bins |
 |
 |
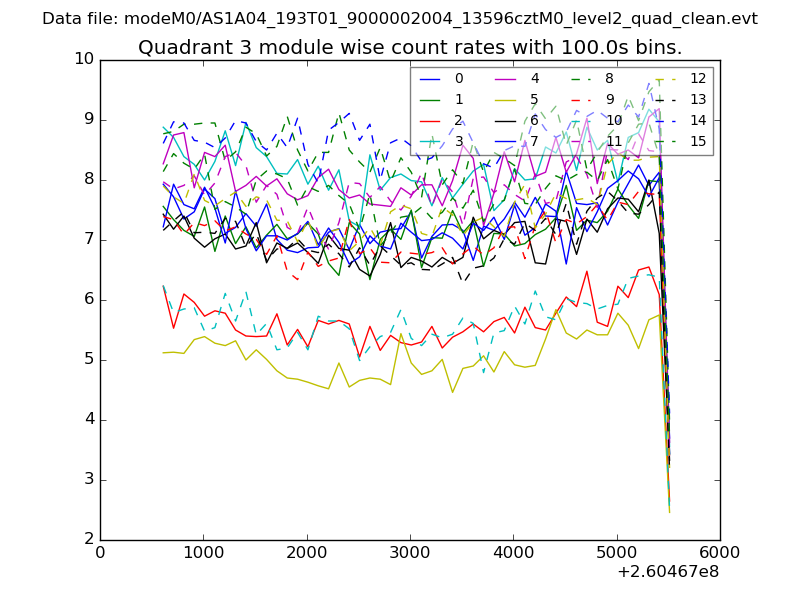
| Module-wise count rates for Quadrant D Data is divided into 100 sec bins |
 |
 |
| Parameter | Plot |
|---|---|
| CZT HV Monitor | 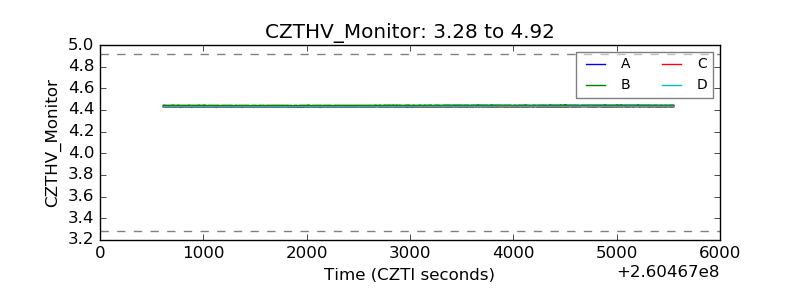 |
| D_VDD | 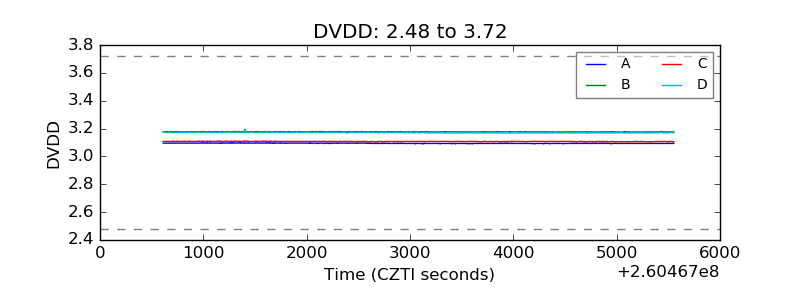 |
| Temperature 1 | 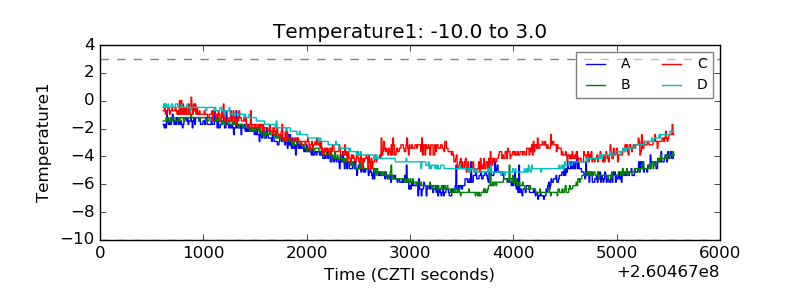 |
| Veto HV Monitor | 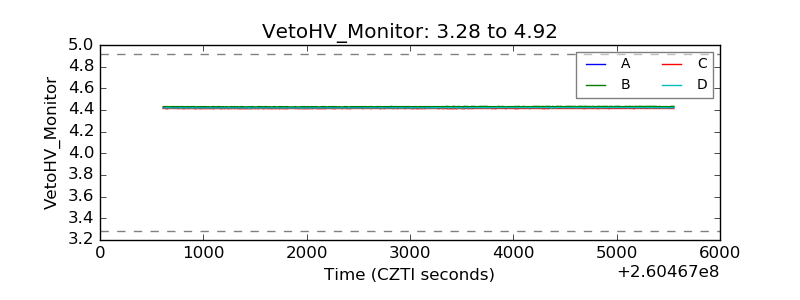 |
| Veto LLD | 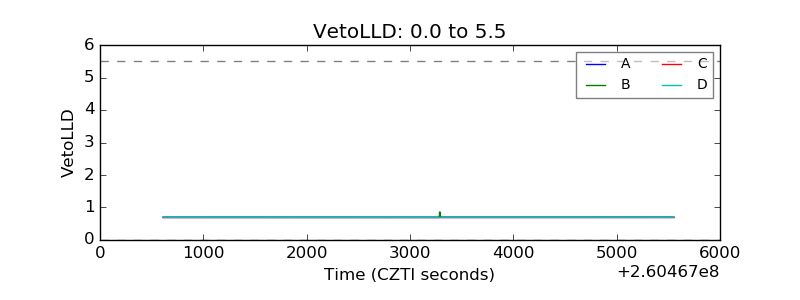 |
| Alpha Counter | 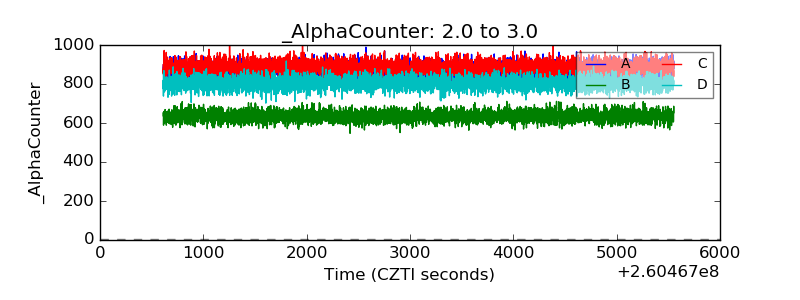 |
| _CPM_Rate | 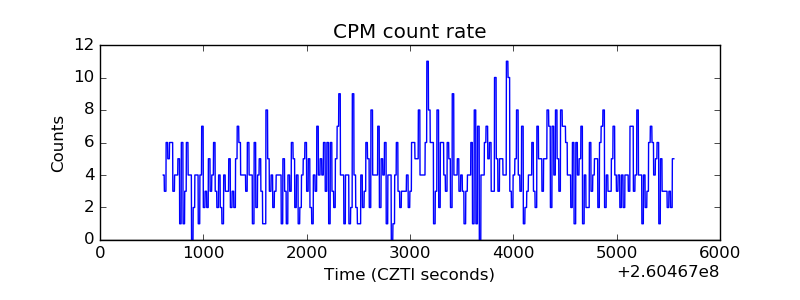 |
| CZT Counter | 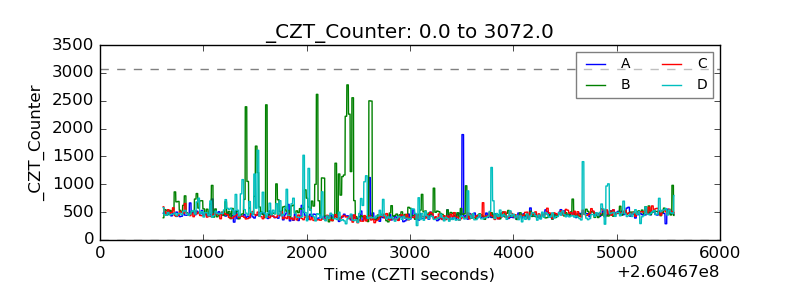 |
| +2.5 Volts monitor |  |
| +5 Volts monitor |  |
| _ROLL_ROT |  |
| _Roll_DEC | 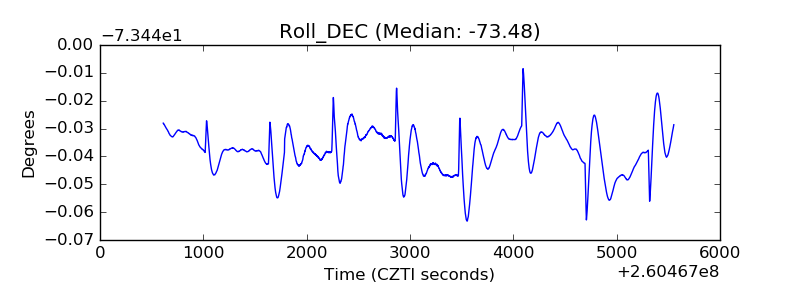 |
| _Roll_RA | 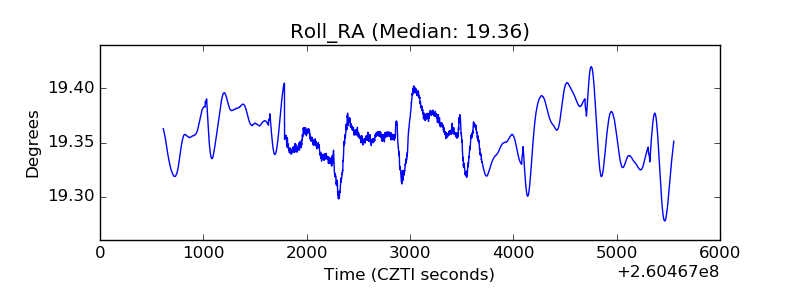 |
| Veto Counter | 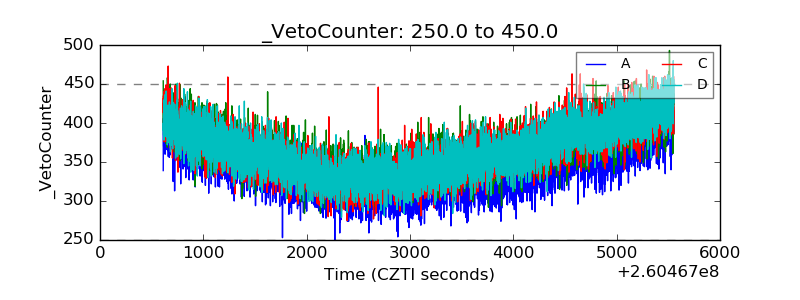 |