| Param | Original file | Final file |
|---|---|---|
| Filename | modeM0/AS1G08_028T01_9000002006cztM0_level2.fits | modeM0/AS1G08_028T01_9000002006cztM0_level2_quad_clean.evt |
| Size (bytes) | 256,976,640 | 281,908,800 |
| Size | 245.1 MB | 268.8 MB |
| Events in quadrant A | 1,584,302 | 1,784,738 |
| Events in quadrant B | 1,493,356 | 1,742,063 |
| Events in quadrant C | 1,548,634 | 1,703,241 |
| Events in quadrant D | 1,227,058 | 1,380,404 |
| Mode M9 | |||
|---|---|---|---|
| Quadrant | BADHDUFLAG | Total packets | Discarded packets |
| A | 0 | 38 | 0 |
| B | 0 | 38 | 0 |
| C | 0 | 38 | 0 |
| D | 0 | 38 | 0 |
| Mode SS | |||
|---|---|---|---|
| Quadrant | BADHDUFLAG | Total packets | Discarded packets |
| A | 0 | 570 | 0 |
| B | 0 | 570 | 0 |
| C | 0 | 570 | 0 |
| D | 0 | 570 | 0 |
| Mode M0 | |||
|---|---|---|---|
| Quadrant | BADHDUFLAG | Total packets | Discarded packets |
| A | 0 | 57854 | 0 |
| B | 0 | 67719 | 0 |
| C | 0 | 58235 | 0 |
| D | 0 | 105629 | 0 |
| Quadrant | Total seconds | Saturated seconds | Saturation percentage |
|---|---|---|---|
| A | 28028 | 151 | 0.538747% |
| B | 28028 | 813 | 2.900671% |
| C | 28028 | 147 | 0.524476% |
| D | 28028 | 4900 | 17.482517% |
Noise dominated data is calculated using 1-second bins in cleaned event files. If a bin has >2000 counts, and if more than 50% of those come from <1% of pixels, then it is considered to be noise-dominated and hence unusable.
| Quadrant | # 1 sec bins | Bins with >0 counts | Bins with >2000 counts | High rate bins dominated by noise | Noise dominated (total time) | Noise dominated (detector-on time) | Marked lightcurve |
|---|---|---|---|---|---|---|---|
| A | 31798 | 28026 | 0 | 0 | 0.00% | 0.00% |  |
| B | 31798 | 28026 | 0 | 0 | 0.00% | 0.00% | 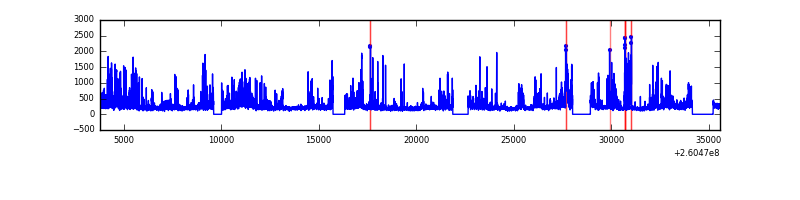 |
| C | 31798 | 28026 | 0 | 0 | 0.00% | 0.00% | 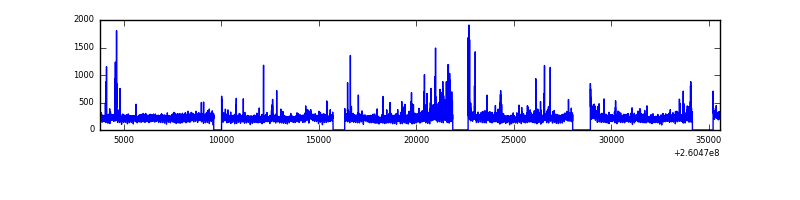 |
| D | 31798 | 27992 | 0 | 0 | 0.00% | 0.00% |  |
Top three noisy pixels from each quadrant. If the there are fewer than three noisy pixels in the level2.evt file, extra rows are filled as -1
| Pixel properties | Quadrant properties | ||||||
|---|---|---|---|---|---|---|---|
| Quadrant | DetID | PixID | Counts | Sigma | Mean | Median | Sigma |
| A | 14 | 188 | 1639 | 11.79 | 411 | 384 | 106.5 |
| A | 0 | 29 | 1591 | 11.34 | 411 | 384 | 106.5 |
| A | 14 | 204 | 1393 | 9.48 | 411 | 384 | 106.5 |
| B | 2 | 9 | 1335 | 11.76 | 394 | 374 | 81.7 |
| B | 2 | 8 | 1018 | 7.88 | 394 | 374 | 81.7 |
| B | 3 | 17 | 1013 | 7.82 | 394 | 374 | 81.7 |
| C | 1 | 81 | 1202 | 7.59 | 409 | 380 | 108.4 |
| C | 1 | 80 | 1198 | 7.55 | 409 | 380 | 108.4 |
| C | 12 | 241 | 1070 | 6.37 | 409 | 380 | 108.4 |
| D | 3 | 14 | 913 | 6.24 | 349 | 318 | 95.3 |
| D | 6 | 231 | 885 | 5.95 | 349 | 318 | 95.3 |
| D | 6 | 38 | 864 | 5.73 | 349 | 318 | 95.3 |
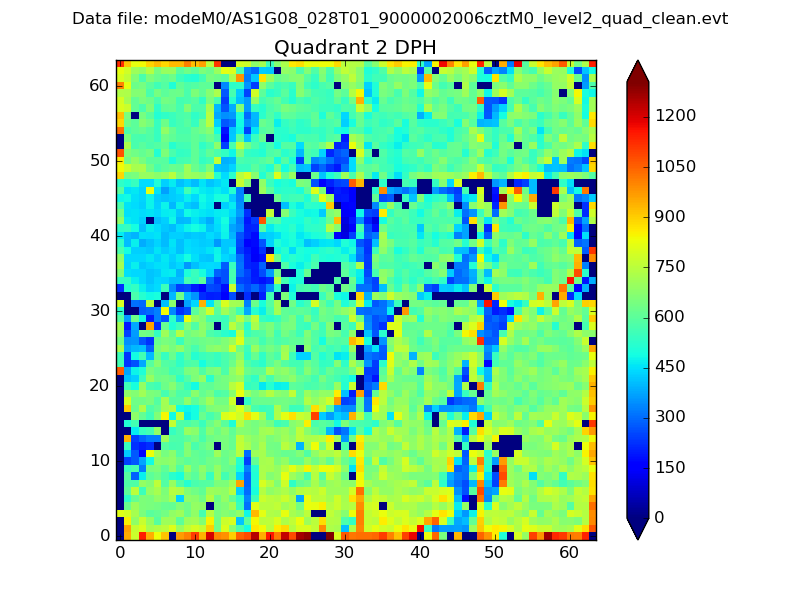
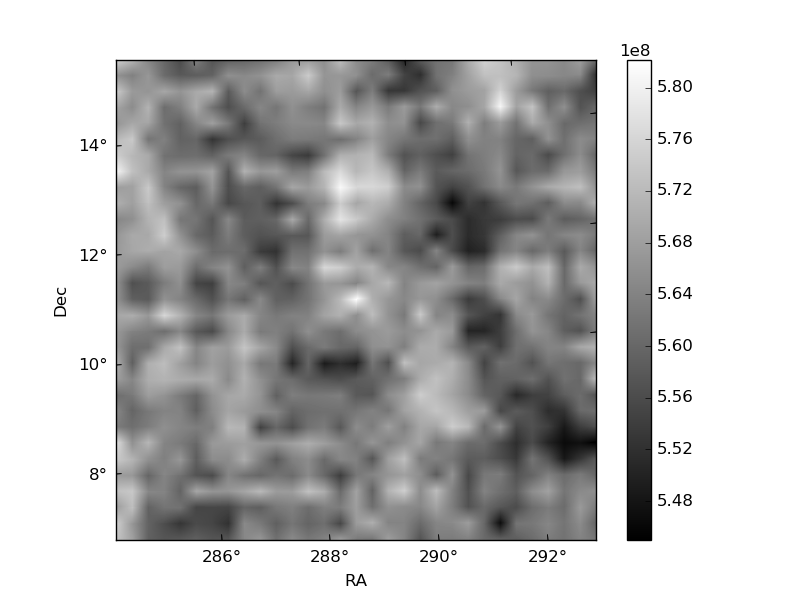
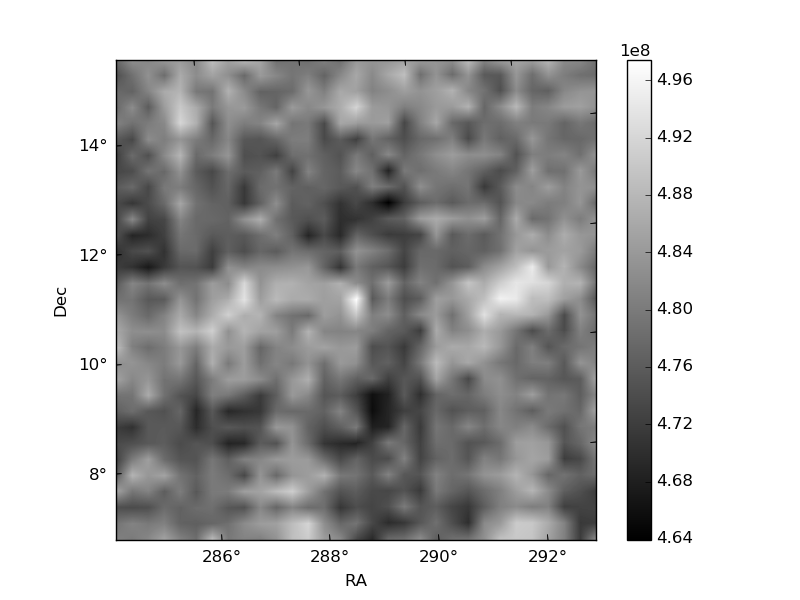
Histogram calculated using DETX and DETY for each event in the final _common_clean file
| Quadrant A | 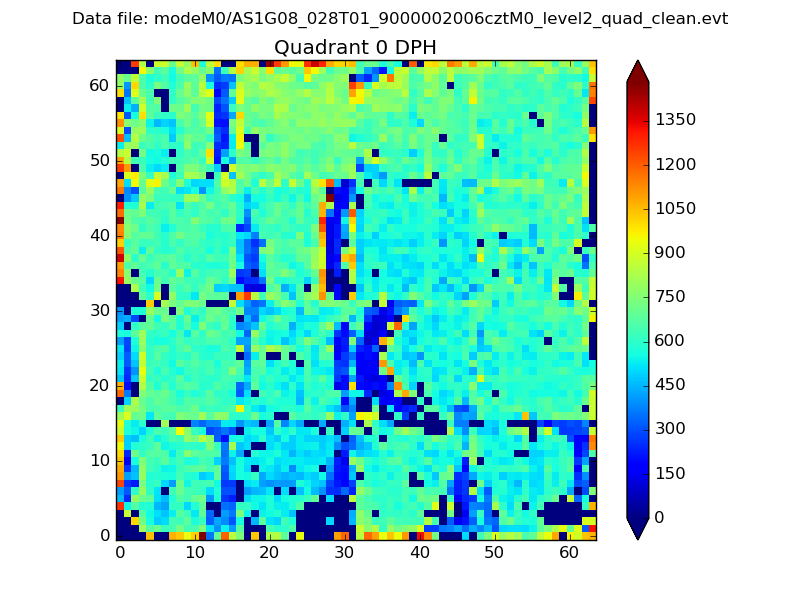 |
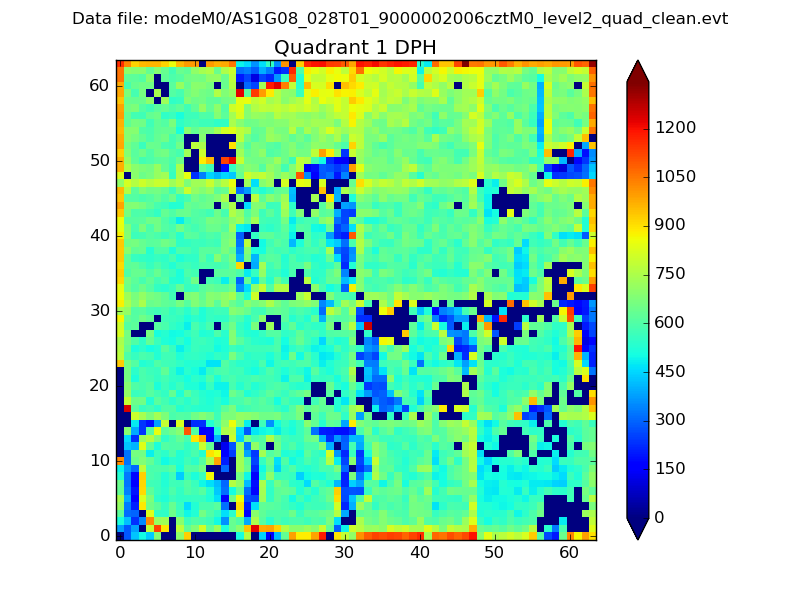 |
Quadrant B |
|---|---|---|---|
| Quadrant D | 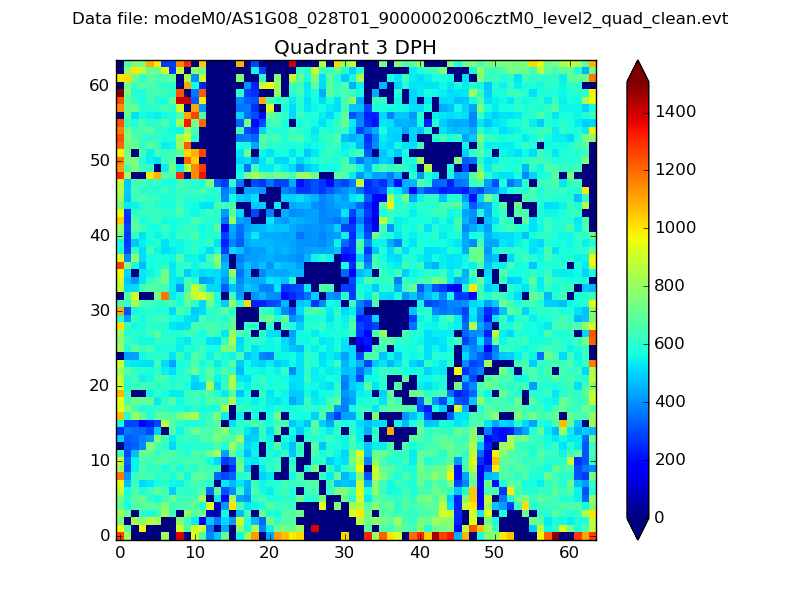 |
 |
Quadrant C |
| Plot type | Count rate plots | Images |
|---|---|---|
| Comparison with Poisson distribution Blue bars denote a histogram of data divided into 1 sec bins. Red curve is a Poisson curve with rate = median count rate of data. |
 |
 |
| Quadrant-wise count rates Data is divided into 100 sec bins |
 |
|
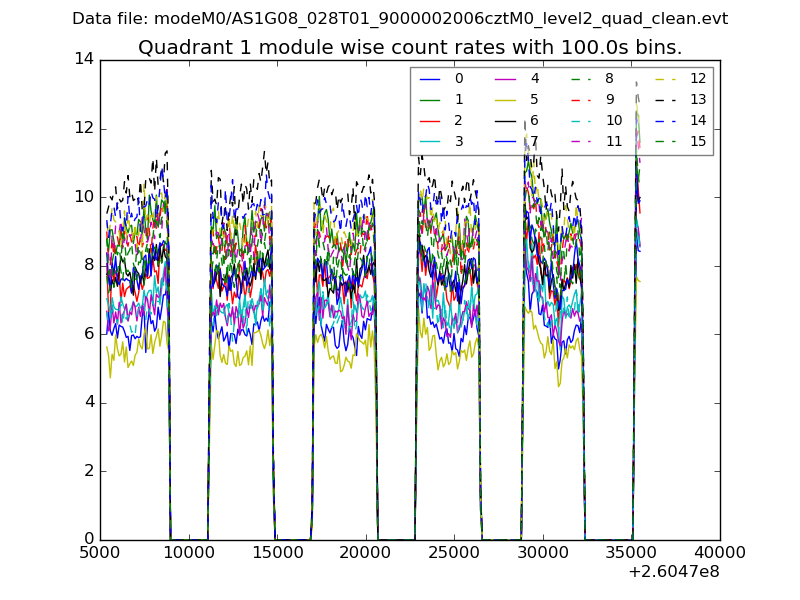
| Module-wise count rates for Quadrant A Data is divided into 100 sec bins |
 |
 |
| Module-wise count rates for Quadrant B Data is divided into 100 sec bins |
 |
 |
| Module-wise count rates for Quadrant C Data is divided into 100 sec bins |
 |
 |
| Module-wise count rates for Quadrant D Data is divided into 100 sec bins |
 |
 |
| Parameter | Plot |
|---|---|
| CZT HV Monitor |  |
| D_VDD |  |
| Temperature 1 | 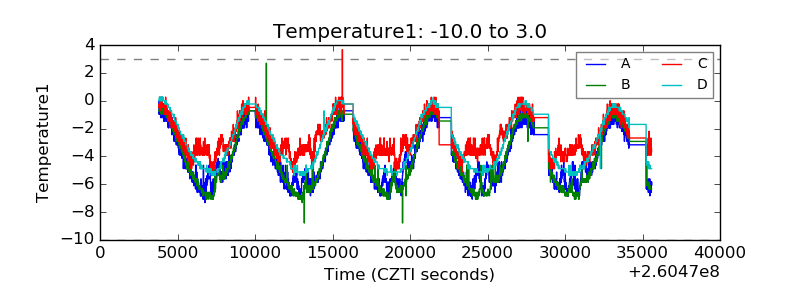 |
| Veto HV Monitor | 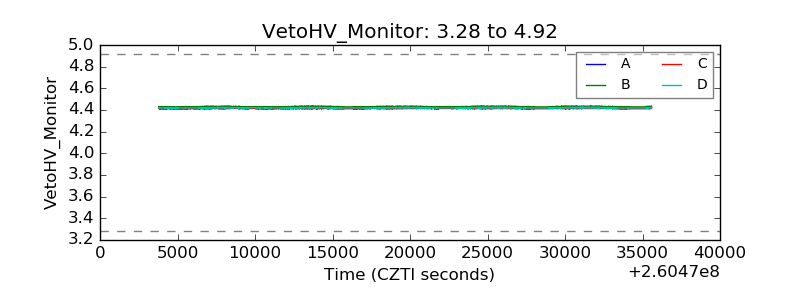 |
| Veto LLD | 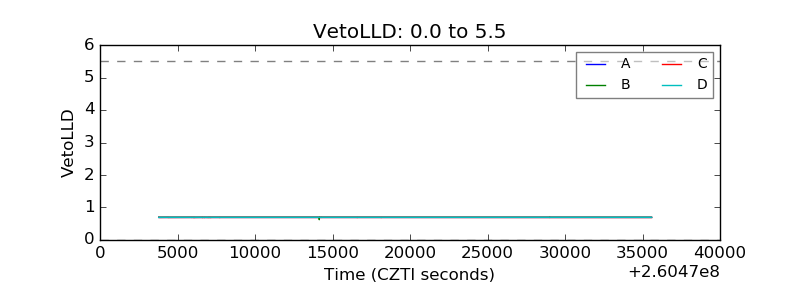 |
| Alpha Counter |  |
| _CPM_Rate | 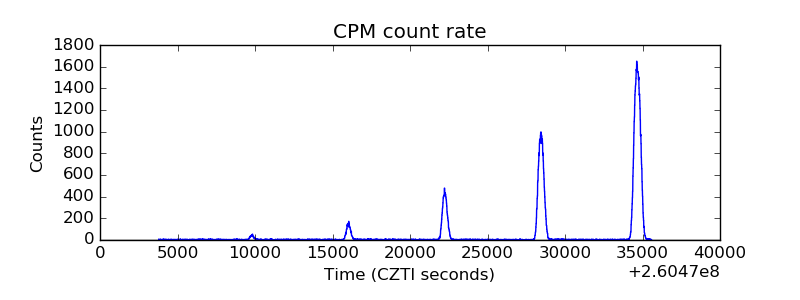 |
| CZT Counter |  |
| +2.5 Volts monitor |  |
| +5 Volts monitor |  |
| _ROLL_ROT |  |
| _Roll_DEC |  |
| _Roll_RA | 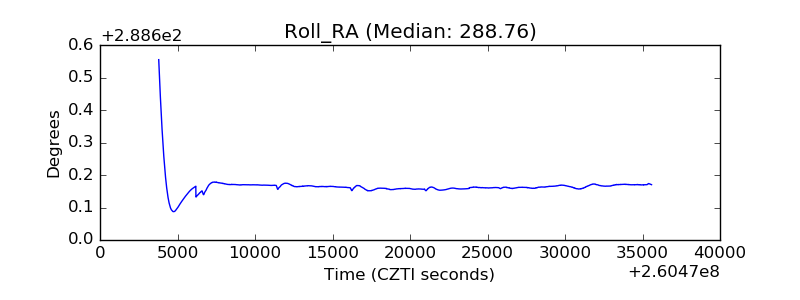 |
| Veto Counter | 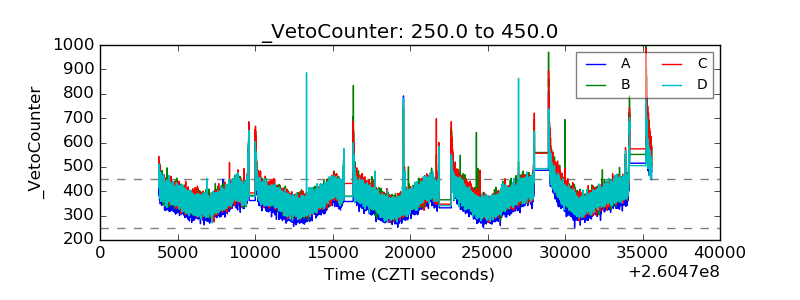 |