| Param | Original file | Final file |
|---|---|---|
| Filename | modeM0/AS1G08_028T01_9000002006_13597cztM0_level2.evt | modeM0/AS1G08_028T01_9000002006_13597cztM0_level2_quad_clean.evt |
| Size (bytes) | 658,998,720 | 82,840,320 |
| Size | 628.5 MB | 79.0 MB |
| Events in quadrant A | 3,594,556 | 510,518 |
| Events in quadrant B | 4,783,772 | 502,420 |
| Events in quadrant C | 3,643,286 | 505,266 |
| Events in quadrant D | 7,437,655 | 477,918 |
| Mode M9 | |||
|---|---|---|---|
| Quadrant | BADHDUFLAG | Total packets | Discarded packets |
| A | 0 | 4 | 0 |
| B | 0 | 4 | 0 |
| C | 0 | 4 | 0 |
| D | 0 | 4 | 0 |
| Mode SS | |||
|---|---|---|---|
| Quadrant | BADHDUFLAG | Total packets | Discarded packets |
| A | 0 | 150 | 0 |
| B | 0 | 150 | 0 |
| C | 0 | 150 | 0 |
| D | 0 | 150 | 0 |
| Mode M0 | |||
|---|---|---|---|
| Quadrant | BADHDUFLAG | Total packets | Discarded packets |
| A | 0 | 15260 | 2 |
| B | 0 | 19130 | 1 |
| C | 0 | 15174 | 1 |
| D | 0 | 27301 | 1 |
| Quadrant | Total seconds | Saturated seconds | Saturation percentage |
|---|---|---|---|
| A | 7357 | 58 | 0.788365% |
| B | 7357 | 309 | 4.200082% |
| C | 7357 | 54 | 0.733995% |
| D | 7357 | 1447 | 19.668343% |
Noise dominated data is calculated using 1-second bins in cleaned event files. If a bin has >2000 counts, and if more than 50% of those come from <1% of pixels, then it is considered to be noise-dominated and hence unusable.
| Quadrant | # 1 sec bins | Bins with >0 counts | Bins with >2000 counts | High rate bins dominated by noise | Noise dominated (total time) | Noise dominated (detector-on time) | Marked lightcurve |
|---|---|---|---|---|---|---|---|
| A | 7763 | 7359 | 6 | 6 | 0.08% | 0.08% |  |
| B | 7763 | 7359 | 115 | 115 | 1.48% | 1.56% | 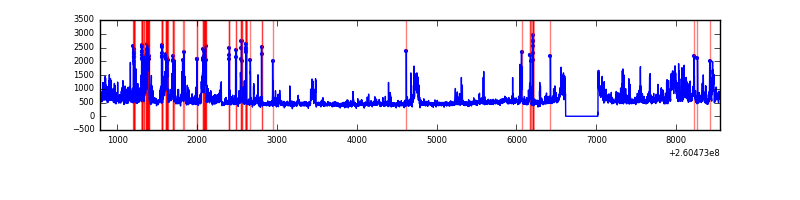 |
| C | 7763 | 7359 | 4 | 4 | 0.05% | 0.05% | 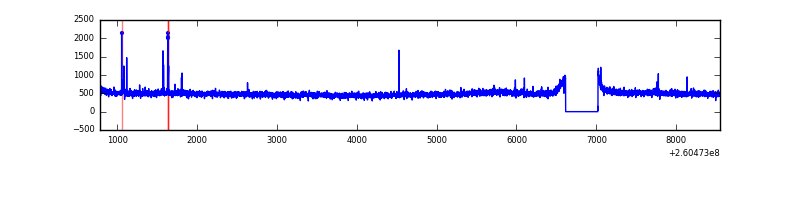 |
| D | 7763 | 7359 | 1229 | 1229 | 15.83% | 16.70% | 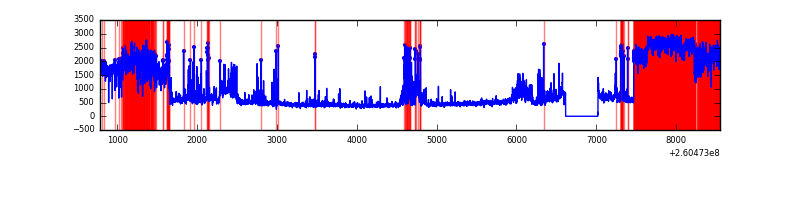 |
Top three noisy pixels from each quadrant. If the there are fewer than three noisy pixels in the level2.evt file, extra rows are filled as -1
| Pixel properties | Quadrant properties | ||||||
|---|---|---|---|---|---|---|---|
| Quadrant | DetID | PixID | Counts | Sigma | Mean | Median | Sigma |
| A | 1 | 162 | 47533 | 251.84 | 902 | 885 | 185.2 |
| A | 15 | 69 | 25932 | 135.22 | 902 | 885 | 185.2 |
| A | 1 | 178 | 14375 | 72.83 | 902 | 885 | 185.2 |
| B | 0 | 182 | 663626 | 3838.48 | 888 | 867 | 172.7 |
| B | 0 | 219 | 212274 | 1224.4 | 888 | 867 | 172.7 |
| B | 0 | 189 | 167273 | 963.77 | 888 | 867 | 172.7 |
| C | 3 | 233 | 195665 | 954.31 | 872 | 875 | 204.1 |
| C | 0 | 207 | 29311 | 139.31 | 872 | 875 | 204.1 |
| C | 8 | 128 | 9602 | 42.76 | 872 | 875 | 204.1 |
| D | 13 | 122 | 3373050 | 17494.39 | 794 | 772 | 192.8 |
| D | 5 | 222 | 536066 | 2776.95 | 794 | 772 | 192.8 |
| D | 8 | 195 | 173756 | 897.39 | 794 | 772 | 192.8 |
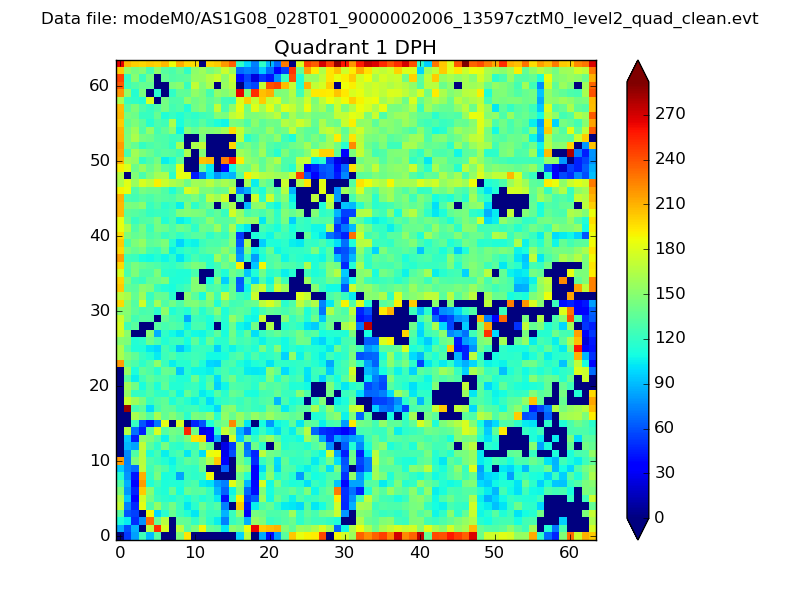
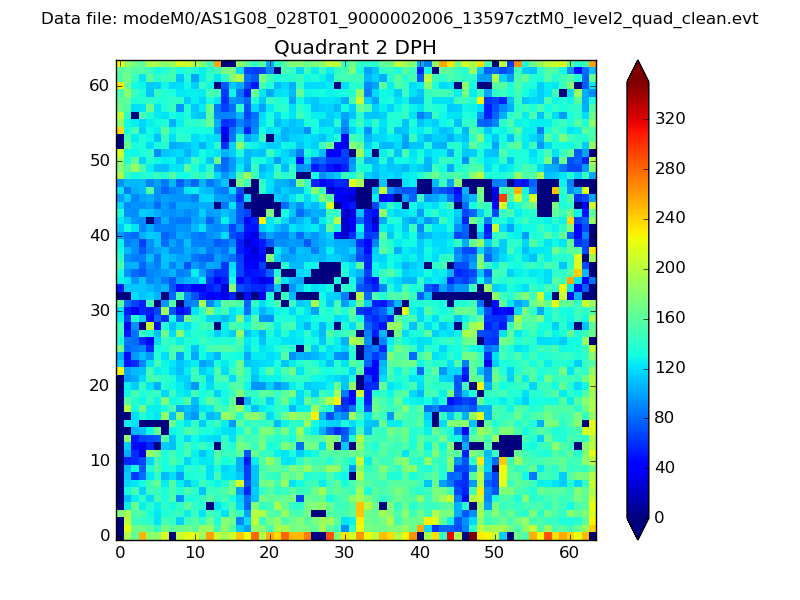
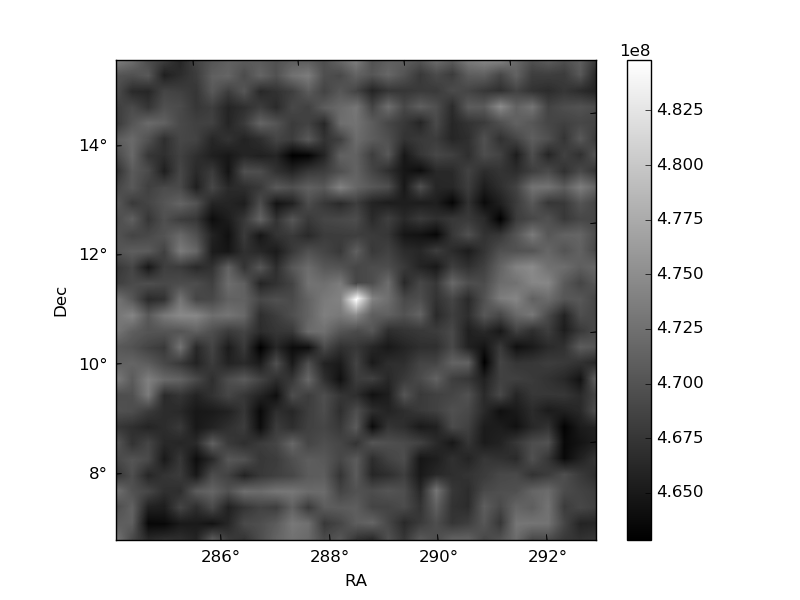
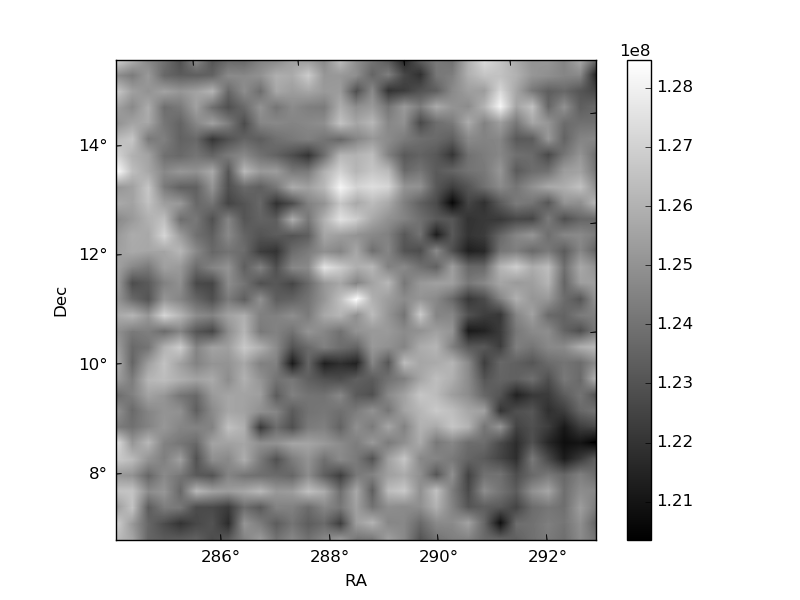
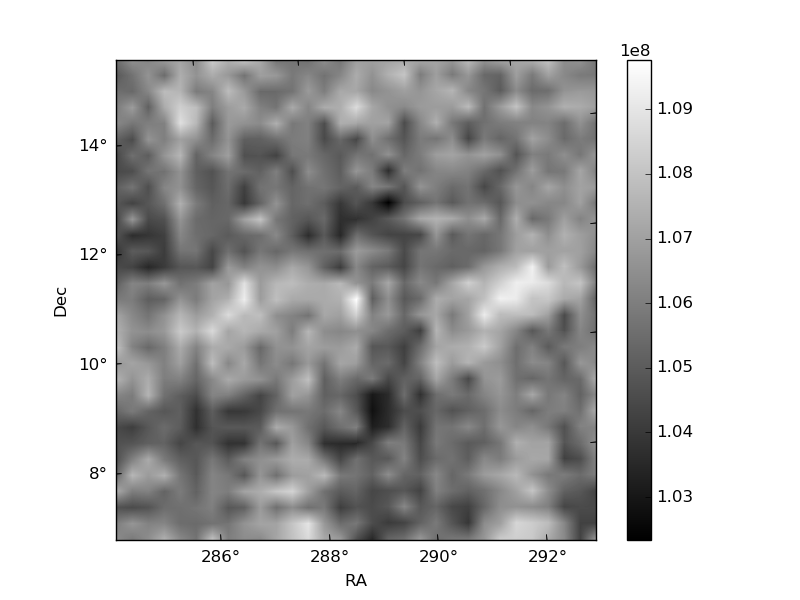
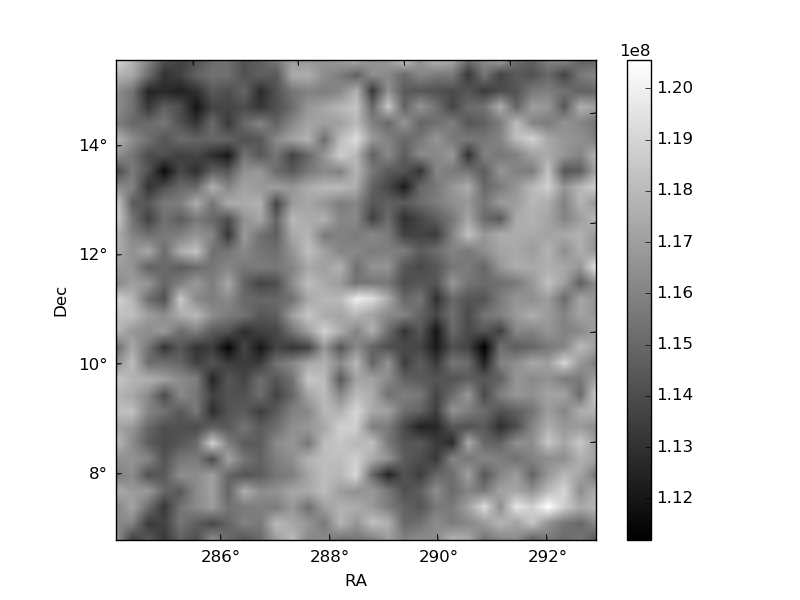
Histogram calculated using DETX and DETY for each event in the final _common_clean file
| Quadrant A | 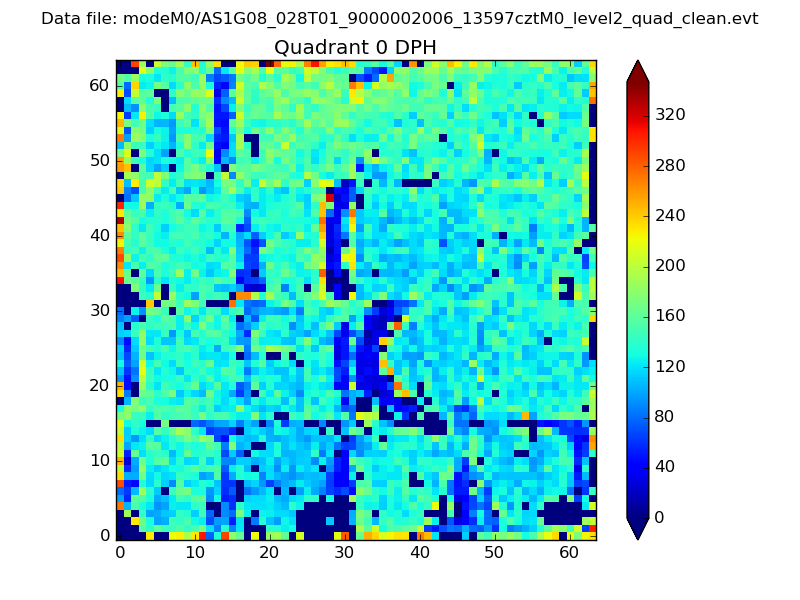 |
 |
Quadrant B |
|---|---|---|---|
| Quadrant D | 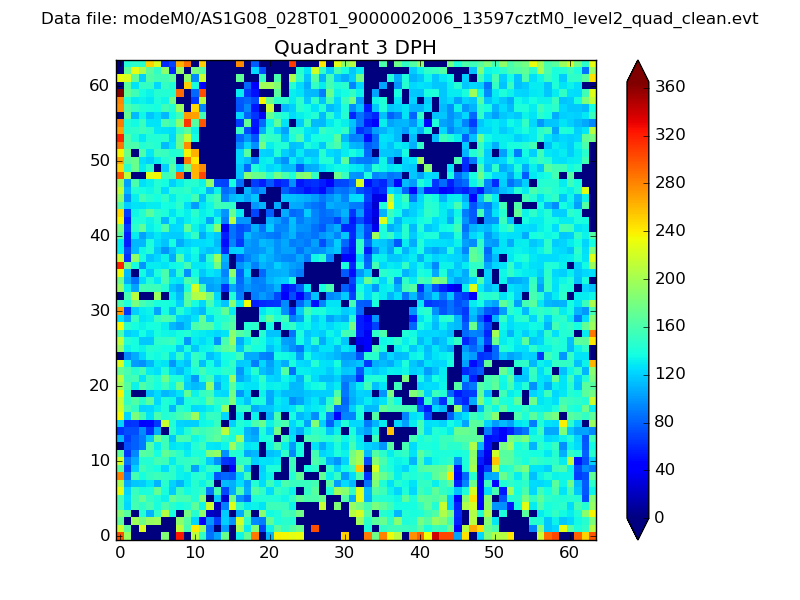 |
 |
Quadrant C |
| Plot type | Count rate plots | Images |
|---|---|---|
| Comparison with Poisson distribution Blue bars denote a histogram of data divided into 1 sec bins. Red curve is a Poisson curve with rate = median count rate of data. |
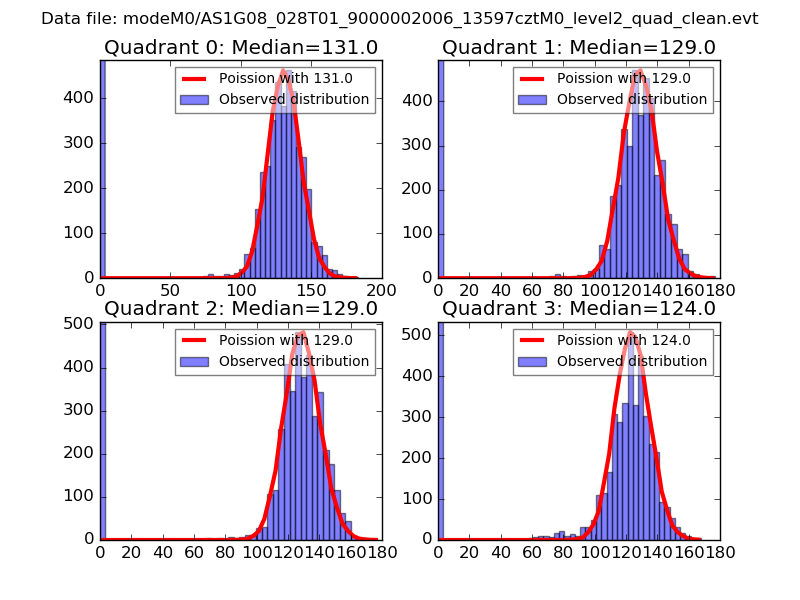 |
 |
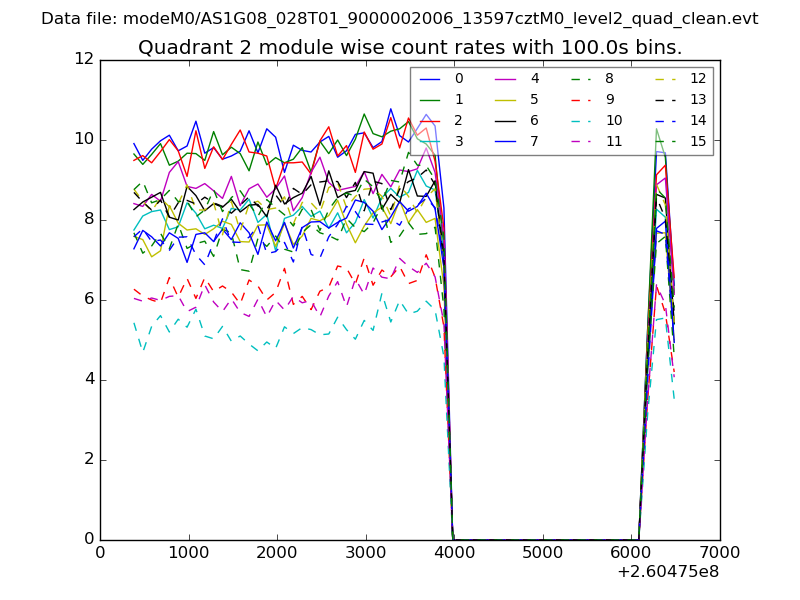
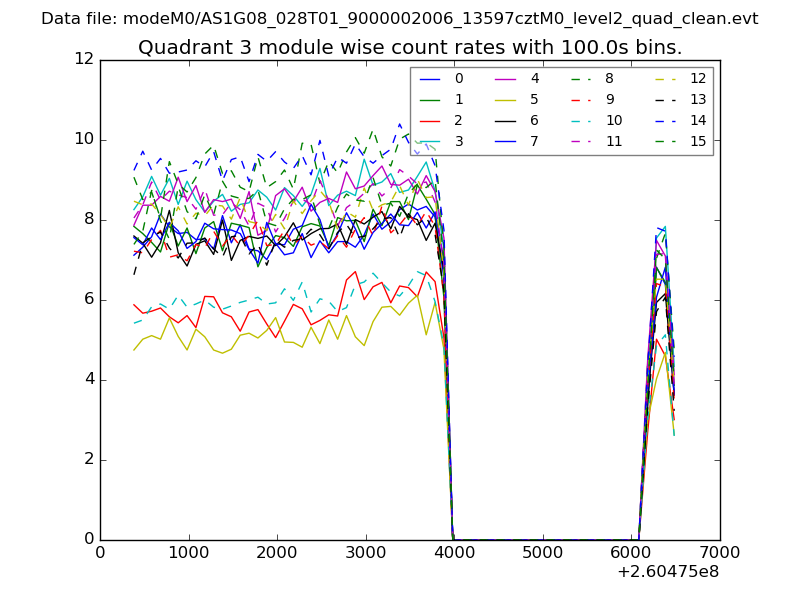
| Quadrant-wise count rates Data is divided into 100 sec bins |
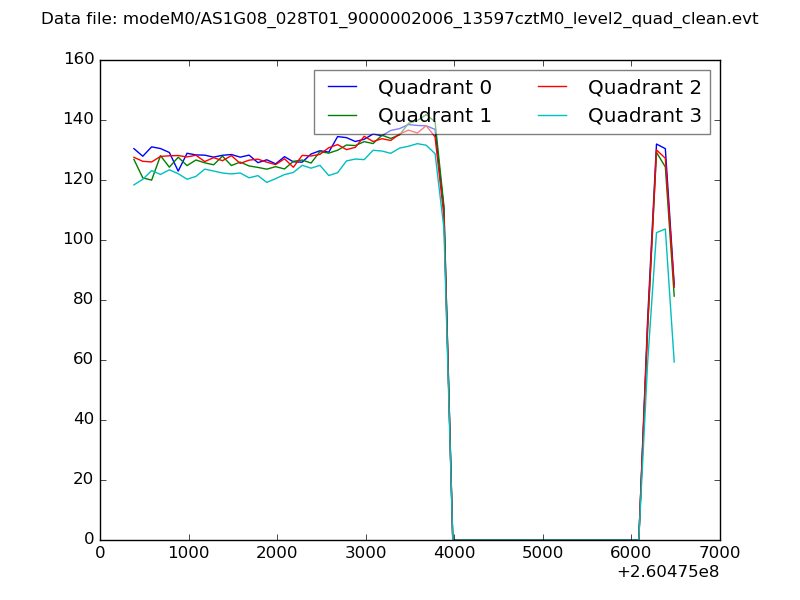 |
|
| Module-wise count rates for Quadrant A Data is divided into 100 sec bins |
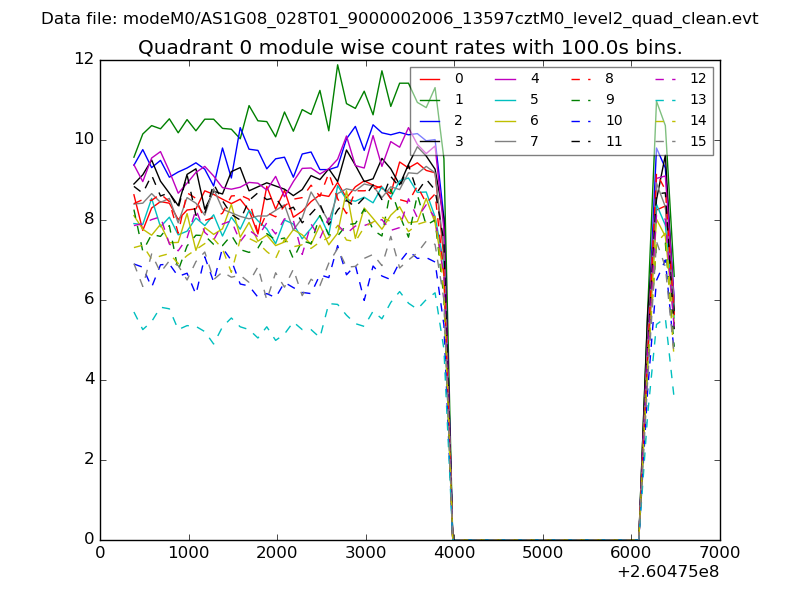 |
 |
| Module-wise count rates for Quadrant B Data is divided into 100 sec bins |
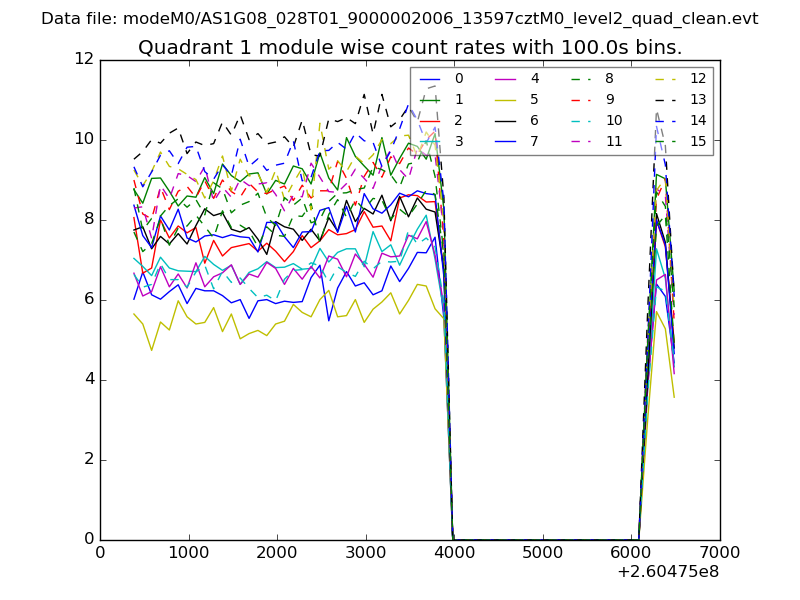 |
 |
| Module-wise count rates for Quadrant C Data is divided into 100 sec bins |
 |
 |
| Module-wise count rates for Quadrant D Data is divided into 100 sec bins |
 |
 |
| Parameter | Plot |
|---|---|
| CZT HV Monitor | 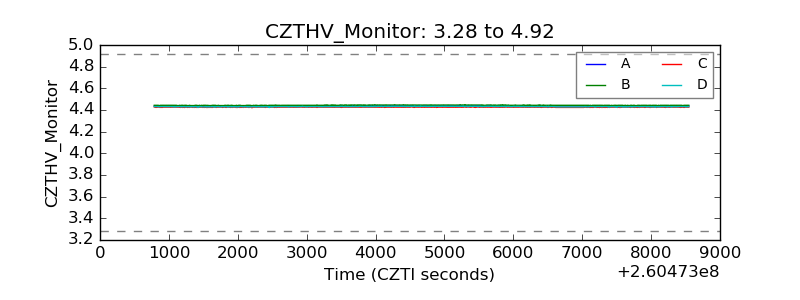 |
| D_VDD | 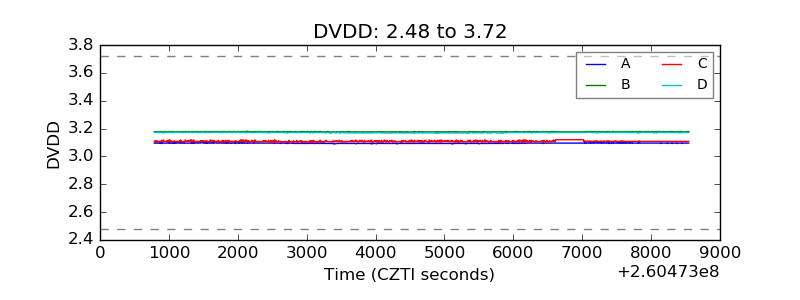 |
| Temperature 1 | 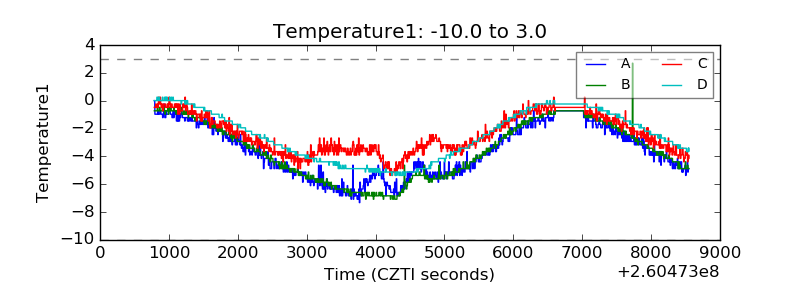 |
| Veto HV Monitor | 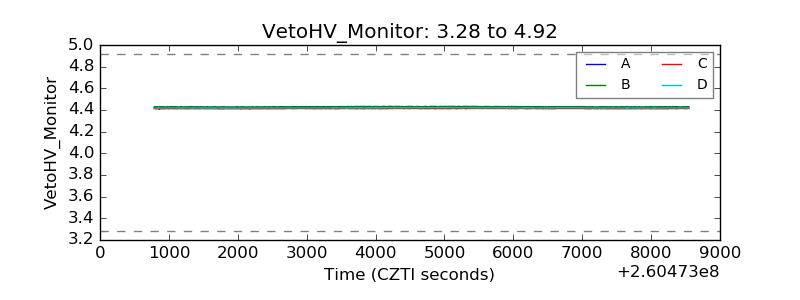 |
| Veto LLD | 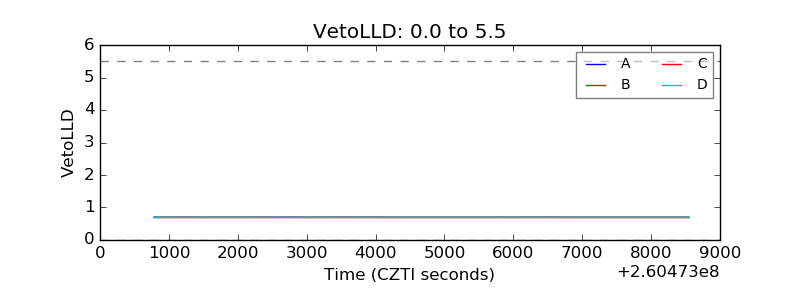 |
| Alpha Counter | 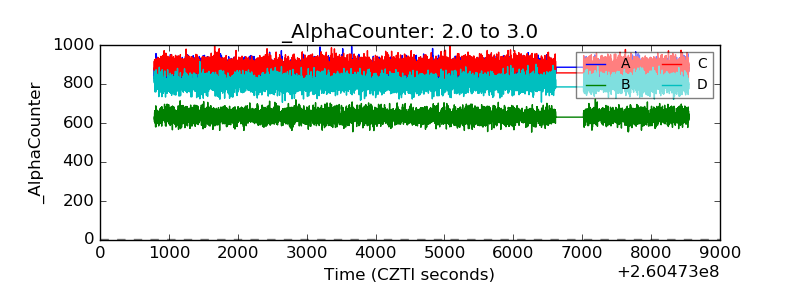 |
| _CPM_Rate | 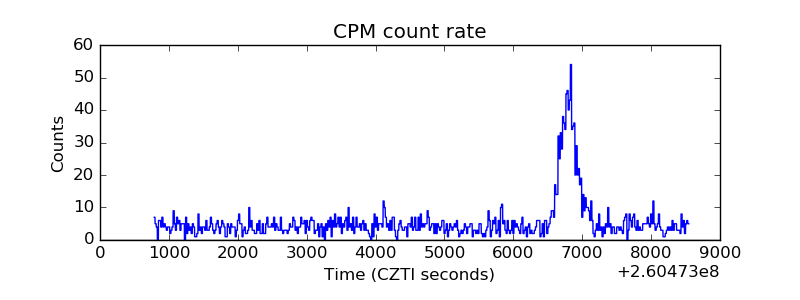 |
| CZT Counter | 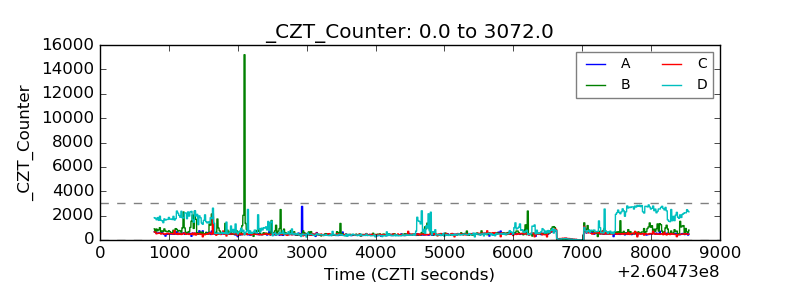 |
| +2.5 Volts monitor |  |
| +5 Volts monitor | 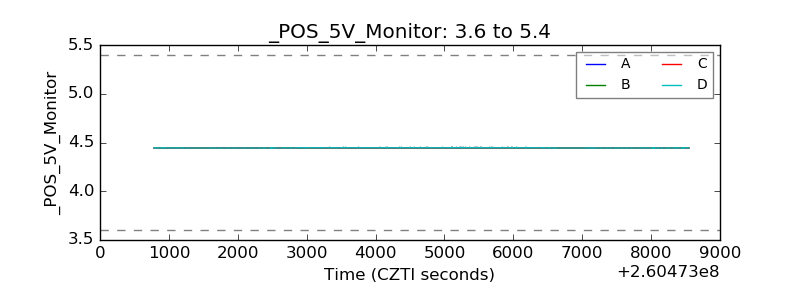 |
| _ROLL_ROT |  |
| _Roll_DEC | 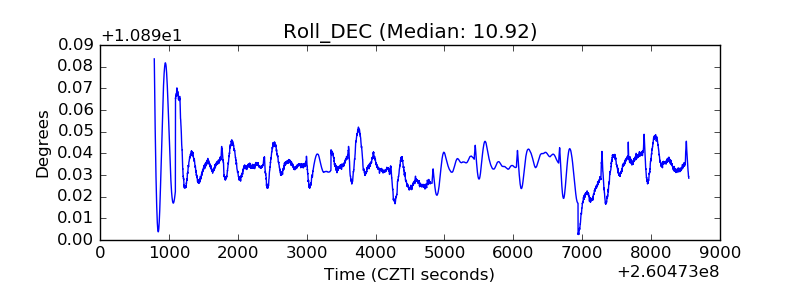 |
| _Roll_RA | 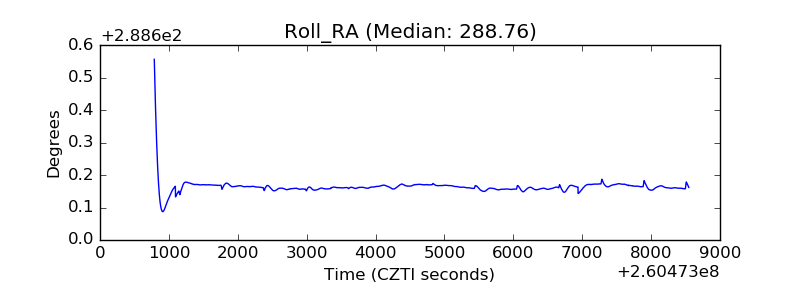 |
| Veto Counter | 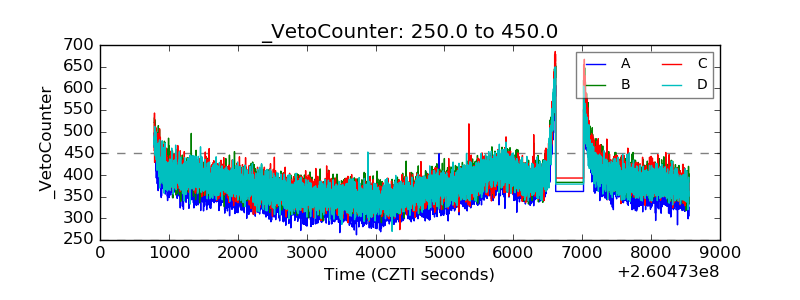 |