| Param | Original file | Final file |
|---|---|---|
| Filename | modeM0/AS1G08_028T01_9000002006_13599cztM0_level2.evt | modeM0/AS1G08_028T01_9000002006_13599cztM0_level2_quad_clean.evt |
| Size (bytes) | 1,194,776,640 | 167,146,560 |
| Size | 1.1 GB | 159.4 MB |
| Events in quadrant A | 5,904,121 | 1,082,727 |
| Events in quadrant B | 6,848,573 | 1,074,837 |
| Events in quadrant C | 6,145,808 | 1,077,875 |
| Events in quadrant D | 16,437,948 | 958,110 |
| Mode M9 | |||
|---|---|---|---|
| Quadrant | BADHDUFLAG | Total packets | Discarded packets |
| A | 0 | 14 | 0 |
| B | 0 | 14 | 0 |
| C | 0 | 14 | 0 |
| D | 0 | 14 | 0 |
| Mode SS | |||
|---|---|---|---|
| Quadrant | BADHDUFLAG | Total packets | Discarded packets |
| A | 0 | 254 | 0 |
| B | 0 | 254 | 0 |
| C | 0 | 254 | 0 |
| D | 0 | 254 | 0 |
| Mode M0 | |||
|---|---|---|---|
| Quadrant | BADHDUFLAG | Total packets | Discarded packets |
| A | 0 | 25709 | 3 |
| B | 0 | 28706 | 2 |
| C | 0 | 26048 | 2 |
| D | 0 | 57561 | 2 |
| Quadrant | Total seconds | Saturated seconds | Saturation percentage |
|---|---|---|---|
| A | 12565 | 37 | 0.294469% |
| B | 12565 | 164 | 1.305213% |
| C | 12565 | 48 | 0.382014% |
| D | 12565 | 3433 | 27.321926% |
Noise dominated data is calculated using 1-second bins in cleaned event files. If a bin has >2000 counts, and if more than 50% of those come from <1% of pixels, then it is considered to be noise-dominated and hence unusable.
| Quadrant | # 1 sec bins | Bins with >0 counts | Bins with >2000 counts | High rate bins dominated by noise | Noise dominated (total time) | Noise dominated (detector-on time) | Marked lightcurve |
|---|---|---|---|---|---|---|---|
| A | 13956 | 12568 | 3 | 3 | 0.02% | 0.02% | 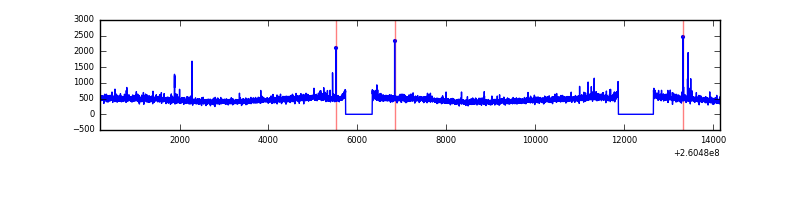 |
| B | 13956 | 12568 | 31 | 31 | 0.22% | 0.25% | 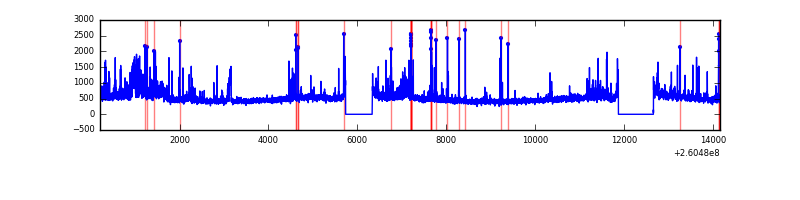 |
| C | 13956 | 12568 | 15 | 15 | 0.11% | 0.12% | 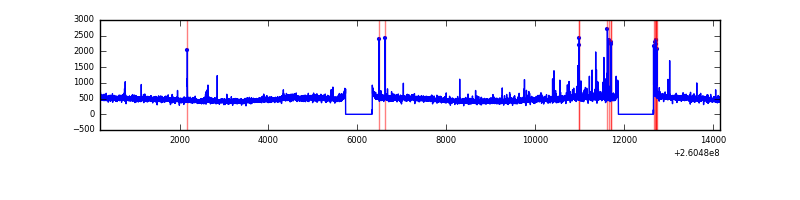 |
| D | 13956 | 12568 | 3410 | 3410 | 24.43% | 27.13% | 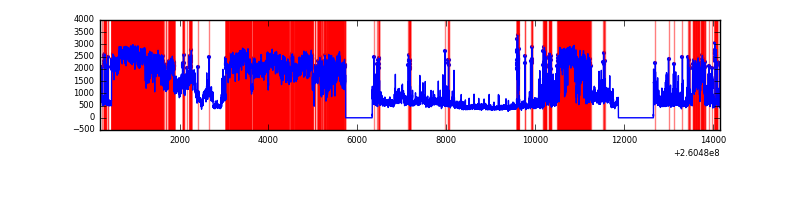 |
Top three noisy pixels from each quadrant. If the there are fewer than three noisy pixels in the level2.evt file, extra rows are filled as -1
| Pixel properties | Quadrant properties | ||||||
|---|---|---|---|---|---|---|---|
| Quadrant | DetID | PixID | Counts | Sigma | Mean | Median | Sigma |
| A | 15 | 69 | 30772 | 94.89 | 1511 | 1484 | 308.7 |
| A | 1 | 162 | 29679 | 91.35 | 1511 | 1484 | 308.7 |
| A | 0 | 226 | 13764 | 39.79 | 1511 | 1484 | 308.7 |
| B | 0 | 219 | 323796 | 1121.04 | 1508 | 1471 | 287.5 |
| B | 0 | 182 | 232454 | 803.35 | 1508 | 1471 | 287.5 |
| B | 3 | 64 | 120806 | 415.04 | 1508 | 1471 | 287.5 |
| C | 3 | 233 | 350628 | 1026.42 | 1466 | 1477 | 340.2 |
| C | 7 | 254 | 21416 | 58.62 | 1466 | 1477 | 340.2 |
| C | 7 | 237 | 19574 | 53.2 | 1466 | 1477 | 340.2 |
| D | 13 | 122 | 8673959 | 27127.33 | 1304 | 1270 | 319.7 |
| D | 5 | 222 | 2493405 | 7795.16 | 1304 | 1270 | 319.7 |
| D | 8 | 195 | 104774 | 323.75 | 1304 | 1270 | 319.7 |
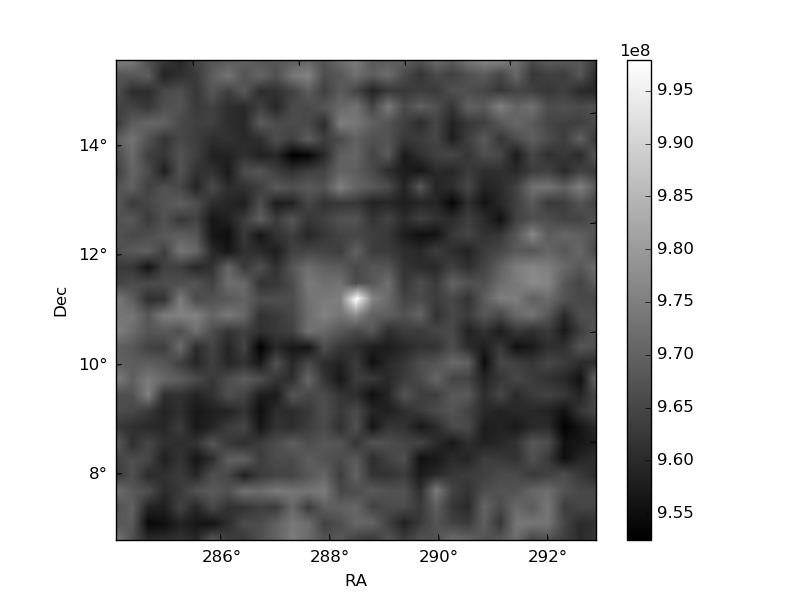
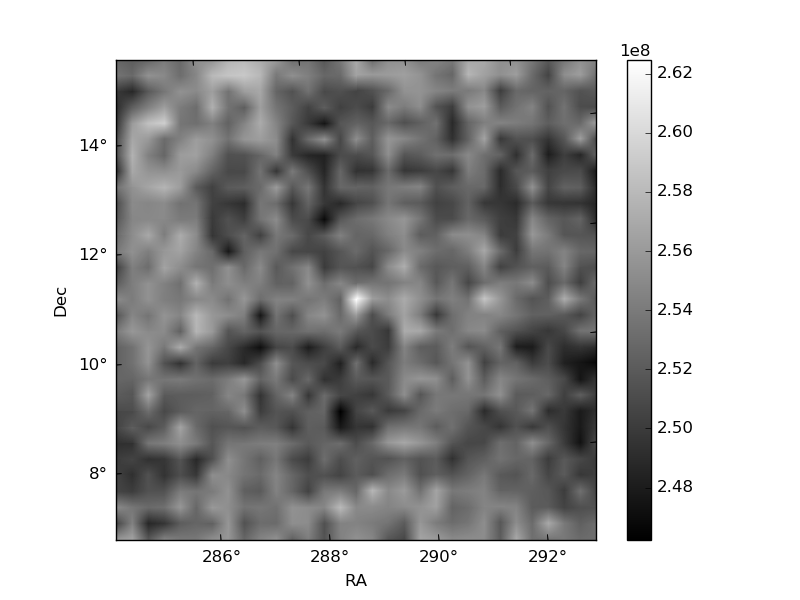
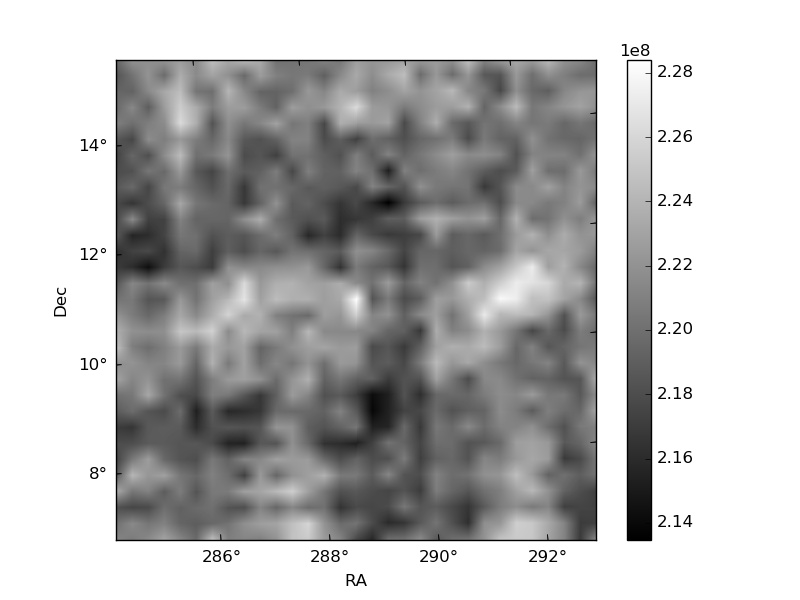
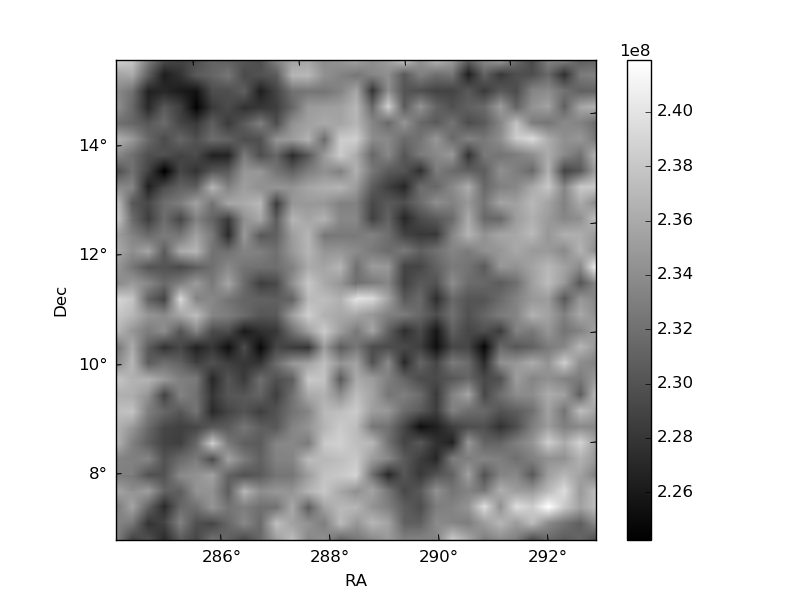
Histogram calculated using DETX and DETY for each event in the final _common_clean file
| Quadrant A | 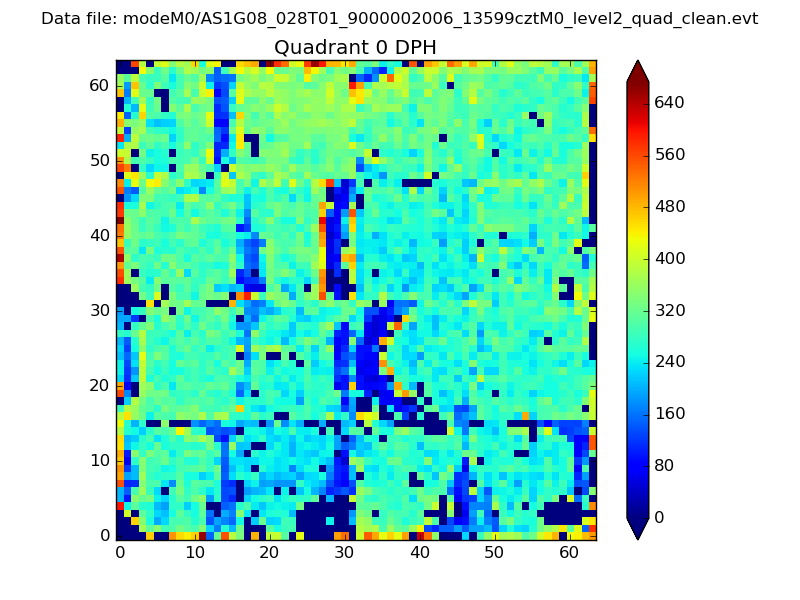 |
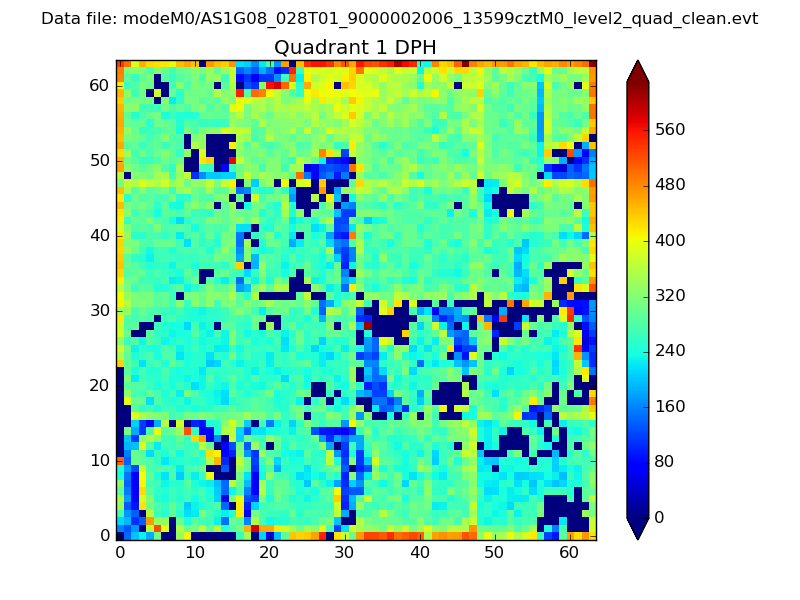 |
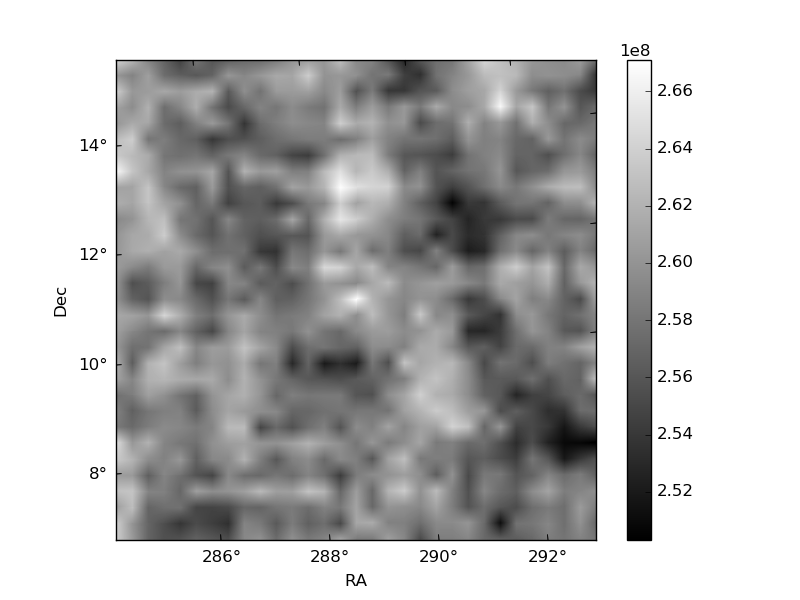
Quadrant B |
|---|---|---|---|
| Quadrant D | 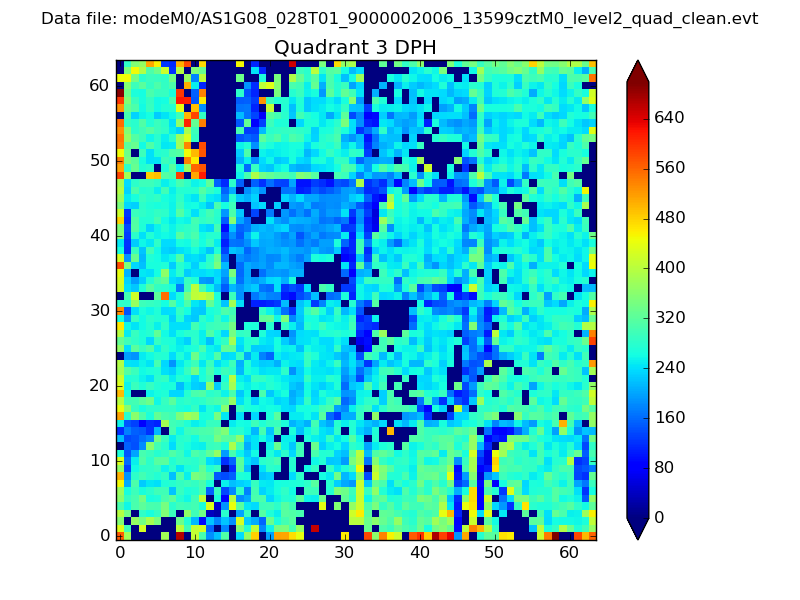 |
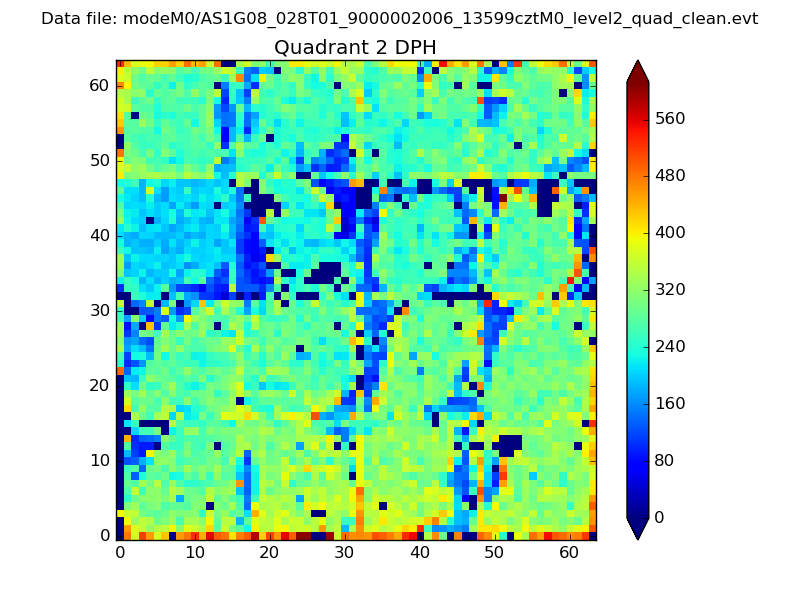 |
Quadrant C |
| Plot type | Count rate plots | Images |
|---|---|---|
| Comparison with Poisson distribution Blue bars denote a histogram of data divided into 1 sec bins. Red curve is a Poisson curve with rate = median count rate of data. |
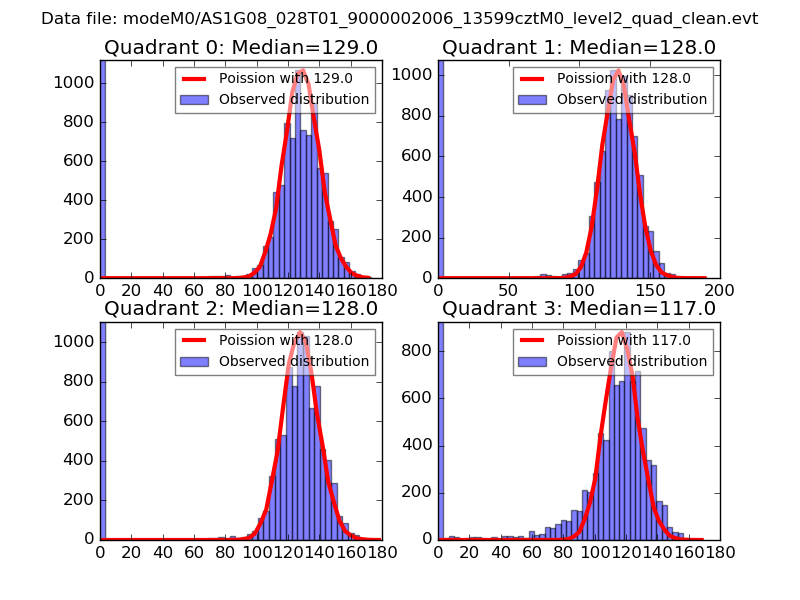 |
 |
| Quadrant-wise count rates Data is divided into 100 sec bins |
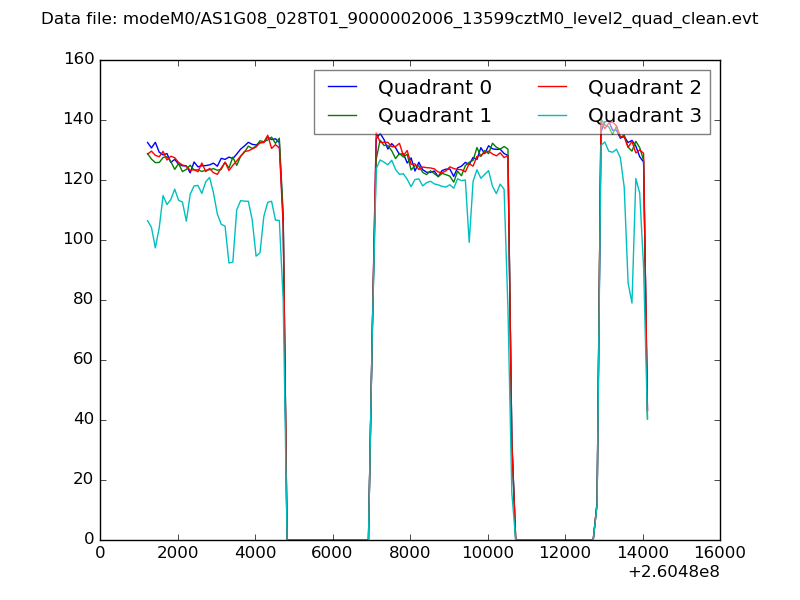 |
|
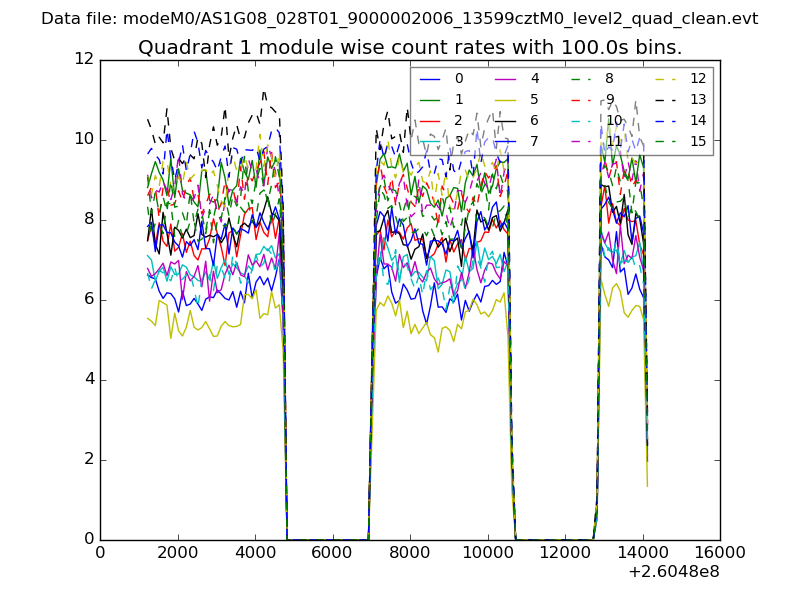
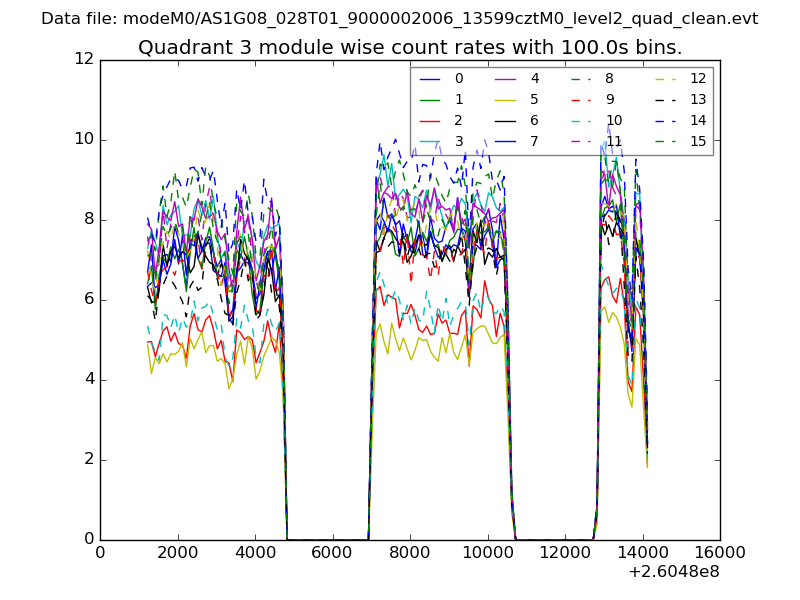
| Module-wise count rates for Quadrant A Data is divided into 100 sec bins |
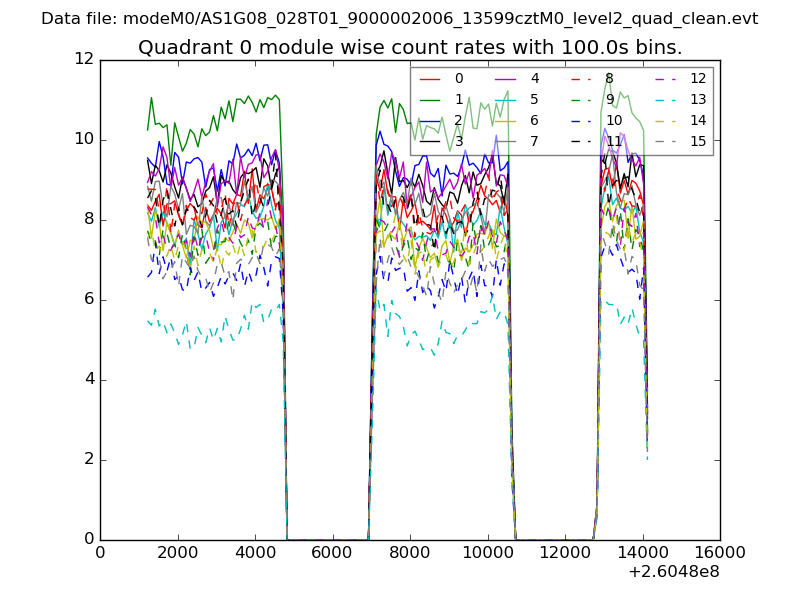 |
 |
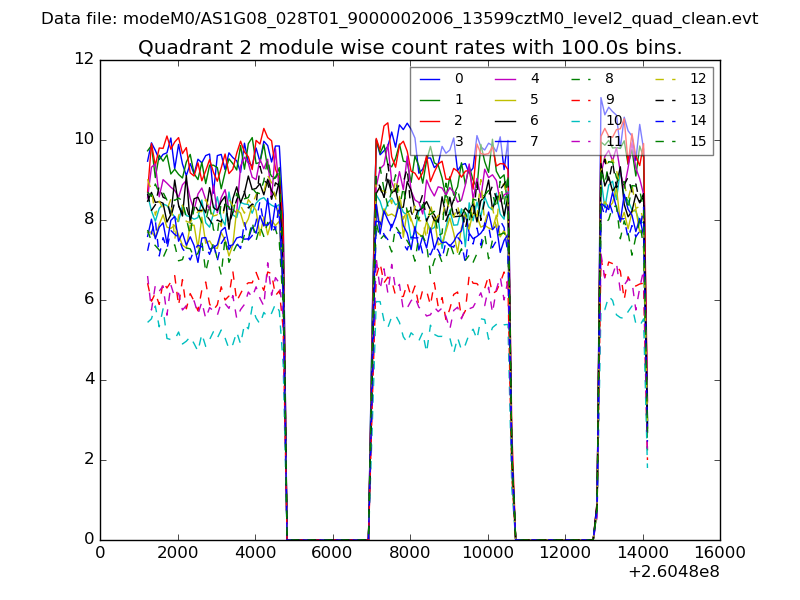
| Module-wise count rates for Quadrant B Data is divided into 100 sec bins |
 |
 |
| Module-wise count rates for Quadrant C Data is divided into 100 sec bins |
 |
 |
| Module-wise count rates for Quadrant D Data is divided into 100 sec bins |
 |
 |
| Parameter | Plot |
|---|---|
| CZT HV Monitor | 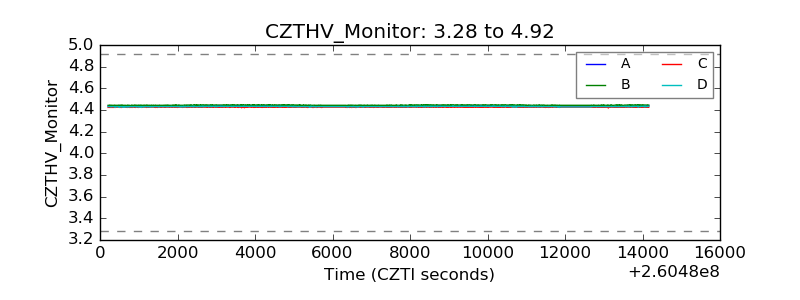 |
| D_VDD | 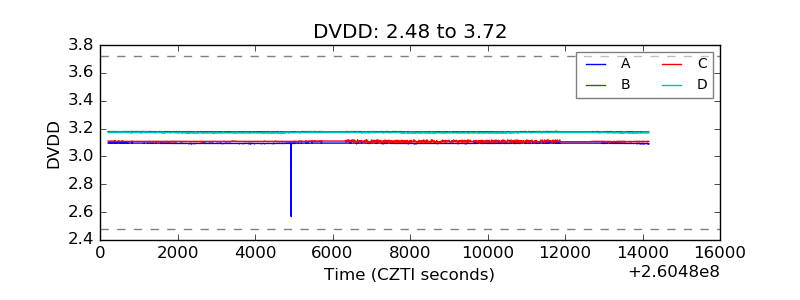 |
| Temperature 1 | 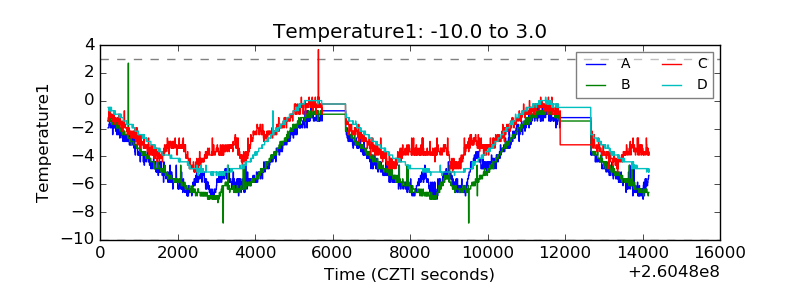 |
| Veto HV Monitor | 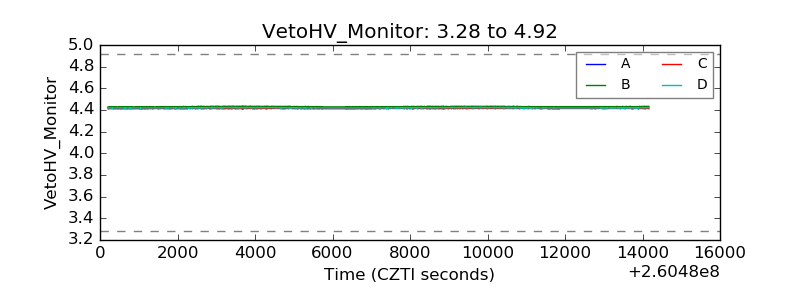 |
| Veto LLD | 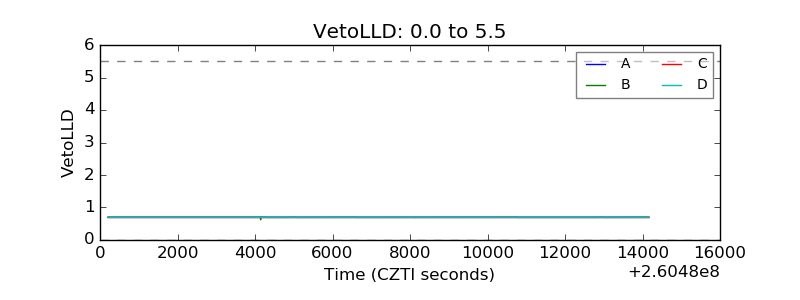 |
| Alpha Counter | 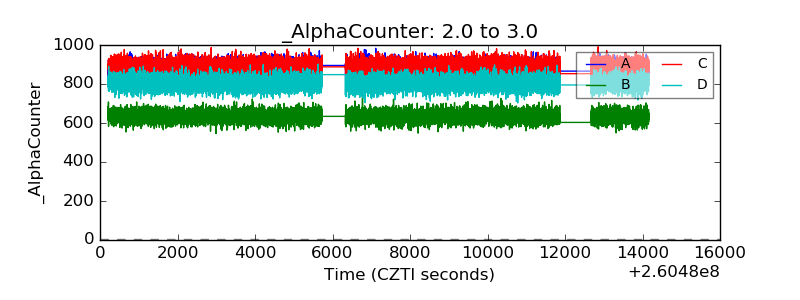 |
| _CPM_Rate | 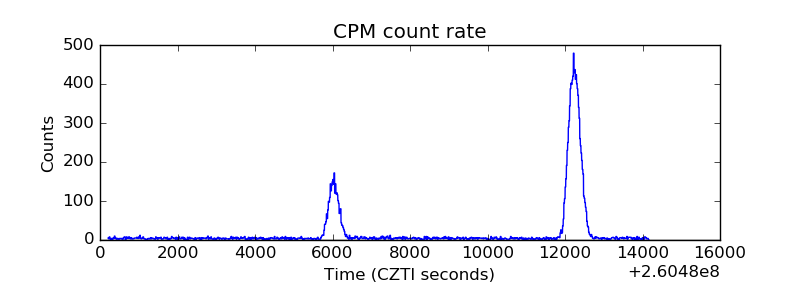 |
| CZT Counter | 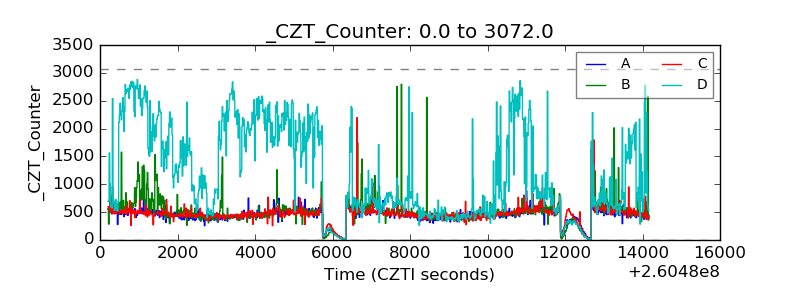 |
| +2.5 Volts monitor |  |
| +5 Volts monitor |  |
| _ROLL_ROT | 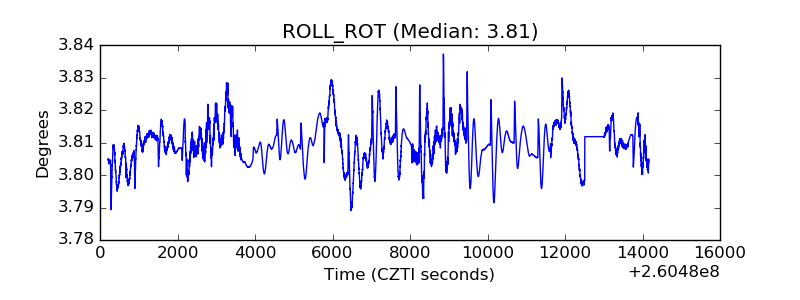 |
| _Roll_DEC | 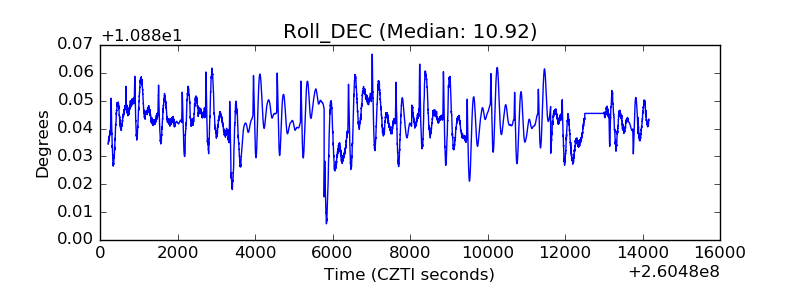 |
| _Roll_RA | 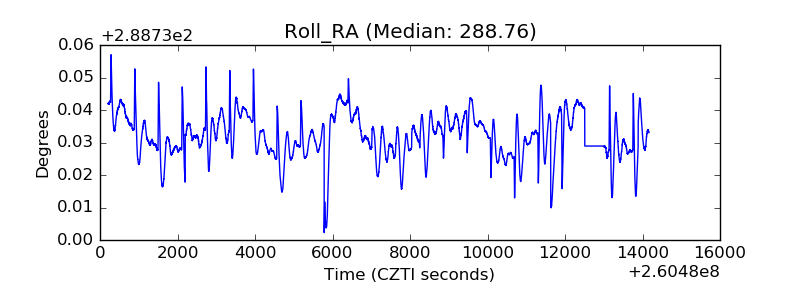 |
| Veto Counter | 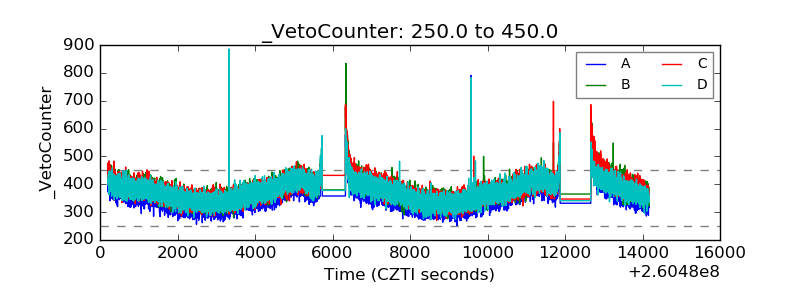 |