| Param | Original file | Final file |
|---|---|---|
| Filename | modeM0/AS1G08_028T01_9000002006_13600cztM0_level2.evt | modeM0/AS1G08_028T01_9000002006_13600cztM0_level2_quad_clean.evt |
| Size (bytes) | 548,242,560 | 99,947,520 |
| Size | 522.8 MB | 95.3 MB |
| Events in quadrant A | 3,227,059 | 656,359 |
| Events in quadrant B | 4,120,100 | 652,138 |
| Events in quadrant C | 3,356,460 | 652,623 |
| Events in quadrant D | 5,443,147 | 596,145 |
| Mode M9 | |||
|---|---|---|---|
| Quadrant | BADHDUFLAG | Total packets | Discarded packets |
| A | 0 | 12 | 0 |
| B | 0 | 12 | 0 |
| C | 0 | 12 | 0 |
| D | 0 | 13 | 0 |
| Mode SS | |||
|---|---|---|---|
| Quadrant | BADHDUFLAG | Total packets | Discarded packets |
| A | 0 | 138 | 0 |
| B | 0 | 138 | 0 |
| C | 0 | 138 | 0 |
| D | 0 | 138 | 0 |
| Mode M0 | |||
|---|---|---|---|
| Quadrant | BADHDUFLAG | Total packets | Discarded packets |
| A | 0 | 13990 | 3 |
| B | 0 | 16761 | 2 |
| C | 0 | 14197 | 2 |
| D | 0 | 20733 | 2 |
| Quadrant | Total seconds | Saturated seconds | Saturation percentage |
|---|---|---|---|
| A | 6732 | 38 | 0.564468% |
| B | 6732 | 258 | 3.832442% |
| C | 6732 | 44 | 0.653595% |
| D | 6732 | 566 | 8.407605% |
Noise dominated data is calculated using 1-second bins in cleaned event files. If a bin has >2000 counts, and if more than 50% of those come from <1% of pixels, then it is considered to be noise-dominated and hence unusable.
| Quadrant | # 1 sec bins | Bins with >0 counts | Bins with >2000 counts | High rate bins dominated by noise | Noise dominated (total time) | Noise dominated (detector-on time) | Marked lightcurve |
|---|---|---|---|---|---|---|---|
| A | 7643 | 6734 | 6 | 6 | 0.08% | 0.09% |  |
| B | 7643 | 6734 | 81 | 81 | 1.06% | 1.20% |  |
| C | 7643 | 6734 | 7 | 7 | 0.09% | 0.10% |  |
| D | 7643 | 6734 | 319 | 319 | 4.17% | 4.74% |  |
Top three noisy pixels from each quadrant. If the there are fewer than three noisy pixels in the level2.evt file, extra rows are filled as -1
| Pixel properties | Quadrant properties | ||||||
|---|---|---|---|---|---|---|---|
| Quadrant | DetID | PixID | Counts | Sigma | Mean | Median | Sigma |
| A | 15 | 69 | 34664 | 200.9 | 820 | 806 | 168.5 |
| A | 1 | 162 | 19618 | 111.62 | 820 | 806 | 168.5 |
| A | 15 | 157 | 12158 | 67.36 | 820 | 806 | 168.5 |
| B | 0 | 219 | 502337 | 3188.51 | 815 | 794 | 157.3 |
| B | 0 | 182 | 291100 | 1845.59 | 815 | 794 | 157.3 |
| B | 3 | 64 | 47235 | 295.24 | 815 | 794 | 157.3 |
| C | 3 | 233 | 219644 | 1176.51 | 797 | 804 | 186.0 |
| C | 0 | 207 | 16932 | 86.71 | 797 | 804 | 186.0 |
| C | 7 | 238 | 7292 | 34.88 | 797 | 804 | 186.0 |
| D | 13 | 122 | 1886132 | 10140.53 | 768 | 748 | 185.9 |
| D | 8 | 195 | 335254 | 1799.14 | 768 | 748 | 185.9 |
| D | 5 | 222 | 208368 | 1116.68 | 768 | 748 | 185.9 |
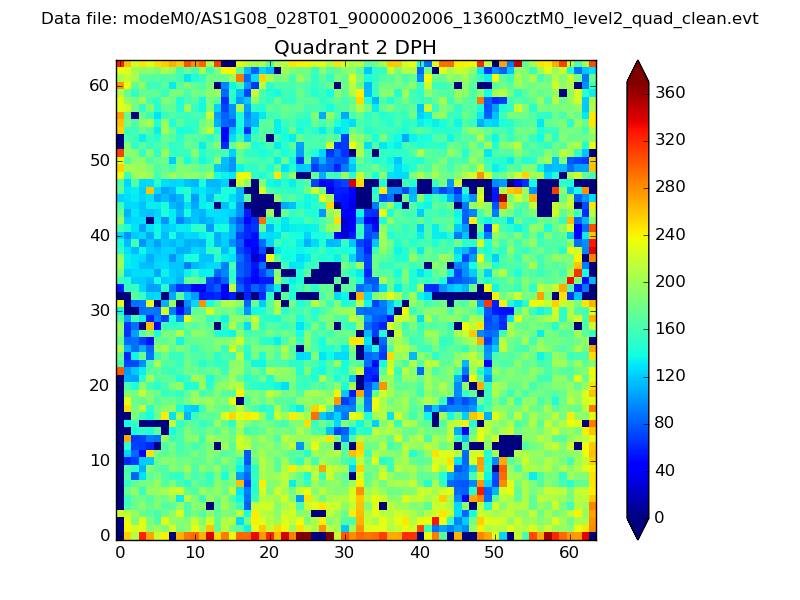
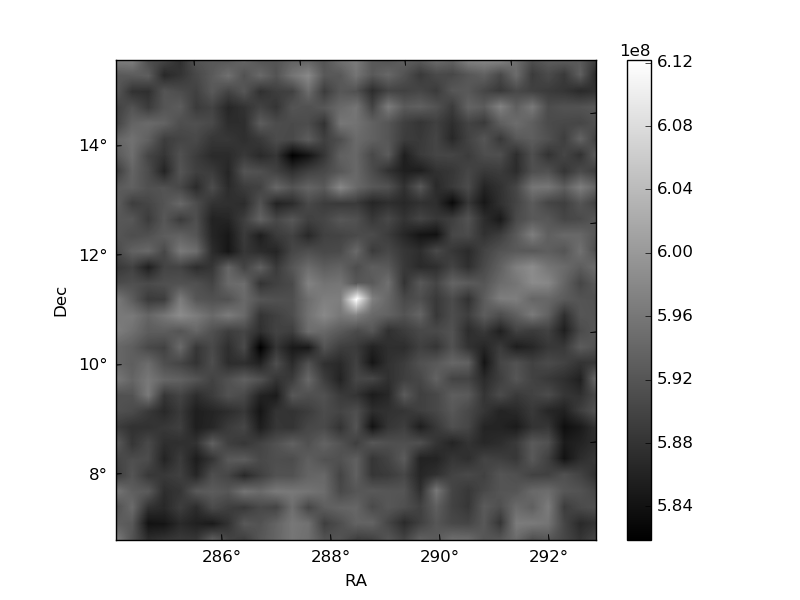
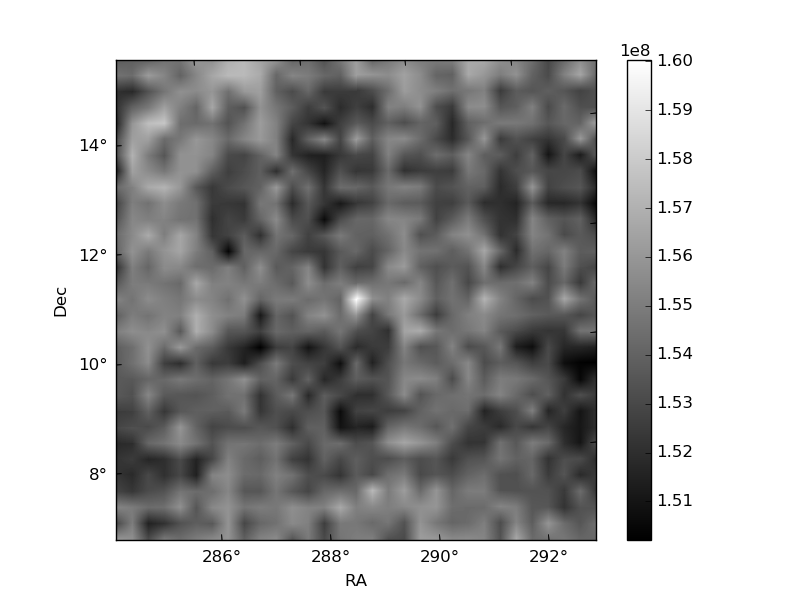
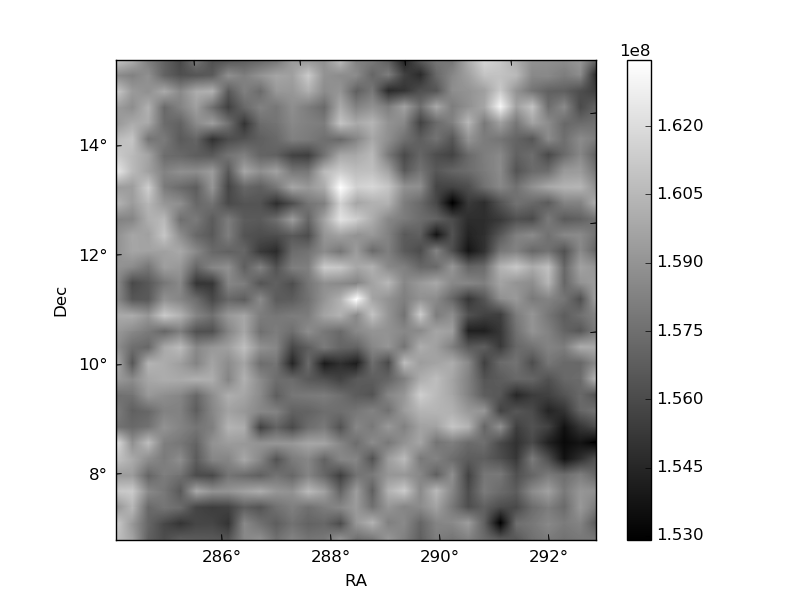
Histogram calculated using DETX and DETY for each event in the final _common_clean file
| Quadrant A | 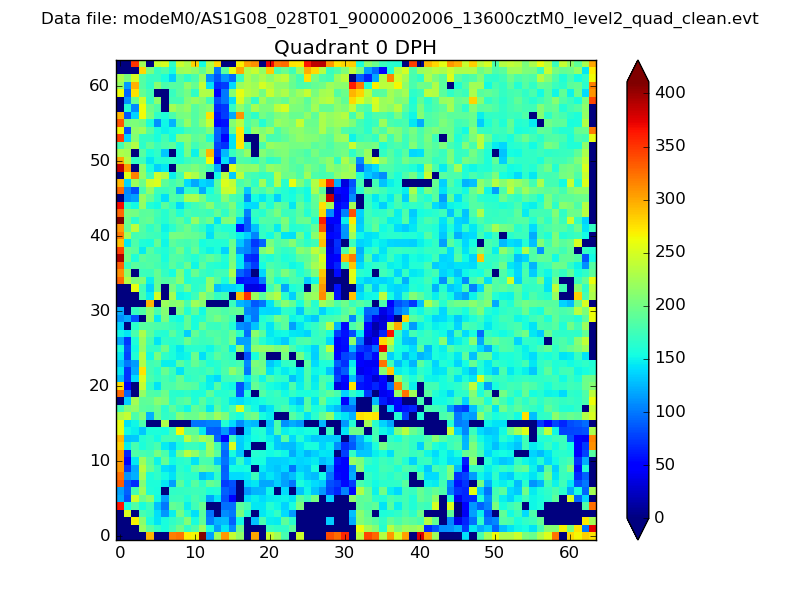 |
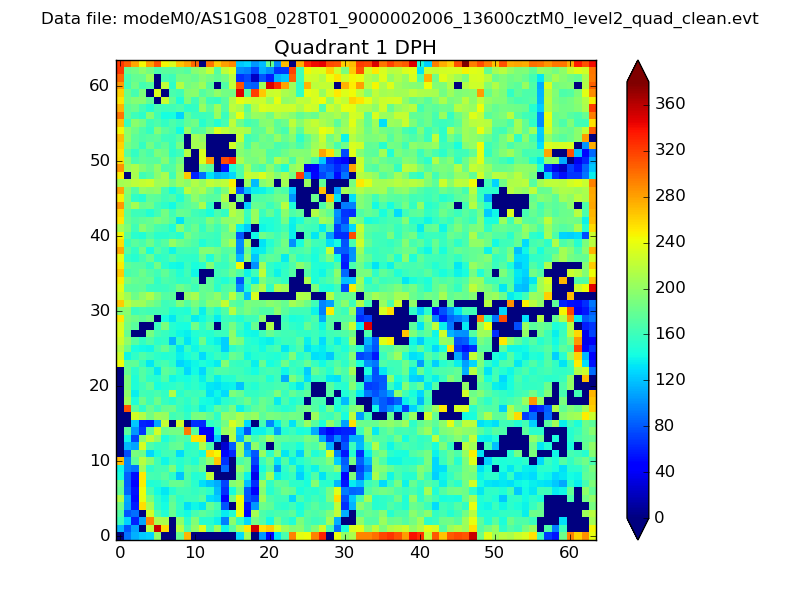 |
Quadrant B |
|---|---|---|---|
| Quadrant D | 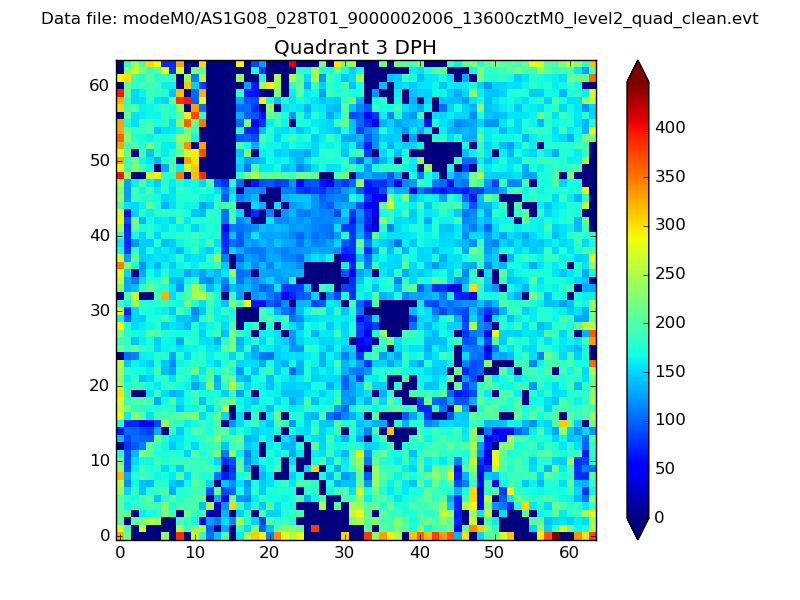 |
 |
Quadrant C |
| Plot type | Count rate plots | Images |
|---|---|---|
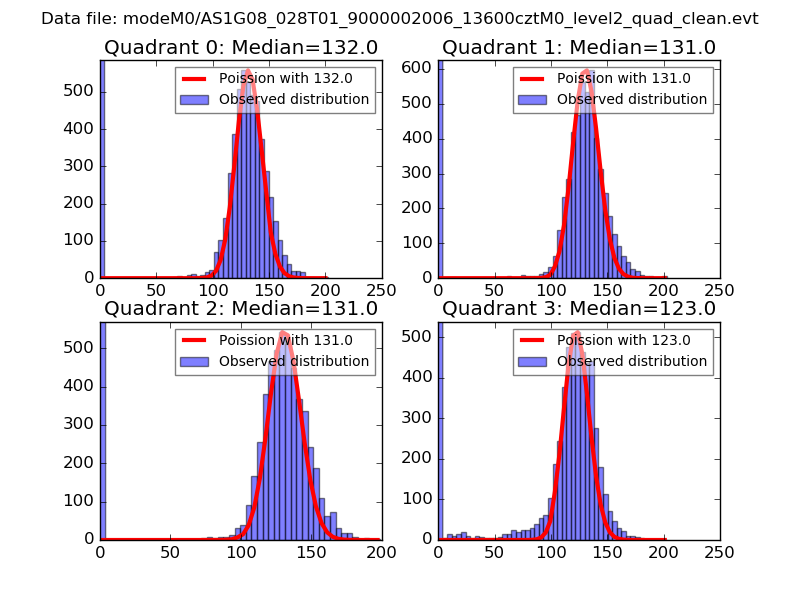
| Comparison with Poisson distribution Blue bars denote a histogram of data divided into 1 sec bins. Red curve is a Poisson curve with rate = median count rate of data. |
 |
 |
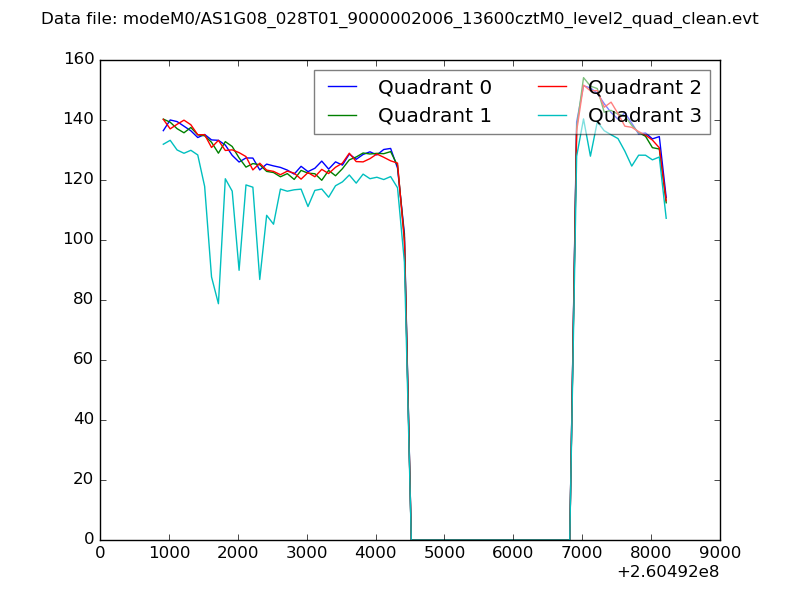
| Quadrant-wise count rates Data is divided into 100 sec bins |
 |
|
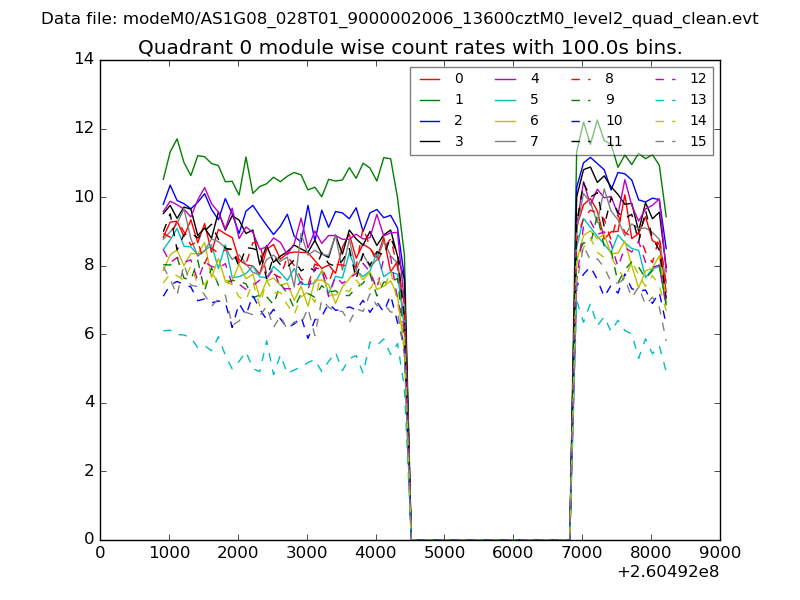
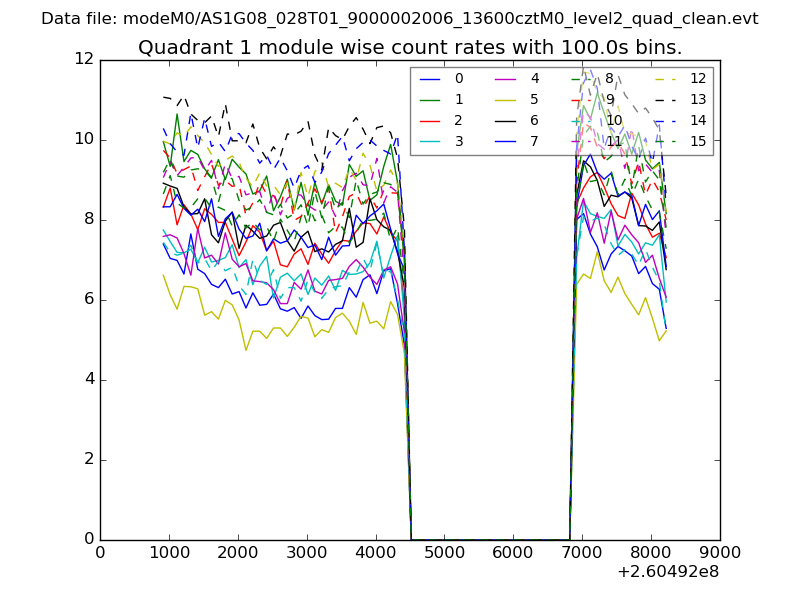
| Module-wise count rates for Quadrant A Data is divided into 100 sec bins |
 |
 |
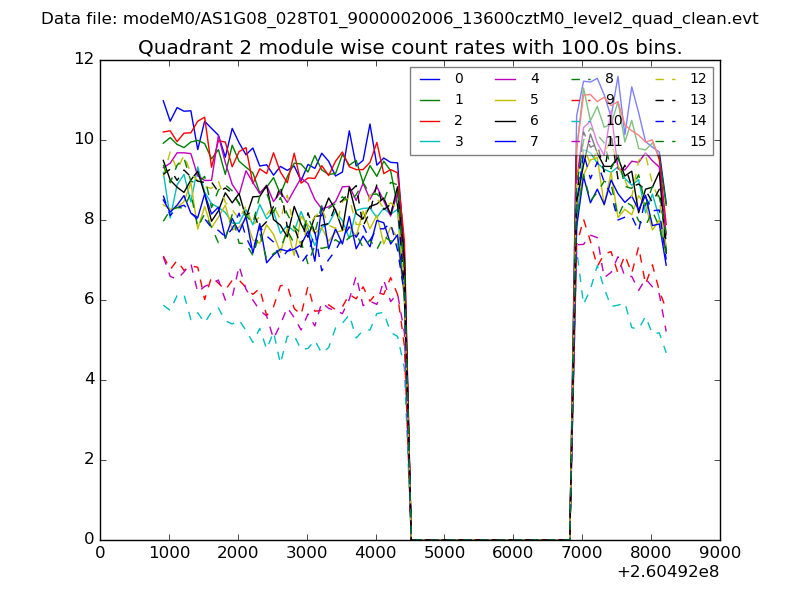
| Module-wise count rates for Quadrant B Data is divided into 100 sec bins |
 |
 |
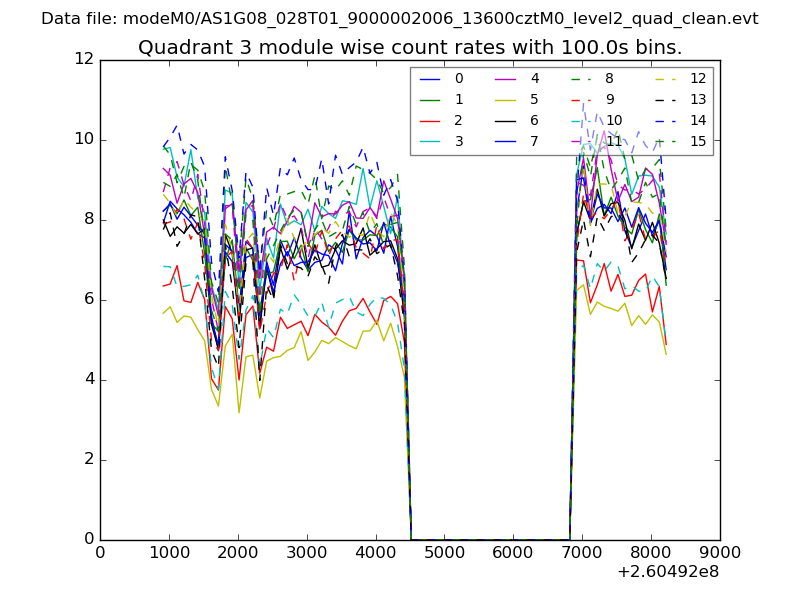
| Module-wise count rates for Quadrant C Data is divided into 100 sec bins |
 |
 |
| Module-wise count rates for Quadrant D Data is divided into 100 sec bins |
 |
 |
| Parameter | Plot |
|---|---|
| CZT HV Monitor | 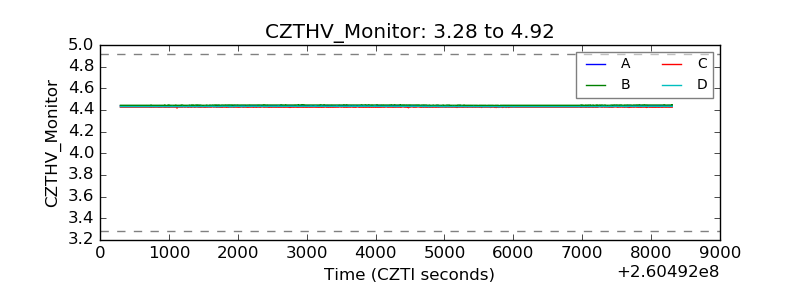 |
| D_VDD | 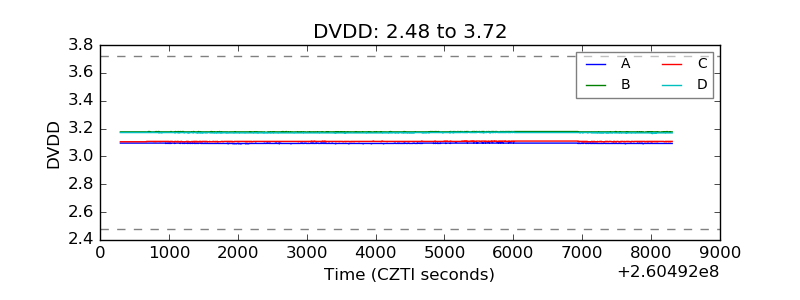 |
| Temperature 1 | 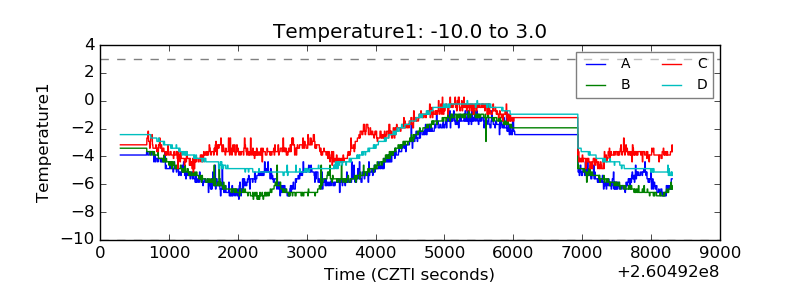 |
| Veto HV Monitor | 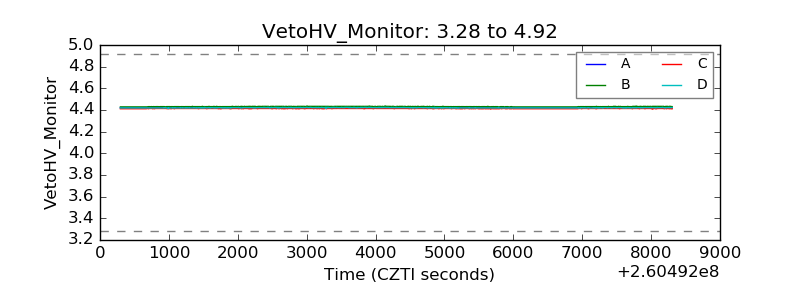 |
| Veto LLD | 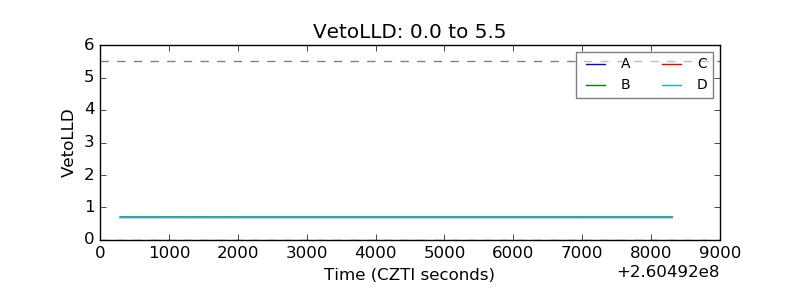 |
| Alpha Counter | 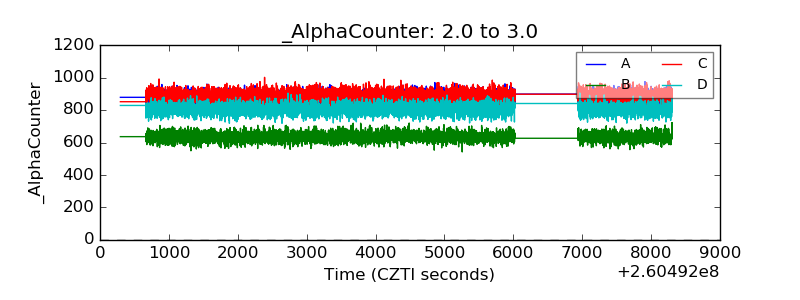 |
| _CPM_Rate | 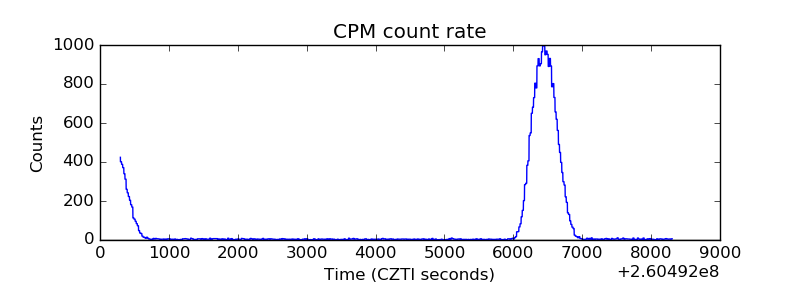 |
| CZT Counter | 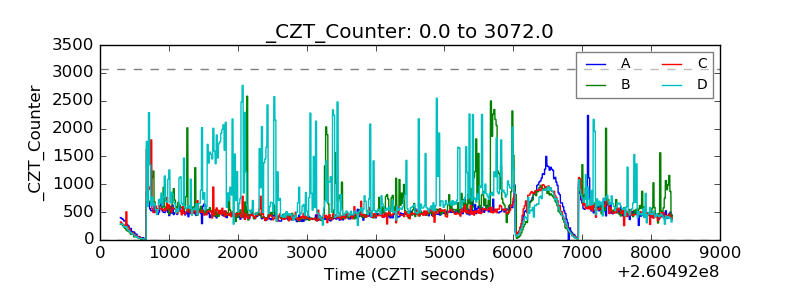 |
| +2.5 Volts monitor | 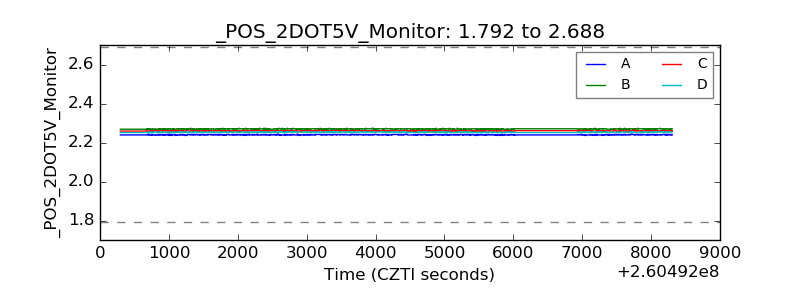 |
| +5 Volts monitor | 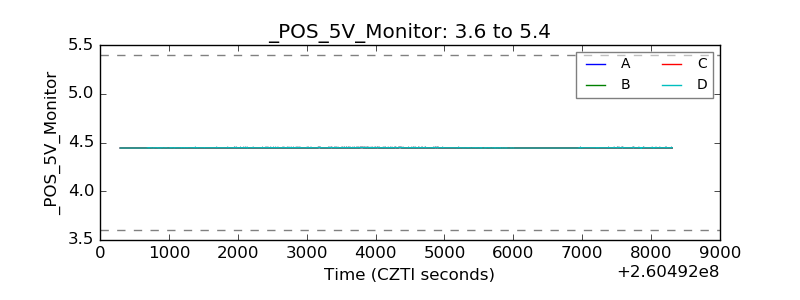 |
| _ROLL_ROT | 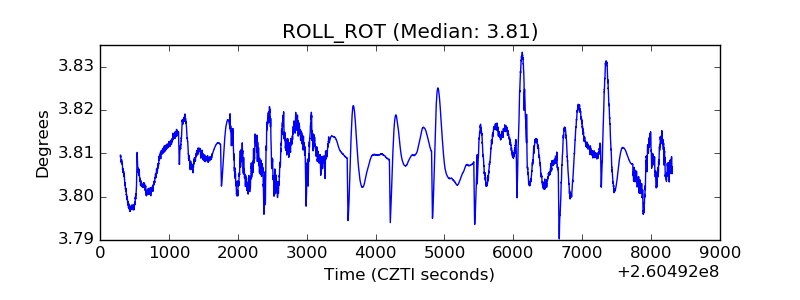 |
| _Roll_DEC | 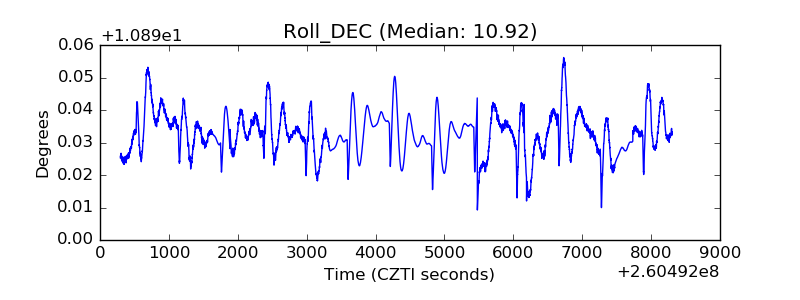 |
| _Roll_RA | 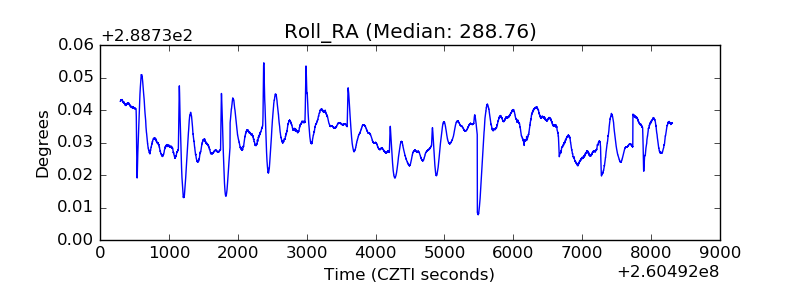 |
| Veto Counter | 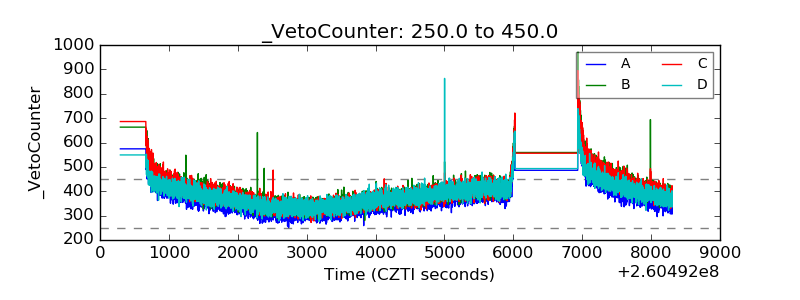 |