| Param | Original file | Final file |
|---|---|---|
| Filename | modeM0/AS1G08_028T01_9000002006_13603cztM0_level2.evt | modeM0/AS1G08_028T01_9000002006_13603cztM0_level2_quad_clean.evt |
| Size (bytes) | 31,279,680 | 8,714,880 |
| Size | 29.8 MB | 8.3 MB |
| Events in quadrant A | 210,395 | 58,328 |
| Events in quadrant B | 222,817 | 60,178 |
| Events in quadrant C | 220,570 | 58,511 |
| Events in quadrant D | 266,050 | 53,605 |
| Mode M9 | |||
|---|---|---|---|
| Quadrant | BADHDUFLAG | Total packets | Discarded packets |
| A | 0 | 2 | 0 |
| B | 0 | 2 | 0 |
| C | 0 | 2 | 0 |
| D | 0 | 3 | 0 |
| Mode SS | |||
|---|---|---|---|
| Quadrant | BADHDUFLAG | Total packets | Discarded packets |
| A | 0 | 6 | 0 |
| B | 0 | 6 | 0 |
| C | 0 | 6 | 0 |
| D | 0 | 6 | 0 |
| Mode M0 | |||
|---|---|---|---|
| Quadrant | BADHDUFLAG | Total packets | Discarded packets |
| A | 0 | 845 | 1 |
| B | 0 | 921 | 1 |
| C | 0 | 890 | 1 |
| D | 0 | 1044 | 1 |
| Quadrant | Total seconds | Saturated seconds | Saturation percentage |
|---|---|---|---|
| A | 354 | 4 | 1.129944% |
| B | 354 | 12 | 3.389831% |
| C | 354 | 3 | 0.847458% |
| D | 354 | 11 | 3.107345% |
Noise dominated data is calculated using 1-second bins in cleaned event files. If a bin has >2000 counts, and if more than 50% of those come from <1% of pixels, then it is considered to be noise-dominated and hence unusable.
| Quadrant | # 1 sec bins | Bins with >0 counts | Bins with >2000 counts | High rate bins dominated by noise | Noise dominated (total time) | Noise dominated (detector-on time) | Marked lightcurve |
|---|---|---|---|---|---|---|---|
| A | 355 | 355 | 0 | 0 | 0.00% | 0.00% | 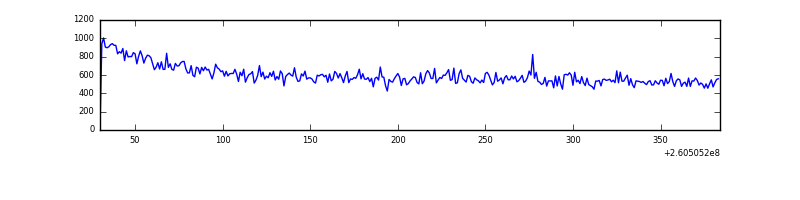 |
| B | 355 | 355 | 0 | 0 | 0.00% | 0.00% | 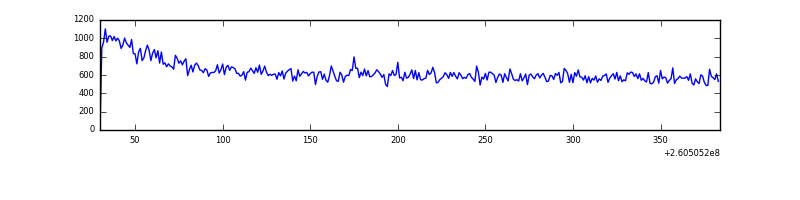 |
| C | 355 | 355 | 0 | 0 | 0.00% | 0.00% | 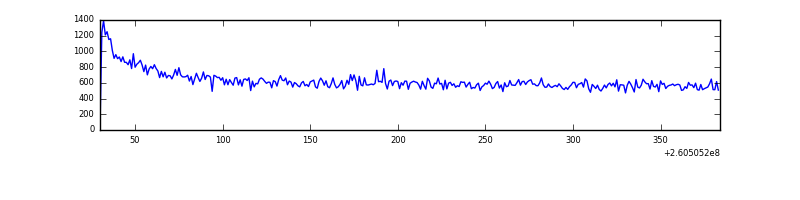 |
| D | 355 | 355 | 6 | 6 | 1.69% | 1.69% | 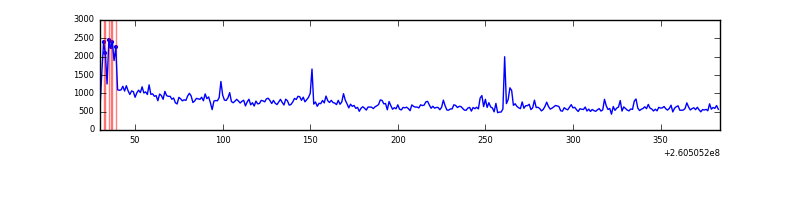 |
Top three noisy pixels from each quadrant. If the there are fewer than three noisy pixels in the level2.evt file, extra rows are filled as -1
| Pixel properties | Quadrant properties | ||||||
|---|---|---|---|---|---|---|---|
| Quadrant | DetID | PixID | Counts | Sigma | Mean | Median | Sigma |
| A | 0 | 226 | 497 | 33.0 | 54 | 53 | 13.5 |
| A | 12 | 194 | 425 | 27.65 | 54 | 53 | 13.5 |
| A | 15 | 69 | 392 | 25.2 | 54 | 53 | 13.5 |
| B | 0 | 219 | 2071 | 155.57 | 55 | 54 | 13.0 |
| B | 12 | 111 | 1195 | 88.01 | 55 | 54 | 13.0 |
| B | 4 | 142 | 1027 | 75.05 | 55 | 54 | 13.0 |
| C | 3 | 233 | 9520 | 650.76 | 54 | 54 | 14.5 |
| C | 13 | 61 | 371 | 21.79 | 54 | 54 | 14.5 |
| C | 0 | 207 | 138 | 5.77 | 54 | 54 | 14.5 |
| D | 13 | 122 | 53937 | 3749.94 | 50 | 49 | 14.4 |
| D | 5 | 222 | 5642 | 389.2 | 50 | 49 | 14.4 |
| D | 13 | 249 | 5333 | 367.7 | 50 | 49 | 14.4 |
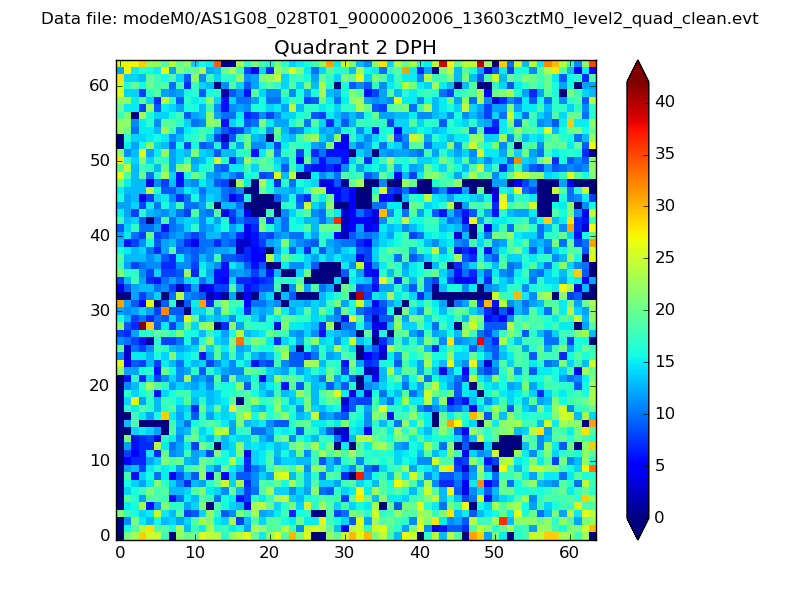
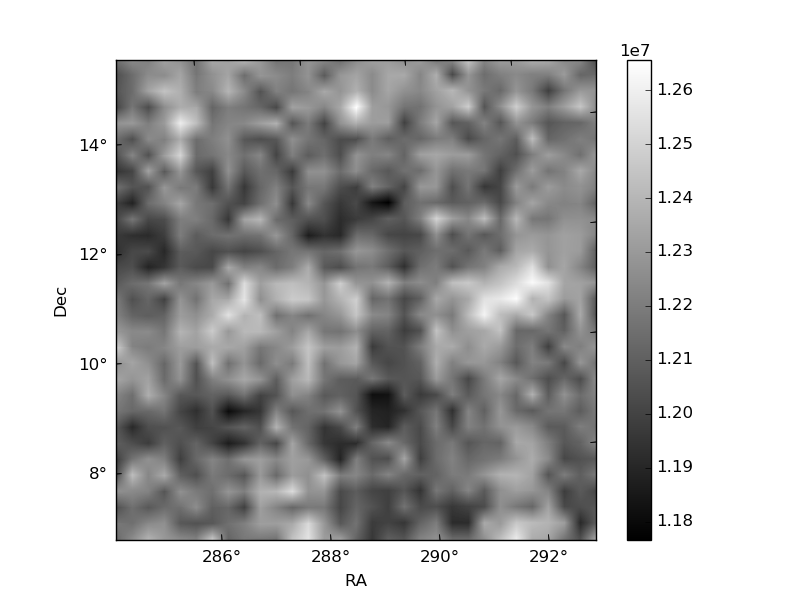
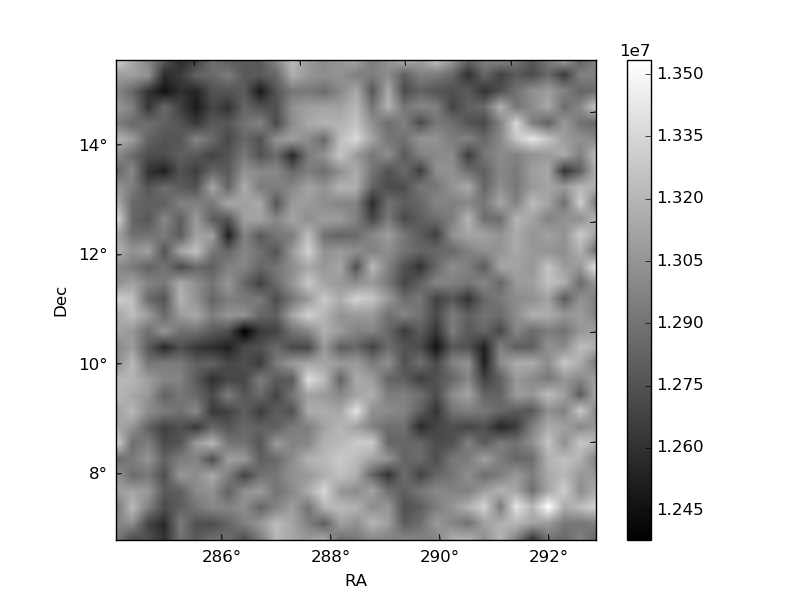
Histogram calculated using DETX and DETY for each event in the final _common_clean file
| Quadrant A | 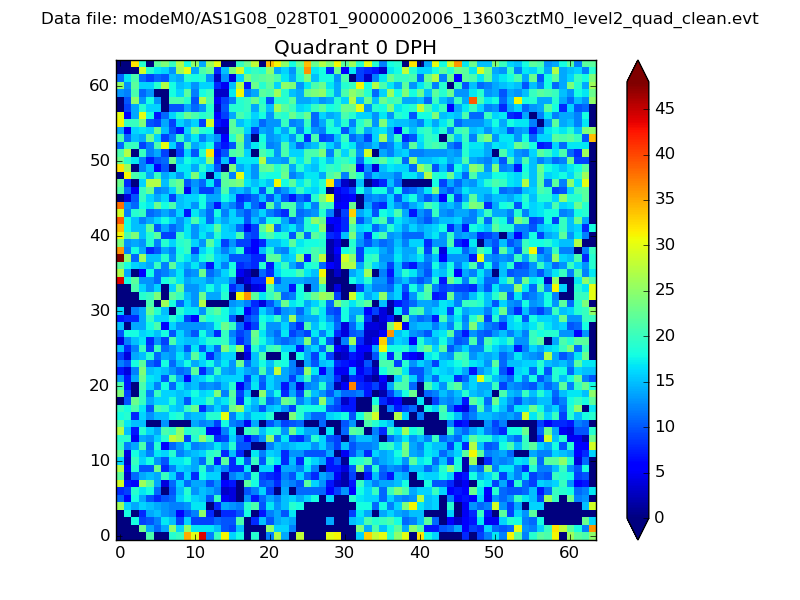 |
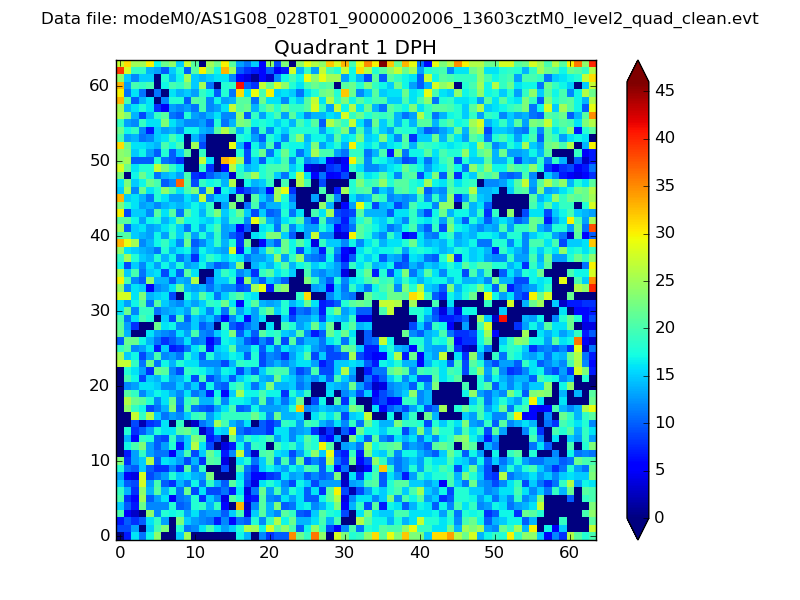 |
Quadrant B |
|---|---|---|---|
| Quadrant D | 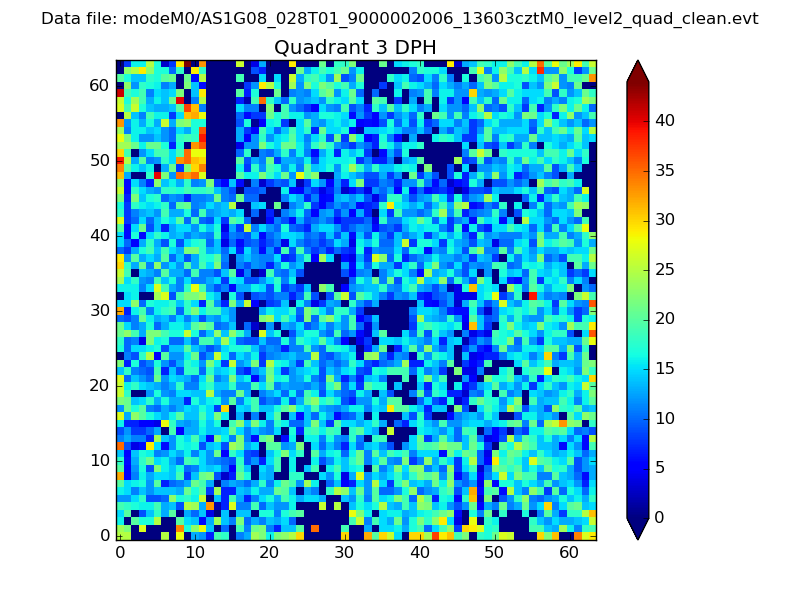 |
 |
Quadrant C |
| Plot type | Count rate plots | Images |
|---|---|---|
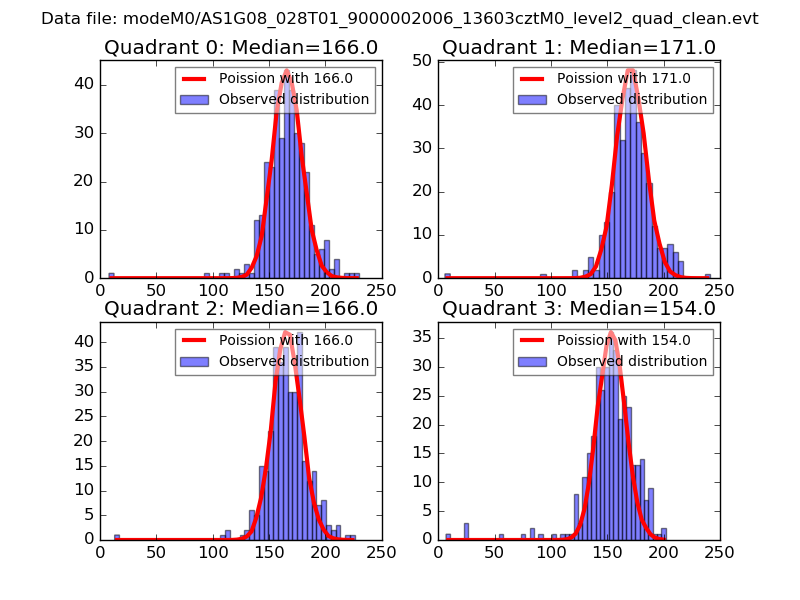
| Comparison with Poisson distribution Blue bars denote a histogram of data divided into 1 sec bins. Red curve is a Poisson curve with rate = median count rate of data. |
 |
 |
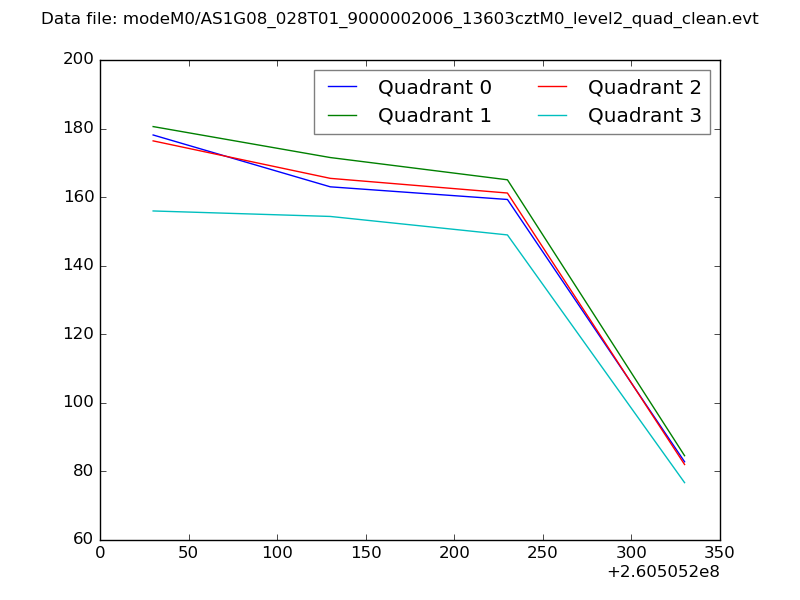
| Quadrant-wise count rates Data is divided into 100 sec bins |
 |
|
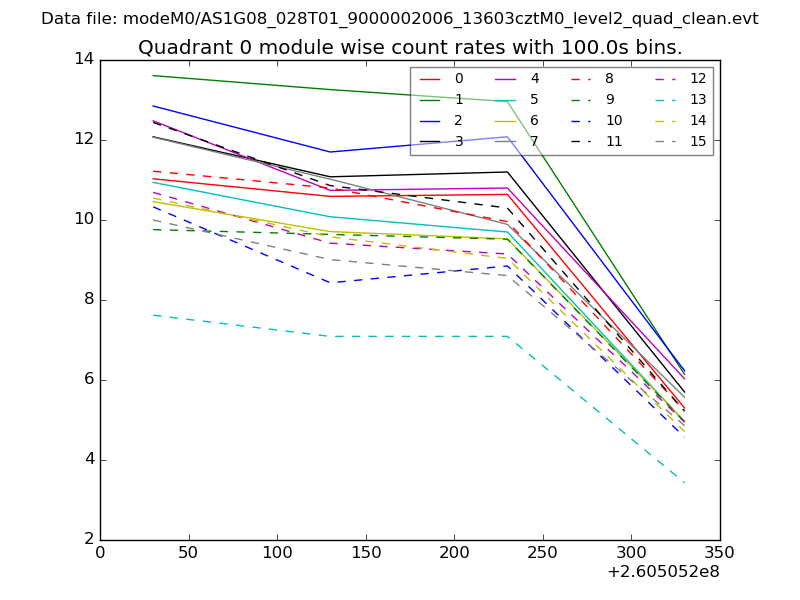
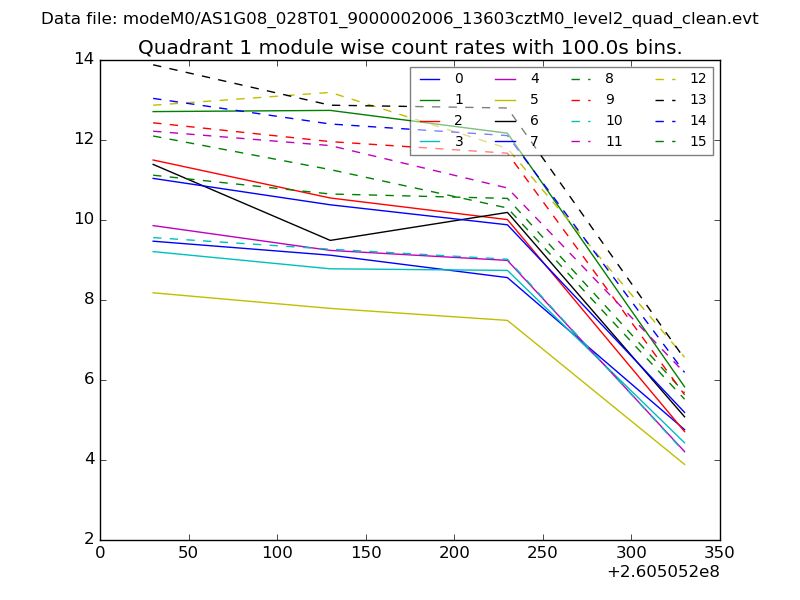
| Module-wise count rates for Quadrant A Data is divided into 100 sec bins |
 |
 |
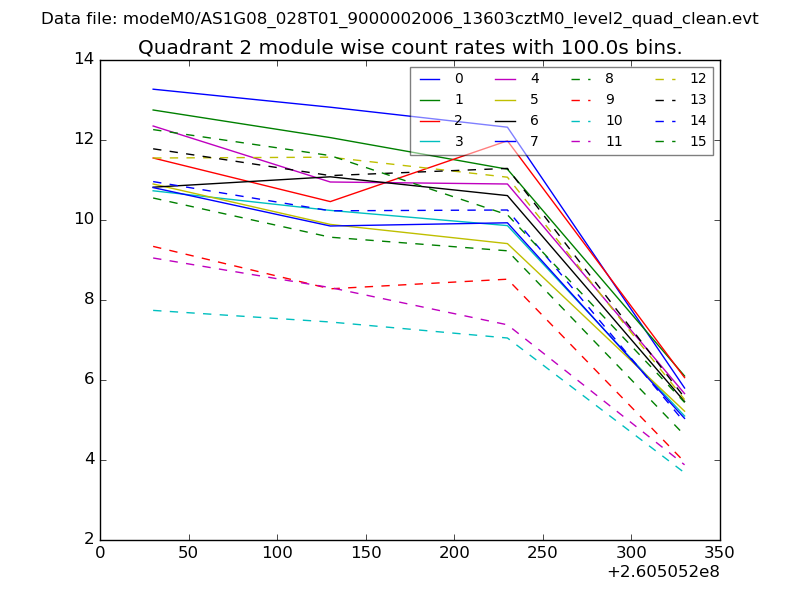
| Module-wise count rates for Quadrant B Data is divided into 100 sec bins |
 |
 |
| Module-wise count rates for Quadrant C Data is divided into 100 sec bins |
 |
 |
| Module-wise count rates for Quadrant D Data is divided into 100 sec bins |
 |
 |
| Parameter | Plot |
|---|---|
| CZT HV Monitor | 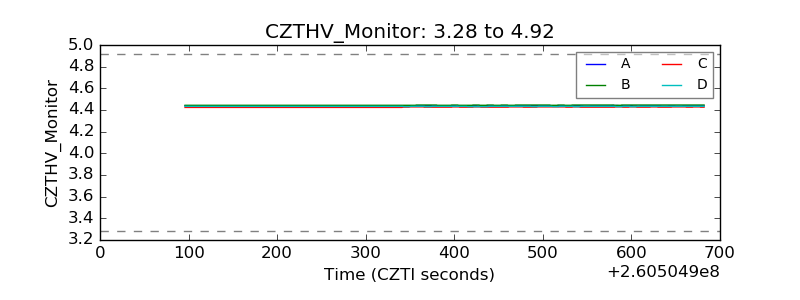 |
| D_VDD | 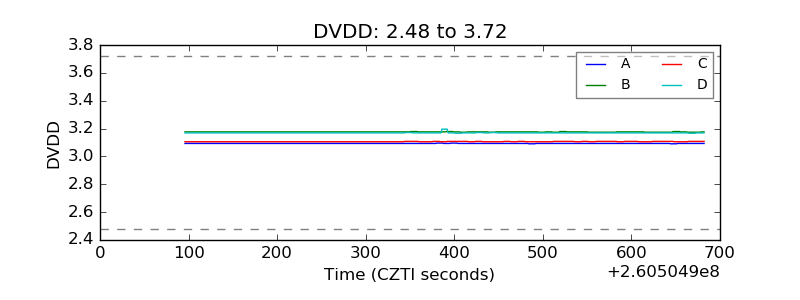 |
| Temperature 1 | 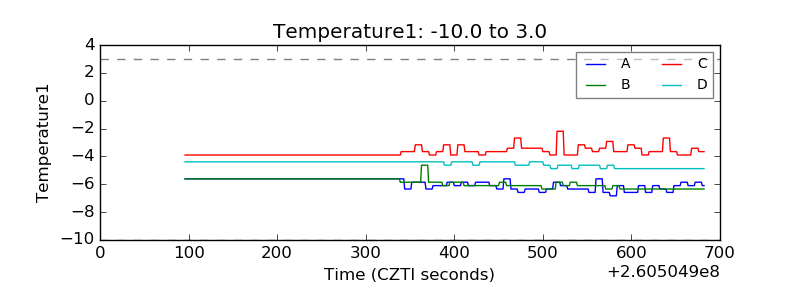 |
| Veto HV Monitor | 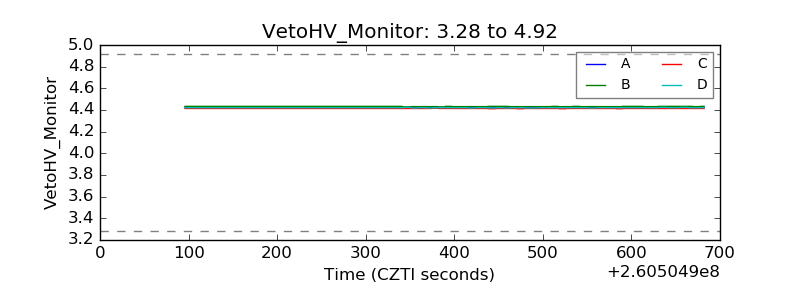 |
| Veto LLD | 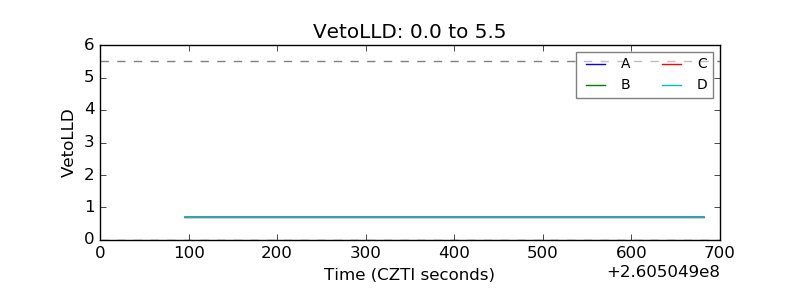 |
| Alpha Counter | 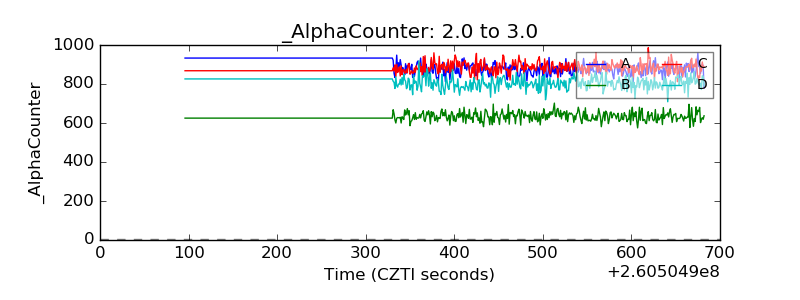 |
| _CPM_Rate | 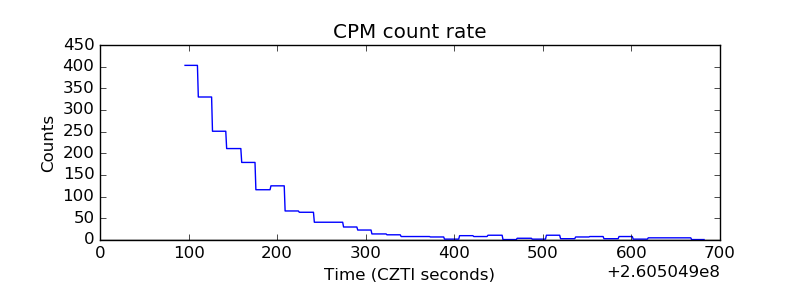 |
| CZT Counter | 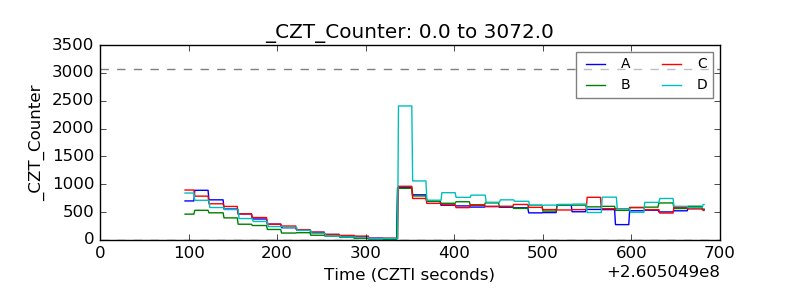 |
| +2.5 Volts monitor |  |
| +5 Volts monitor |  |
| _ROLL_ROT | 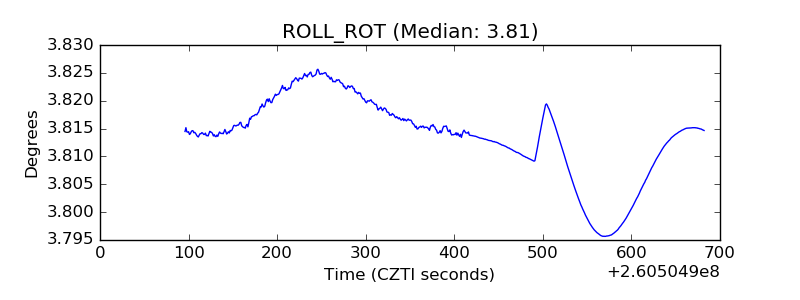 |
| _Roll_DEC | 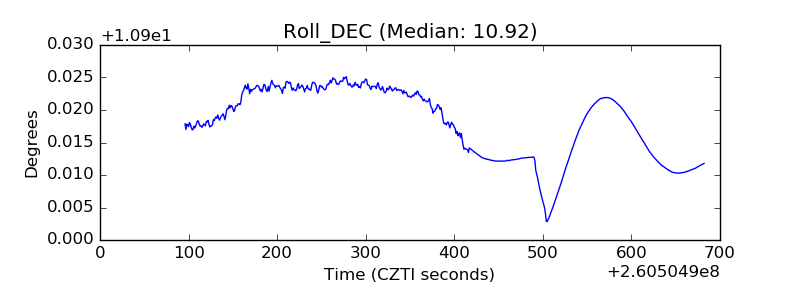 |
| _Roll_RA | 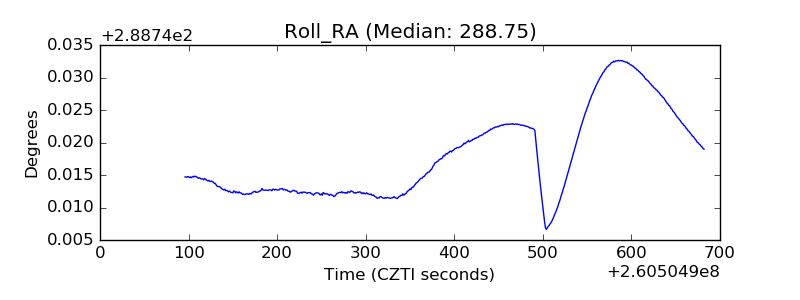 |
| Veto Counter | 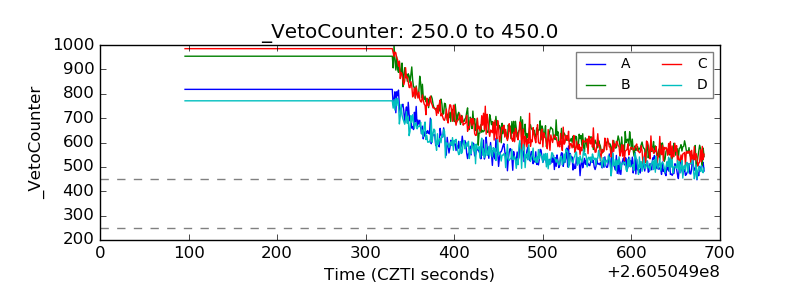 |