| Param | Original file | Final file |
|---|---|---|
| Filename | modeM0/AS1A04_012T01_9000002012cztM0_level2.fits | modeM0/AS1A04_012T01_9000002012cztM0_level2_quad_clean.evt |
| Size (bytes) | 191,687,040 | 175,320,000 |
| Size | 182.8 MB | 167.2 MB |
| Events in quadrant A | 1,163,412 | 1,030,681 |
| Events in quadrant B | 1,109,628 | 1,007,429 |
| Events in quadrant C | 1,133,634 | 972,908 |
| Events in quadrant D | 968,292 | 867,549 |
| Mode M0 | |||
|---|---|---|---|
| Quadrant | BADHDUFLAG | Total packets | Discarded packets |
| A | 0 | 42865 | 0 |
| B | 0 | 45933 | 0 |
| C | 0 | 42974 | 0 |
| D | 0 | 53592 | 0 |
| Mode M9 | |||
|---|---|---|---|
| Quadrant | BADHDUFLAG | Total packets | Discarded packets |
| A | 0 | 23 | 0 |
| B | 0 | 23 | 0 |
| C | 0 | 23 | 0 |
| D | 0 | 23 | 0 |
| Mode SS | |||
|---|---|---|---|
| Quadrant | BADHDUFLAG | Total packets | Discarded packets |
| A | 0 | 424 | 0 |
| B | 0 | 424 | 0 |
| C | 0 | 424 | 0 |
| D | 0 | 424 | 0 |
| Quadrant | Total seconds | Saturated seconds | Saturation percentage |
|---|---|---|---|
| A | 20768 | 182 | 0.876348% |
| B | 20768 | 333 | 1.603428% |
| C | 20768 | 135 | 0.650039% |
| D | 20768 | 798 | 3.842450% |
Noise dominated data is calculated using 1-second bins in cleaned event files. If a bin has >2000 counts, and if more than 50% of those come from <1% of pixels, then it is considered to be noise-dominated and hence unusable.
| Quadrant | # 1 sec bins | Bins with >0 counts | Bins with >2000 counts | High rate bins dominated by noise | Noise dominated (total time) | Noise dominated (detector-on time) | Marked lightcurve |
|---|---|---|---|---|---|---|---|
| A | 23053 | 20769 | 0 | 0 | 0.00% | 0.00% |  |
| B | 23053 | 20767 | 0 | 0 | 0.00% | 0.00% |  |
| C | 23052 | 20767 | 0 | 0 | 0.00% | 0.00% |  |
| D | 23053 | 20760 | 0 | 0 | 0.00% | 0.00% |  |
Top three noisy pixels from each quadrant. If the there are fewer than three noisy pixels in the level2.evt file, extra rows are filled as -1
| Pixel properties | Quadrant properties | ||||||
|---|---|---|---|---|---|---|---|
| Quadrant | DetID | PixID | Counts | Sigma | Mean | Median | Sigma |
| A | 14 | 188 | 1099 | 10.43 | 301 | 280 | 78.5 |
| A | 0 | 29 | 1063 | 9.97 | 301 | 280 | 78.5 |
| A | 14 | 204 | 978 | 8.89 | 301 | 280 | 78.5 |
| B | 2 | 9 | 906 | 10.1 | 292 | 277 | 62.3 |
| B | 14 | 254 | 803 | 8.45 | 292 | 277 | 62.3 |
| B | 3 | 17 | 747 | 7.55 | 292 | 277 | 62.3 |
| C | 1 | 80 | 865 | 7.41 | 298 | 277 | 79.4 |
| C | 1 | 81 | 856 | 7.29 | 298 | 277 | 79.4 |
| C | 12 | 241 | 776 | 6.29 | 298 | 277 | 79.4 |
| D | 4 | 160 | 729 | 6.38 | 276 | 251 | 75.0 |
| D | 7 | 3 | 709 | 6.11 | 276 | 251 | 75.0 |
| D | 6 | 231 | 706 | 6.07 | 276 | 251 | 75.0 |
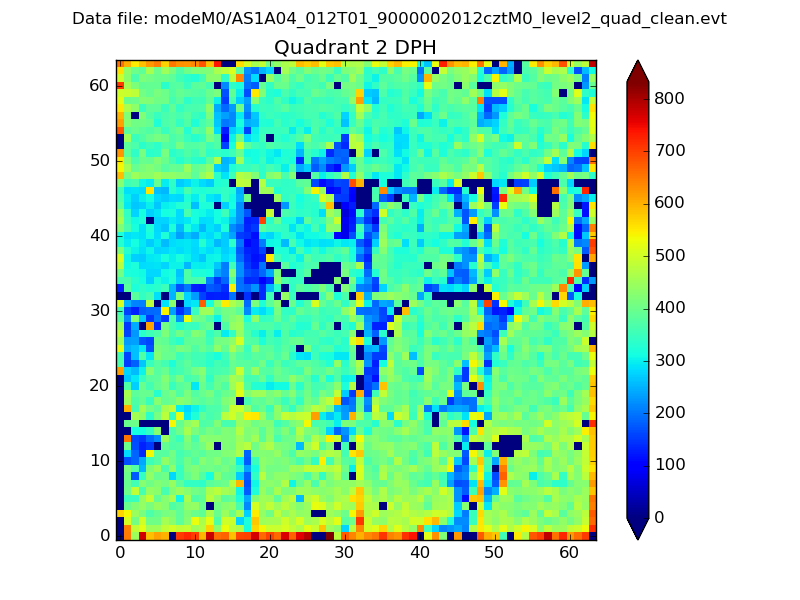
Histogram calculated using DETX and DETY for each event in the final _common_clean file
| Quadrant A |  |
 |
Quadrant B |
|---|---|---|---|
| Quadrant D |  |
 |
Quadrant C |
| Plot type | Count rate plots | Images |
|---|---|---|
| Comparison with Poisson distribution Blue bars denote a histogram of data divided into 1 sec bins. Red curve is a Poisson curve with rate = median count rate of data. |
 |
 |
| Quadrant-wise count rates Data is divided into 100 sec bins |
 |
|
| Module-wise count rates for Quadrant A Data is divided into 100 sec bins |
 |
 |
| Module-wise count rates for Quadrant B Data is divided into 100 sec bins |
 |
 |
| Module-wise count rates for Quadrant C Data is divided into 100 sec bins |
 |
 |
| Module-wise count rates for Quadrant D Data is divided into 100 sec bins |
 |
 |
| Parameter | Plot |
|---|---|
| CZT HV Monitor |  |
| D_VDD | 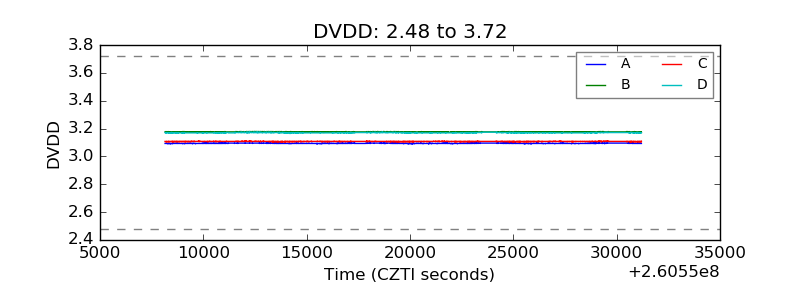 |
| Temperature 1 |  |
| Veto HV Monitor |  |
| Veto LLD | 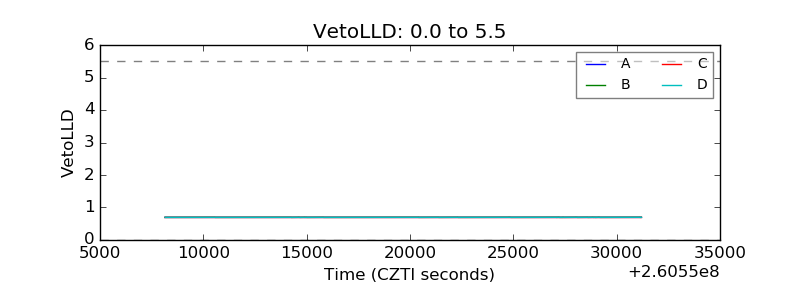 |
| Alpha Counter |  |
| _CPM_Rate |  |
| CZT Counter |  |
| +2.5 Volts monitor |  |
| +5 Volts monitor |  |
| _ROLL_ROT |  |
| _Roll_DEC |  |
| _Roll_RA |  |
| Veto Counter |  |