| Param | Original file | Final file |
|---|---|---|
| Filename | modeM0/AS1A04_012T01_9000002012_13611cztM0_level2.evt | modeM0/AS1A04_012T01_9000002012_13611cztM0_level2_quad_clean.evt |
| Size (bytes) | 336,228,480 | 50,607,360 |
| Size | 320.7 MB | 48.3 MB |
| Events in quadrant A | 2,277,343 | 305,494 |
| Events in quadrant B | 2,541,100 | 305,114 |
| Events in quadrant C | 2,364,097 | 303,223 |
| Events in quadrant D | 2,682,349 | 290,582 |
| Mode M0 | |||
|---|---|---|---|
| Quadrant | BADHDUFLAG | Total packets | Discarded packets |
| A | 0 | 9807 | 2 |
| B | 0 | 10497 | 1 |
| C | 0 | 9903 | 1 |
| D | 0 | 10857 | 1 |
| Mode M9 | |||
|---|---|---|---|
| Quadrant | BADHDUFLAG | Total packets | Discarded packets |
| A | 0 | 3 | 0 |
| B | 0 | 3 | 0 |
| C | 0 | 3 | 0 |
| D | 0 | 3 | 0 |
| Mode SS | |||
|---|---|---|---|
| Quadrant | BADHDUFLAG | Total packets | Discarded packets |
| A | 0 | 94 | 0 |
| B | 0 | 94 | 0 |
| C | 0 | 94 | 0 |
| D | 0 | 94 | 0 |
| Quadrant | Total seconds | Saturated seconds | Saturation percentage |
|---|---|---|---|
| A | 4667 | 101 | 2.164131% |
| B | 4667 | 149 | 3.192629% |
| C | 4667 | 76 | 1.628455% |
| D | 4667 | 87 | 1.864153% |
Noise dominated data is calculated using 1-second bins in cleaned event files. If a bin has >2000 counts, and if more than 50% of those come from <1% of pixels, then it is considered to be noise-dominated and hence unusable.
| Quadrant | # 1 sec bins | Bins with >0 counts | Bins with >2000 counts | High rate bins dominated by noise | Noise dominated (total time) | Noise dominated (detector-on time) | Marked lightcurve |
|---|---|---|---|---|---|---|---|
| A | 4923 | 4669 | 0 | 0 | 0.00% | 0.00% | 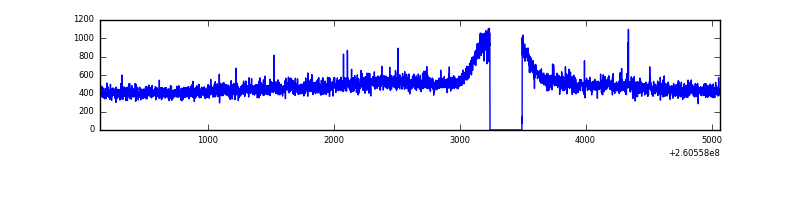 |
| B | 4923 | 4669 | 5 | 5 | 0.10% | 0.11% | 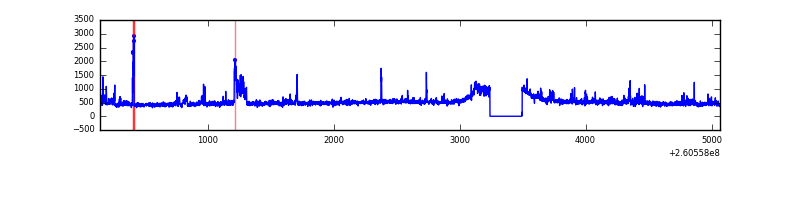 |
| C | 4923 | 4669 | 3 | 3 | 0.06% | 0.06% | 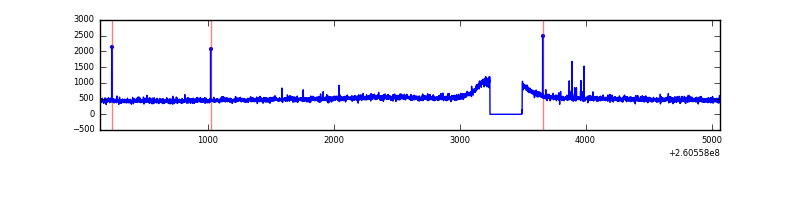 |
| D | 4923 | 4669 | 5 | 5 | 0.10% | 0.11% | 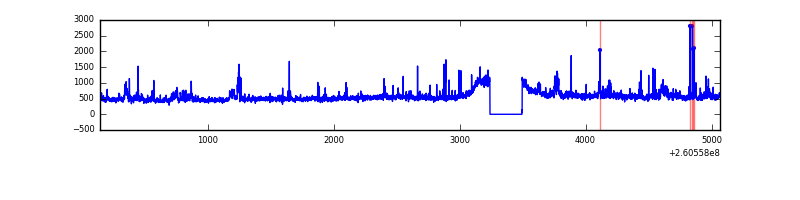 |
Top three noisy pixels from each quadrant. If the there are fewer than three noisy pixels in the level2.evt file, extra rows are filled as -1
| Pixel properties | Quadrant properties | ||||||
|---|---|---|---|---|---|---|---|
| Quadrant | DetID | PixID | Counts | Sigma | Mean | Median | Sigma |
| A | 1 | 162 | 10235 | 78.51 | 588 | 575 | 123.0 |
| A | 0 | 226 | 5415 | 39.34 | 588 | 575 | 123.0 |
| A | 12 | 194 | 4494 | 31.85 | 588 | 575 | 123.0 |
| B | 0 | 219 | 182599 | 1571.41 | 583 | 570 | 115.8 |
| B | 3 | 64 | 25028 | 211.14 | 583 | 570 | 115.8 |
| B | 3 | 209 | 15272 | 126.92 | 583 | 570 | 115.8 |
| C | 3 | 233 | 121942 | 907.84 | 568 | 571 | 133.7 |
| C | 0 | 207 | 14388 | 103.35 | 568 | 571 | 133.7 |
| C | 14 | 234 | 7229 | 49.8 | 568 | 571 | 133.7 |
| D | 8 | 195 | 277880 | 1990.62 | 570 | 553 | 139.3 |
| D | 5 | 222 | 100125 | 714.71 | 570 | 553 | 139.3 |
| D | 12 | 6 | 84997 | 606.13 | 570 | 553 | 139.3 |
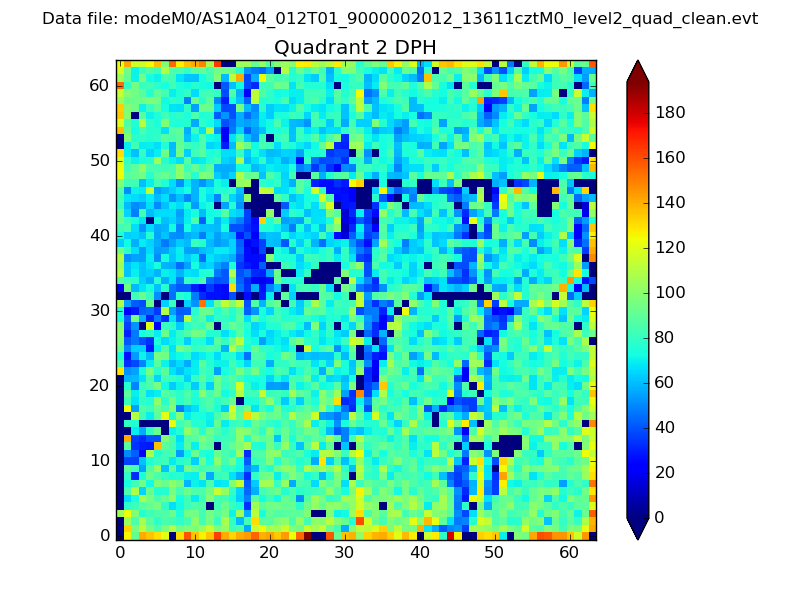
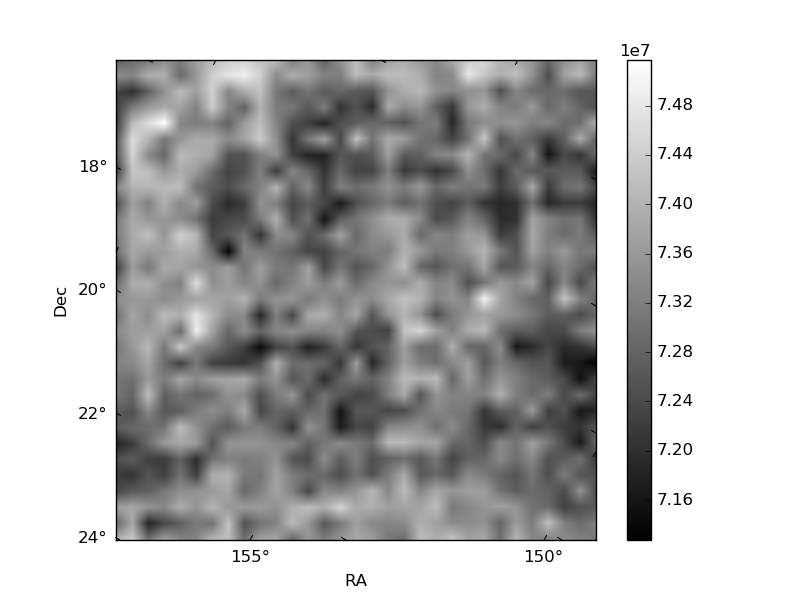
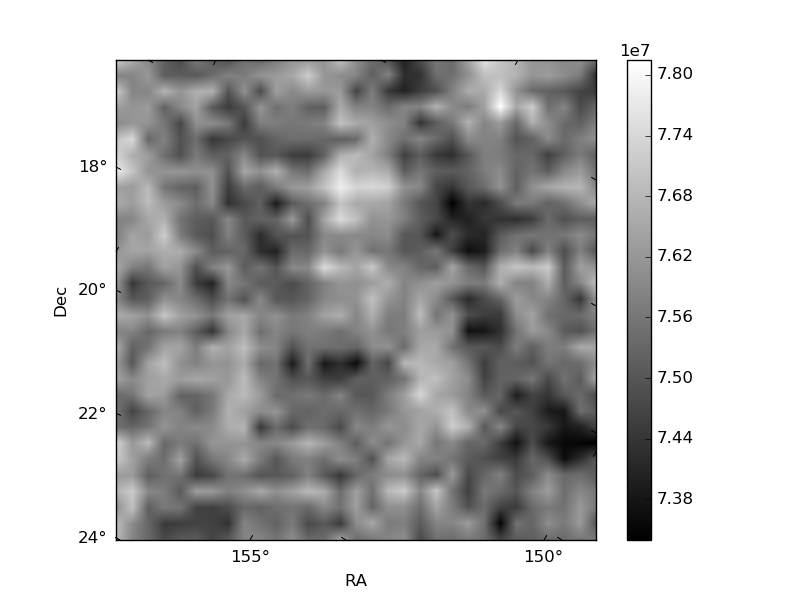
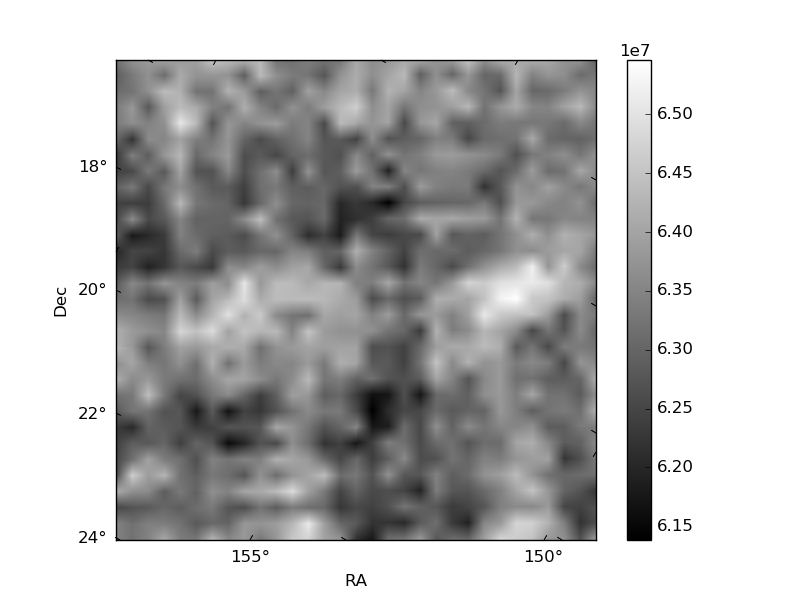
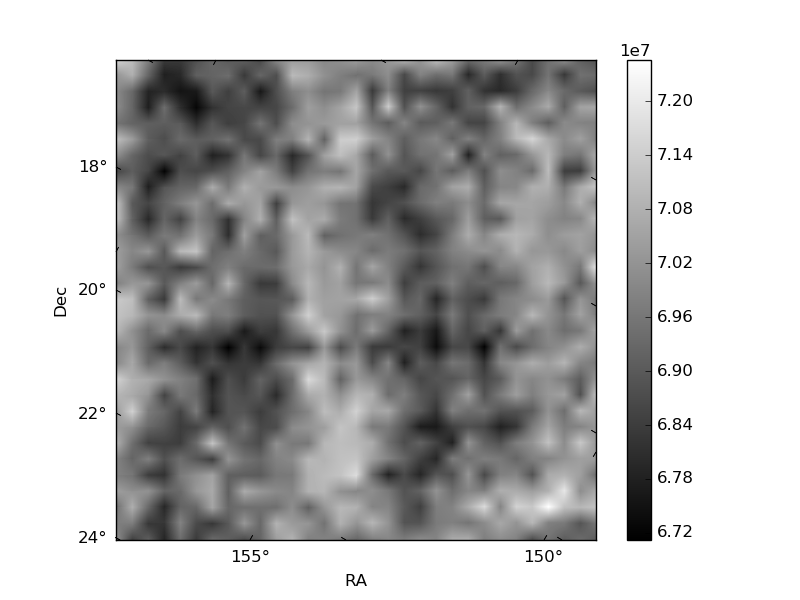
Histogram calculated using DETX and DETY for each event in the final _common_clean file
| Quadrant A | 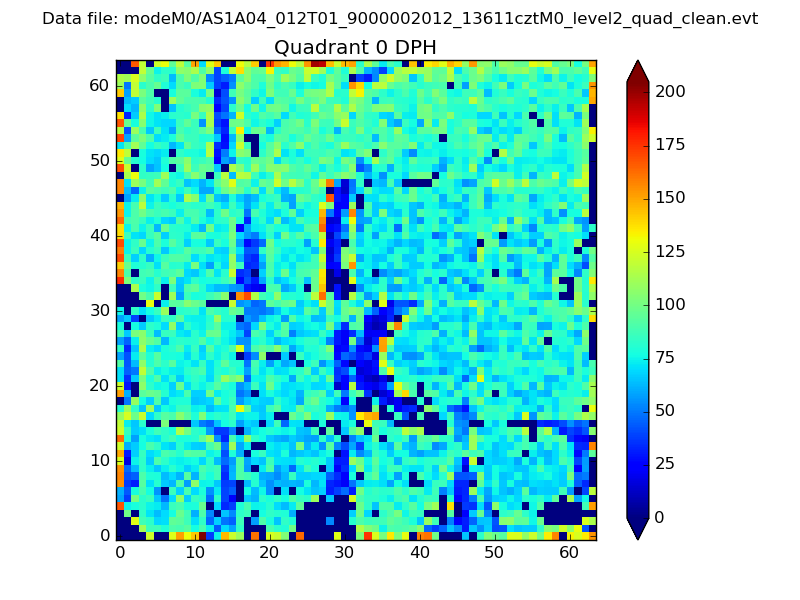 |
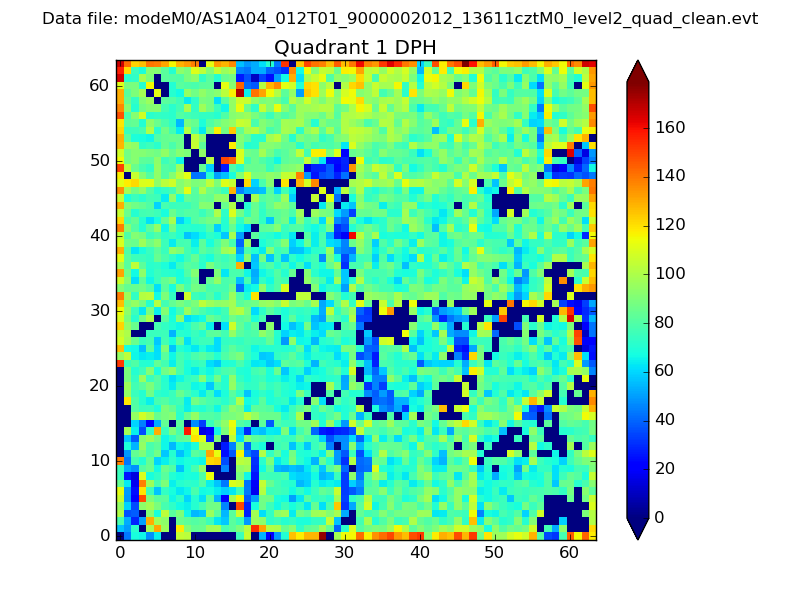 |
Quadrant B |
|---|---|---|---|
| Quadrant D | 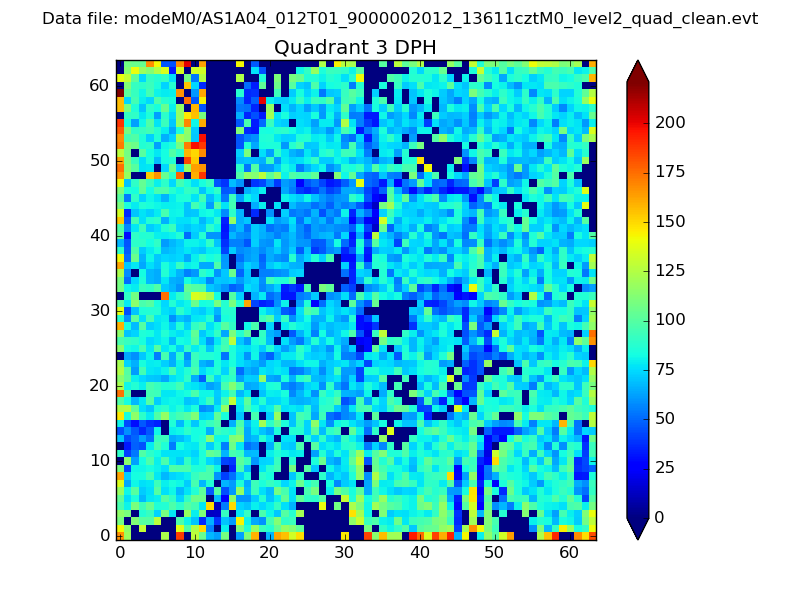 |
 |
Quadrant C |
| Plot type | Count rate plots | Images |
|---|---|---|
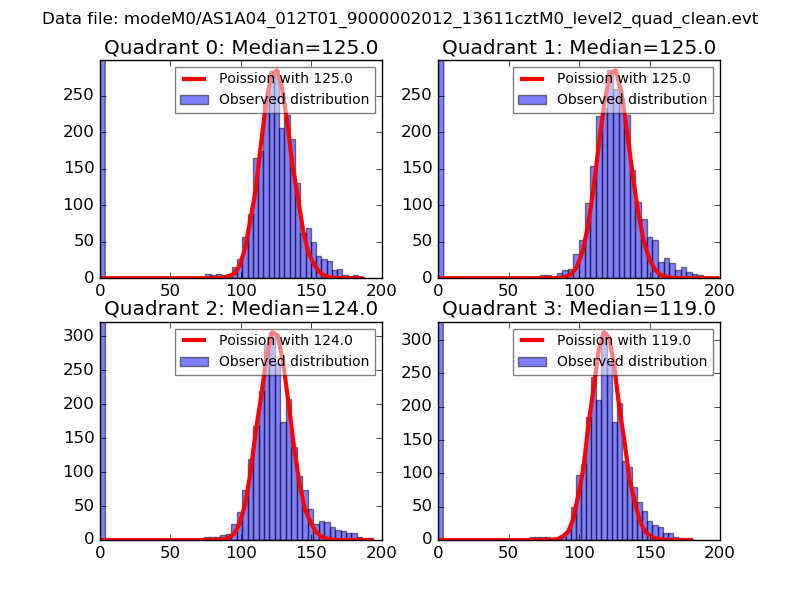
| Comparison with Poisson distribution Blue bars denote a histogram of data divided into 1 sec bins. Red curve is a Poisson curve with rate = median count rate of data. |
 |
 |
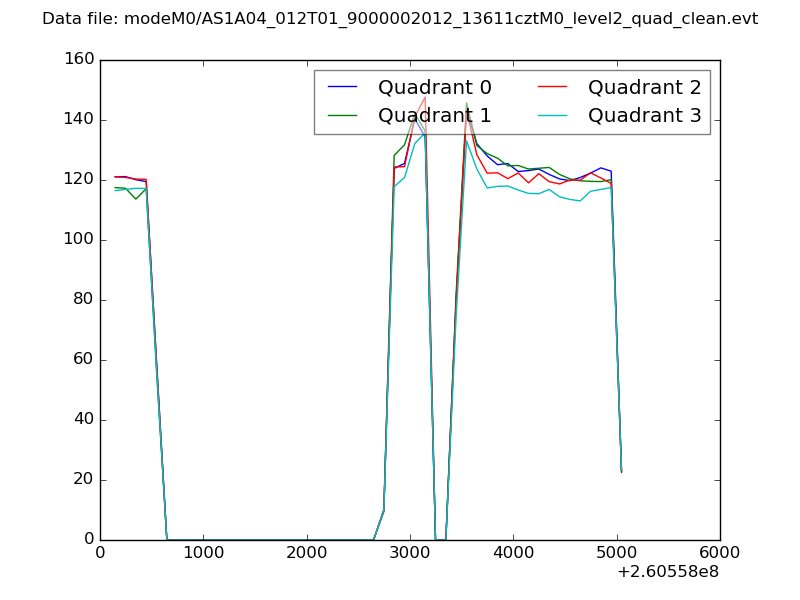
| Quadrant-wise count rates Data is divided into 100 sec bins |
 |
|
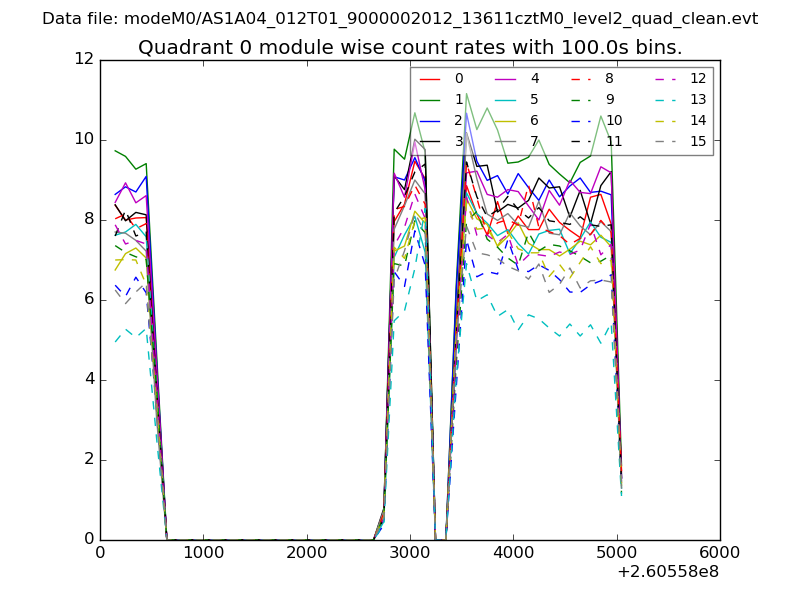
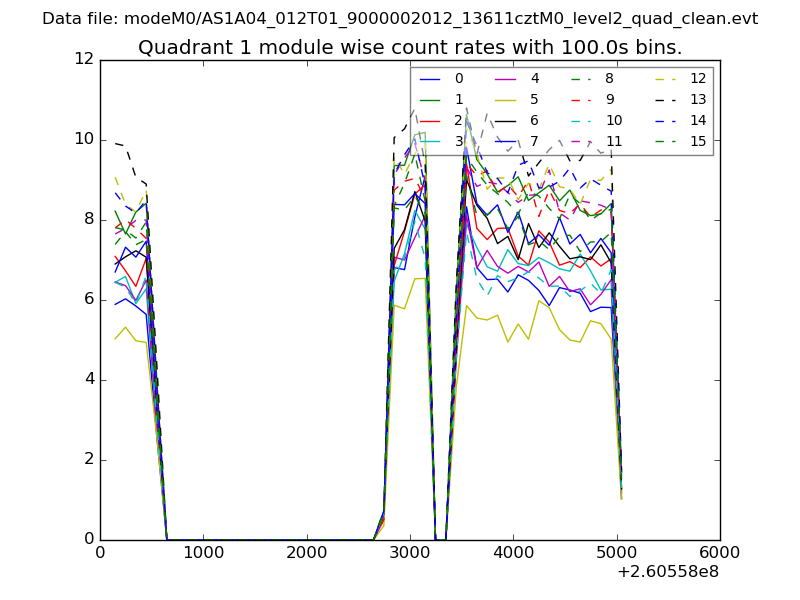
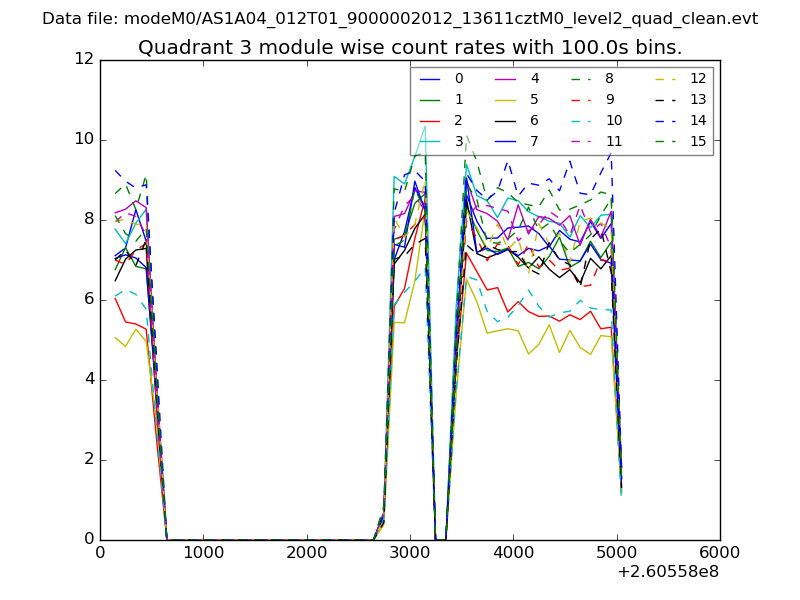
| Module-wise count rates for Quadrant A Data is divided into 100 sec bins |
 |
 |
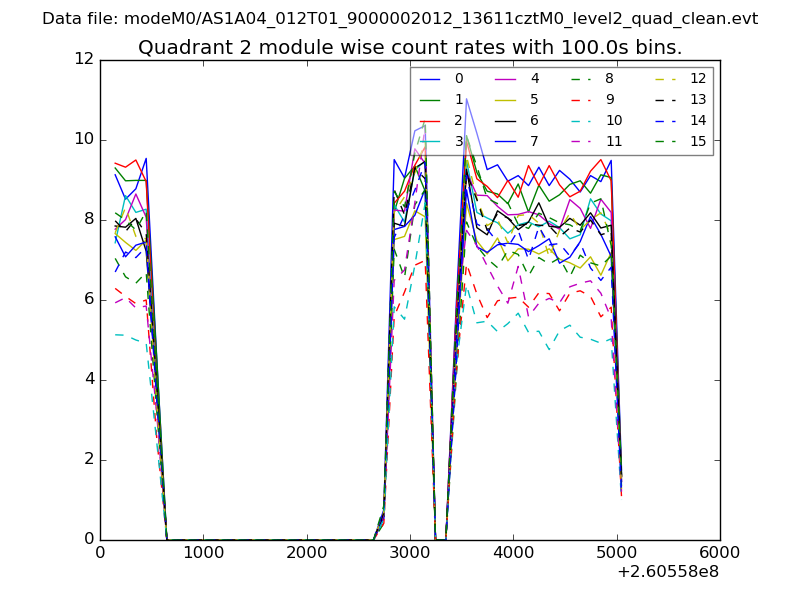
| Module-wise count rates for Quadrant B Data is divided into 100 sec bins |
 |
 |
| Module-wise count rates for Quadrant C Data is divided into 100 sec bins |
 |
 |
| Module-wise count rates for Quadrant D Data is divided into 100 sec bins |
 |
 |
| Parameter | Plot |
|---|---|
| CZT HV Monitor | 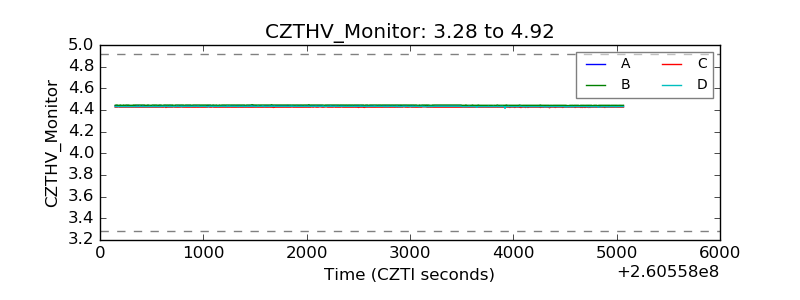 |
| D_VDD | 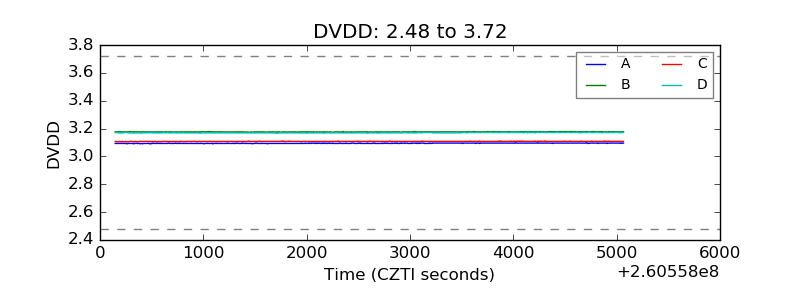 |
| Temperature 1 | 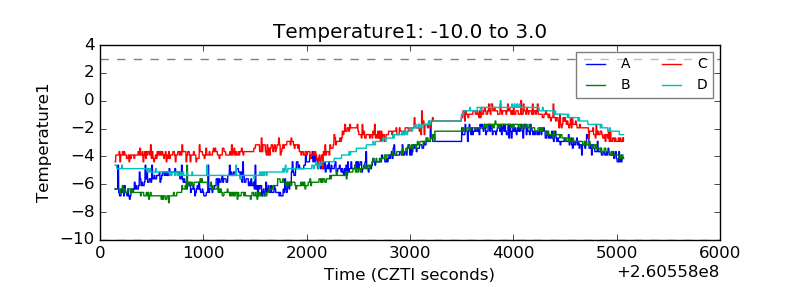 |
| Veto HV Monitor | 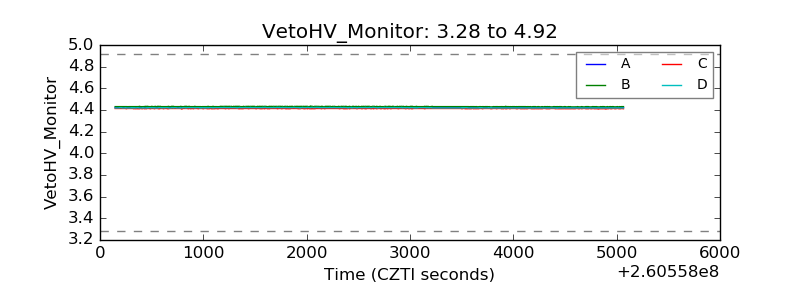 |
| Veto LLD | 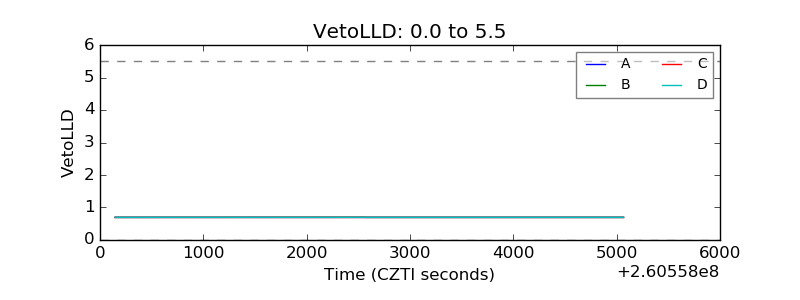 |
| Alpha Counter | 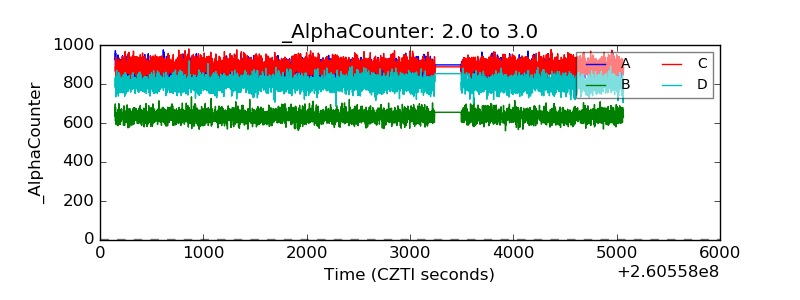 |
| _CPM_Rate | 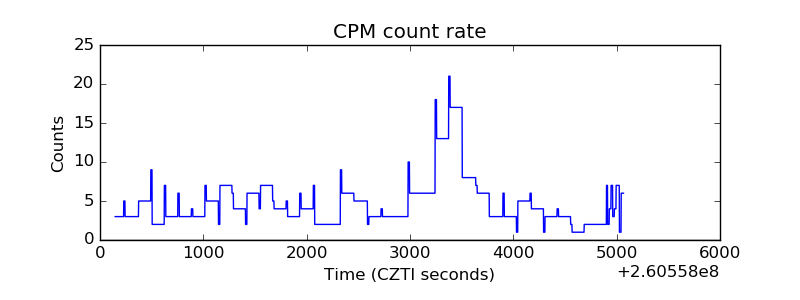 |
| CZT Counter |  |
| +2.5 Volts monitor |  |
| +5 Volts monitor |  |
| _ROLL_ROT | 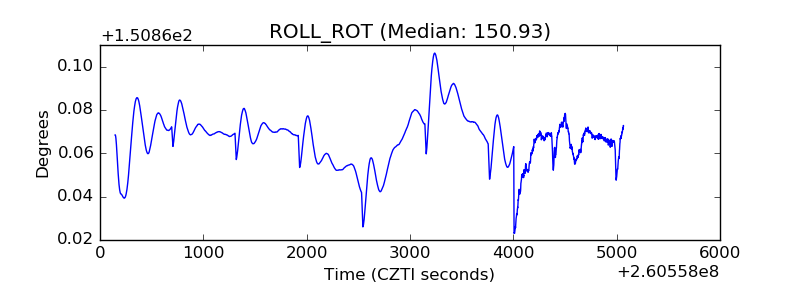 |
| _Roll_DEC | 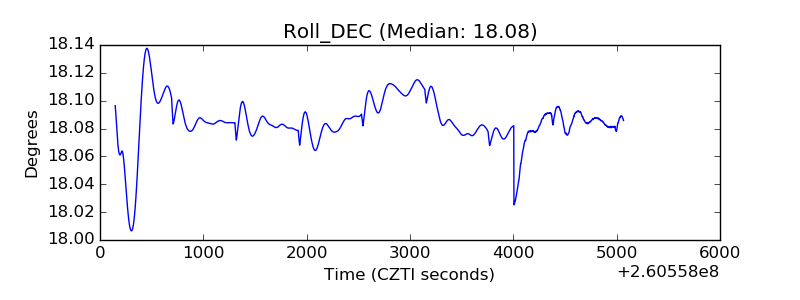 |
| _Roll_RA | 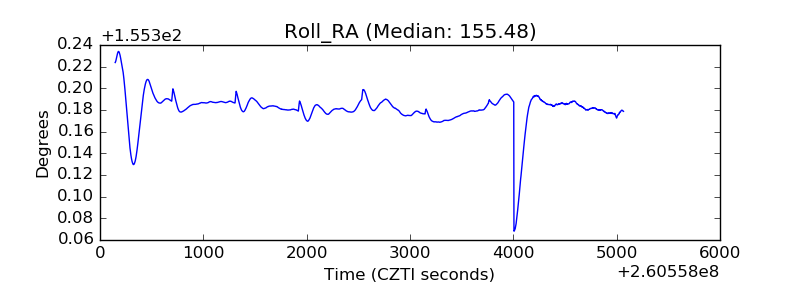 |
| Veto Counter | 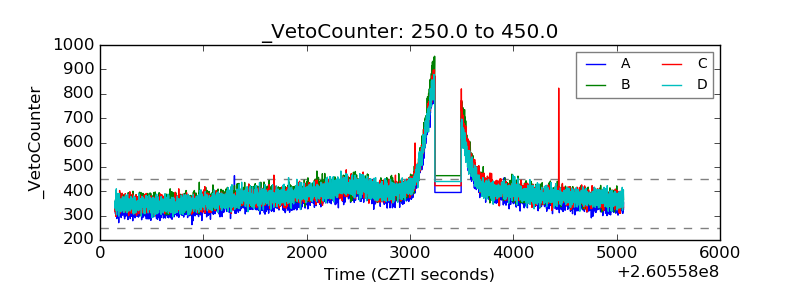 |