| Param | Original file | Final file |
|---|---|---|
| Filename | modeM0/AS1A04_012T01_9000002012_13615cztM0_level2.evt | modeM0/AS1A04_012T01_9000002012_13615cztM0_level2_quad_clean.evt |
| Size (bytes) | 1,286,006,400 | 217,500,480 |
| Size | 1.2 GB | 207.4 MB |
| Events in quadrant A | 8,232,047 | 1,375,181 |
| Events in quadrant B | 9,192,967 | 1,364,555 |
| Events in quadrant C | 8,460,638 | 1,357,122 |
| Events in quadrant D | 11,865,460 | 1,270,556 |
| Mode M0 | |||
|---|---|---|---|
| Quadrant | BADHDUFLAG | Total packets | Discarded packets |
| A | 0 | 36468 | 4 |
| B | 0 | 39037 | 4 |
| C | 0 | 36512 | 4 |
| D | 0 | 46822 | 4 |
| Mode M9 | |||
|---|---|---|---|
| Quadrant | BADHDUFLAG | Total packets | Discarded packets |
| A | 0 | 23 | 0 |
| B | 0 | 23 | 0 |
| C | 0 | 23 | 0 |
| D | 0 | 23 | 0 |
| Mode SS | |||
|---|---|---|---|
| Quadrant | BADHDUFLAG | Total packets | Discarded packets |
| A | 0 | 362 | 0 |
| B | 0 | 362 | 0 |
| C | 0 | 362 | 0 |
| D | 0 | 362 | 0 |
| Quadrant | Total seconds | Saturated seconds | Saturation percentage |
|---|---|---|---|
| A | 17695 | 116 | 0.655552% |
| B | 17695 | 231 | 1.305454% |
| C | 17695 | 92 | 0.519921% |
| D | 17695 | 749 | 4.232834% |
Noise dominated data is calculated using 1-second bins in cleaned event files. If a bin has >2000 counts, and if more than 50% of those come from <1% of pixels, then it is considered to be noise-dominated and hence unusable.
| Quadrant | # 1 sec bins | Bins with >0 counts | Bins with >2000 counts | High rate bins dominated by noise | Noise dominated (total time) | Noise dominated (detector-on time) | Marked lightcurve |
|---|---|---|---|---|---|---|---|
| A | 19981 | 17700 | 6 | 6 | 0.03% | 0.03% | 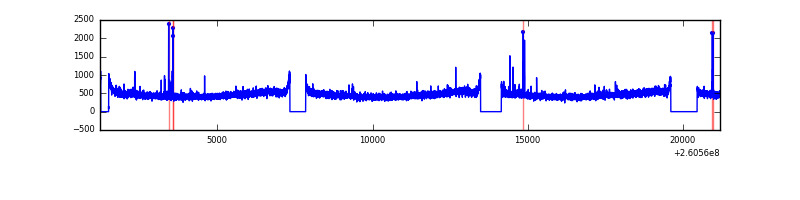 |
| B | 19981 | 17700 | 69 | 69 | 0.35% | 0.39% | 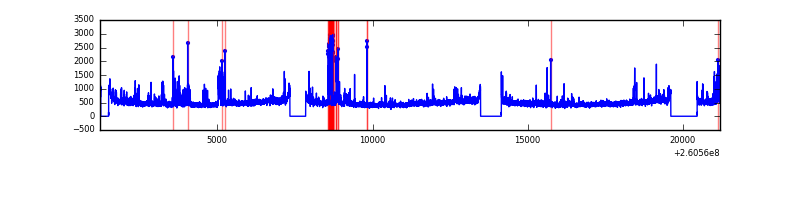 |
| C | 19981 | 17700 | 9 | 9 | 0.05% | 0.05% | 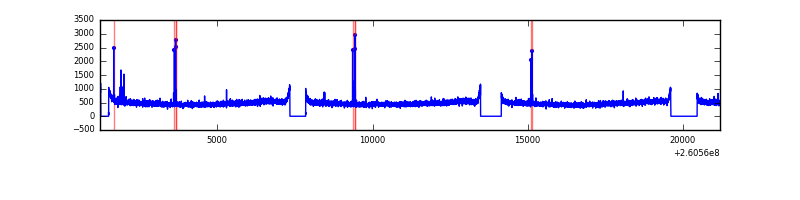 |
| D | 19981 | 17700 | 650 | 650 | 3.25% | 3.67% | 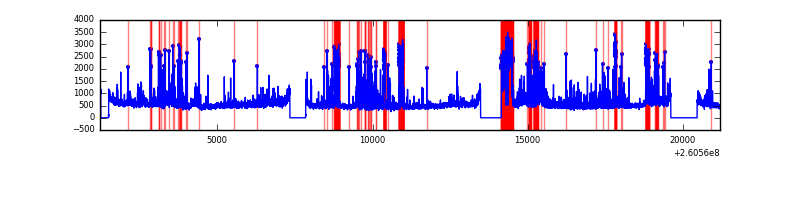 |
Top three noisy pixels from each quadrant. If the there are fewer than three noisy pixels in the level2.evt file, extra rows are filled as -1
| Pixel properties | Quadrant properties | ||||||
|---|---|---|---|---|---|---|---|
| Quadrant | DetID | PixID | Counts | Sigma | Mean | Median | Sigma |
| A | 1 | 162 | 51955 | 116.47 | 2108 | 2064 | 428.4 |
| A | 15 | 69 | 49880 | 111.62 | 2108 | 2064 | 428.4 |
| A | 0 | 226 | 18951 | 39.42 | 2108 | 2064 | 428.4 |
| B | 0 | 219 | 449268 | 1123.64 | 2089 | 2037 | 398.0 |
| B | 3 | 64 | 209586 | 521.46 | 2089 | 2037 | 398.0 |
| B | 10 | 244 | 82161 | 201.31 | 2089 | 2037 | 398.0 |
| C | 3 | 233 | 412932 | 868.68 | 2044 | 2057 | 473.0 |
| C | 14 | 234 | 53198 | 108.12 | 2044 | 2057 | 473.0 |
| C | 0 | 207 | 15669 | 28.78 | 2044 | 2057 | 473.0 |
| D | 5 | 222 | 3035621 | 6205.99 | 2011 | 1954 | 488.8 |
| D | 8 | 195 | 793382 | 1619.03 | 2011 | 1954 | 488.8 |
| D | 13 | 249 | 271427 | 551.26 | 2011 | 1954 | 488.8 |
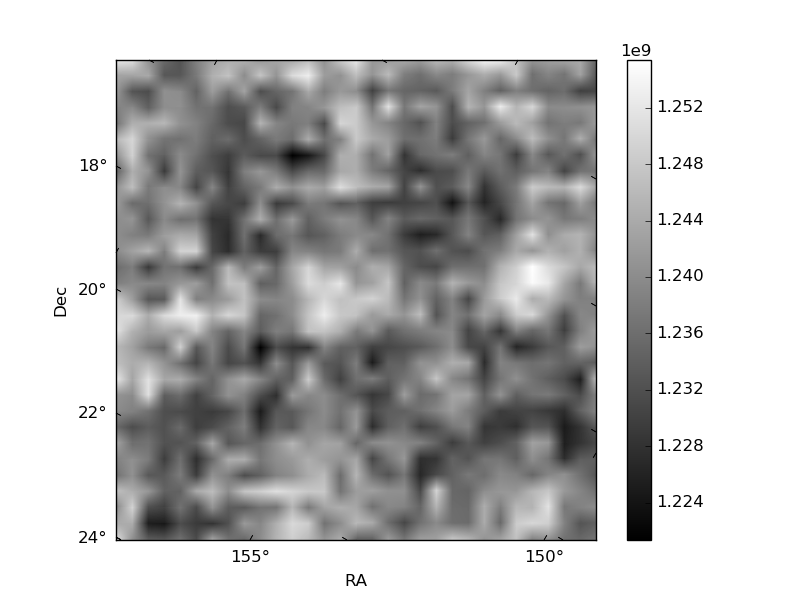
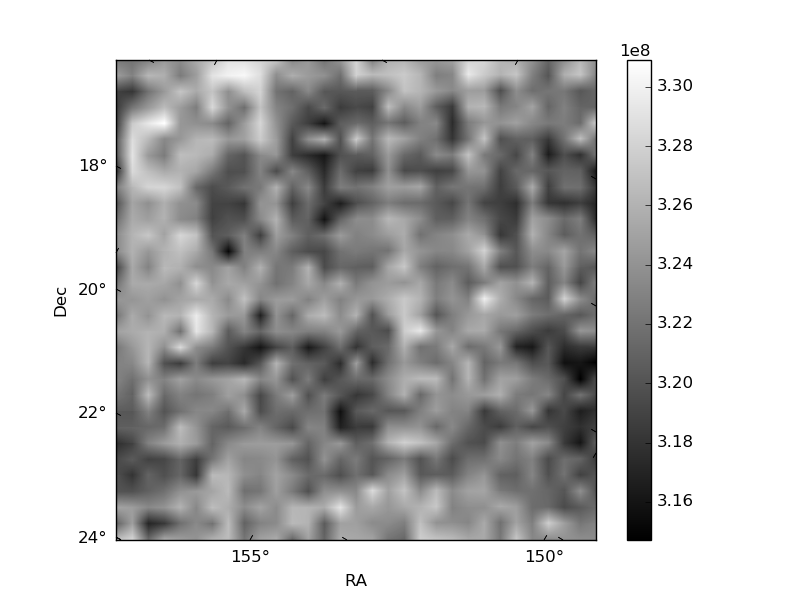
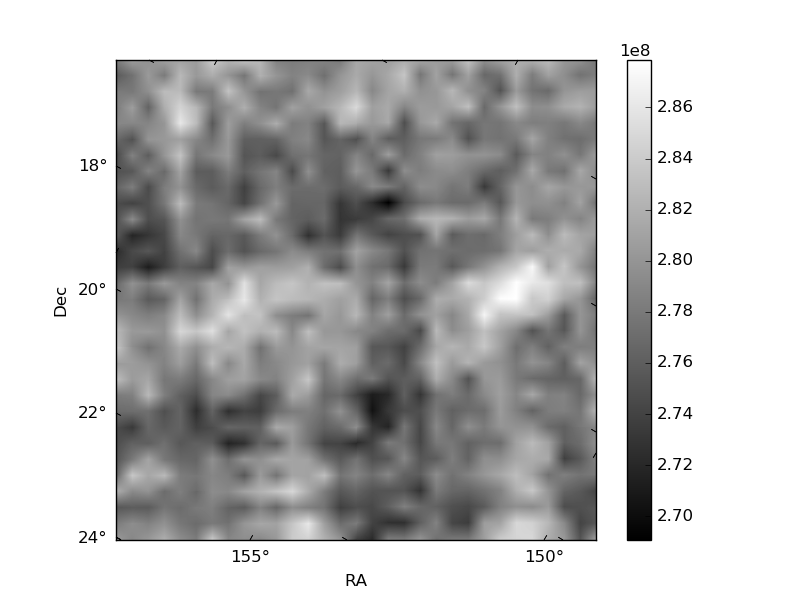
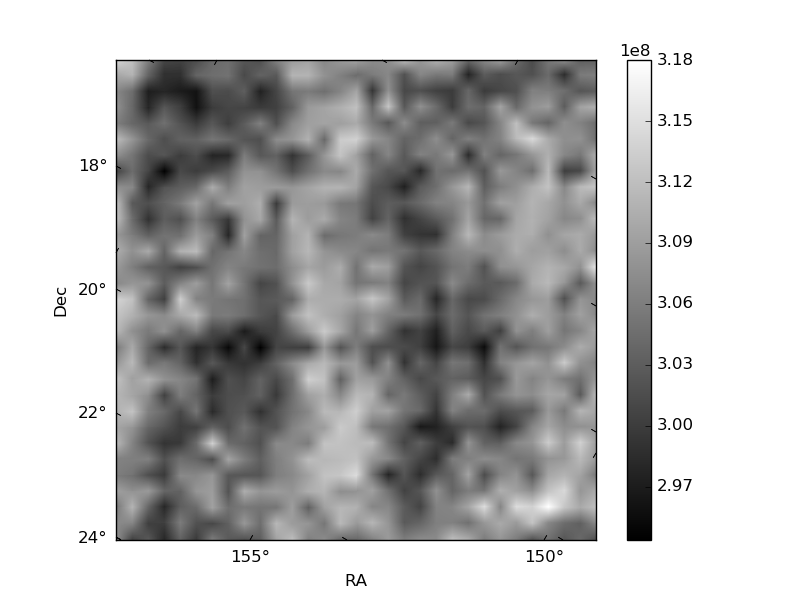
Histogram calculated using DETX and DETY for each event in the final _common_clean file
| Quadrant A | 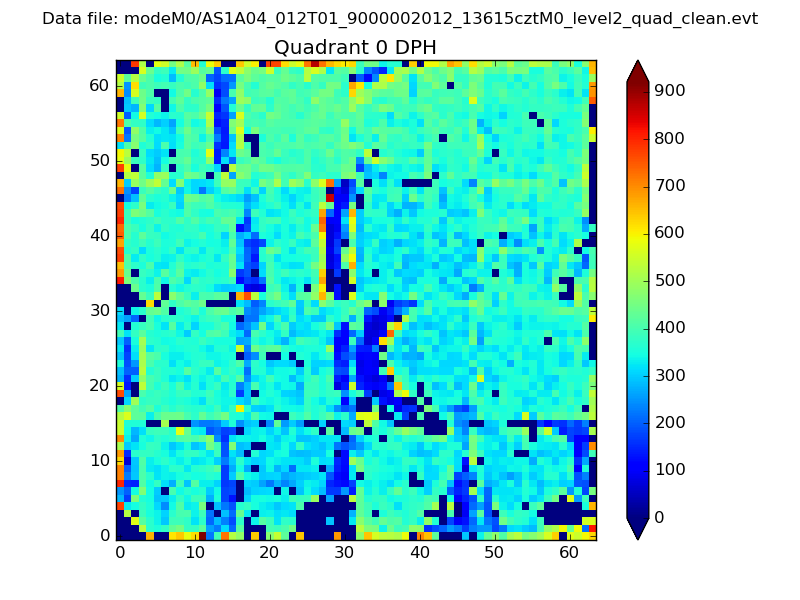 |
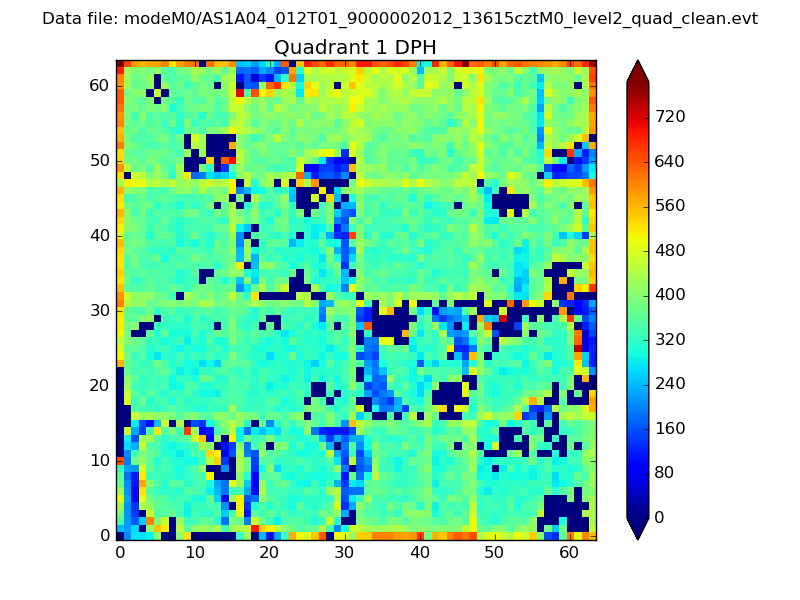 |
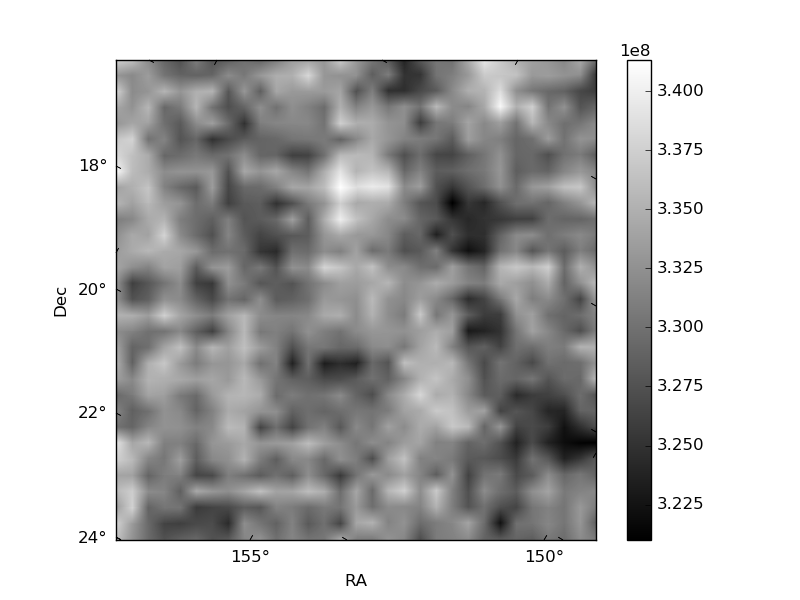
Quadrant B |
|---|---|---|---|
| Quadrant D | 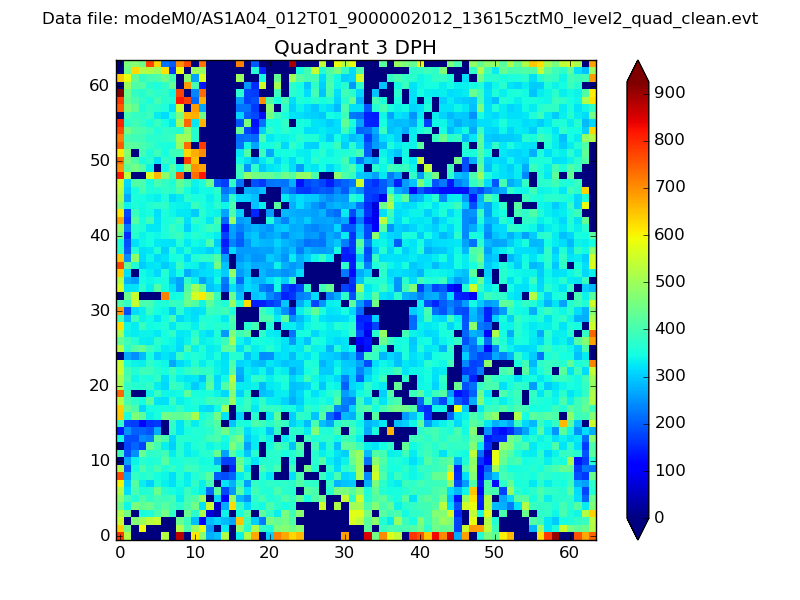 |
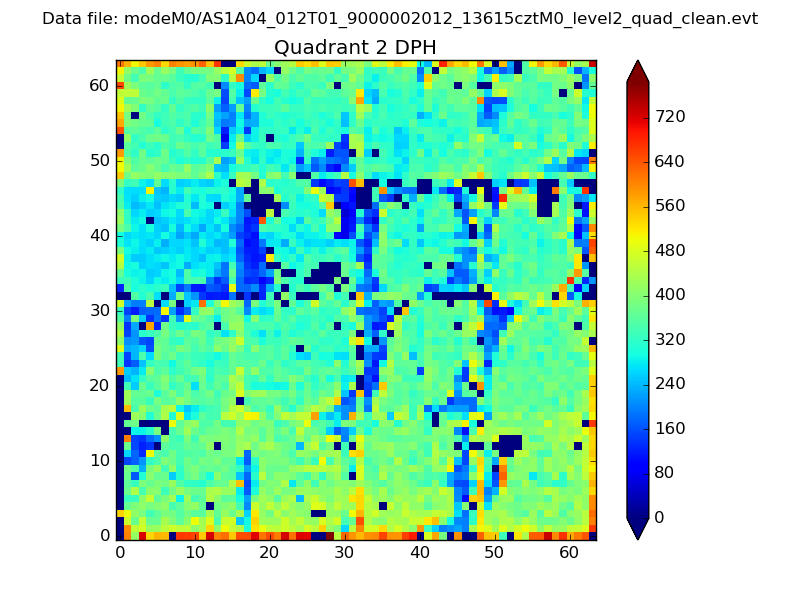 |
Quadrant C |
| Plot type | Count rate plots | Images |
|---|---|---|
| Comparison with Poisson distribution Blue bars denote a histogram of data divided into 1 sec bins. Red curve is a Poisson curve with rate = median count rate of data. |
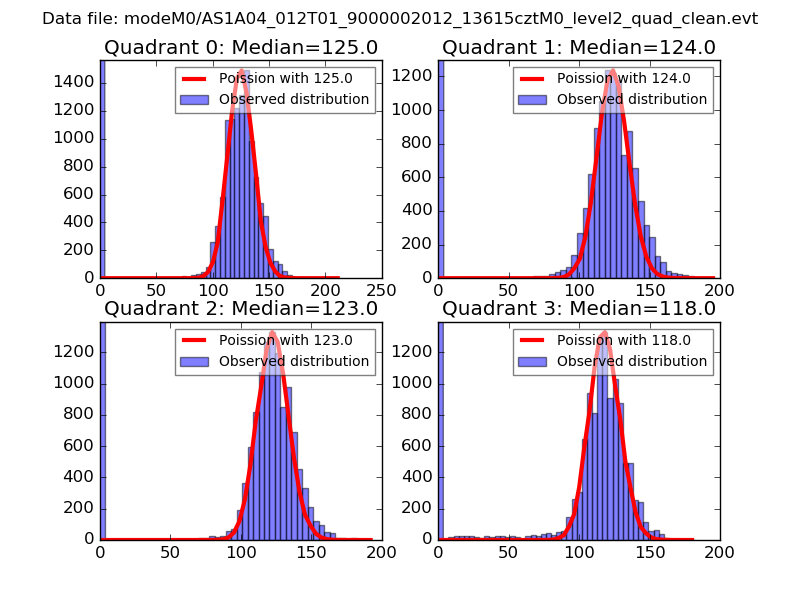 |
 |
| Quadrant-wise count rates Data is divided into 100 sec bins |
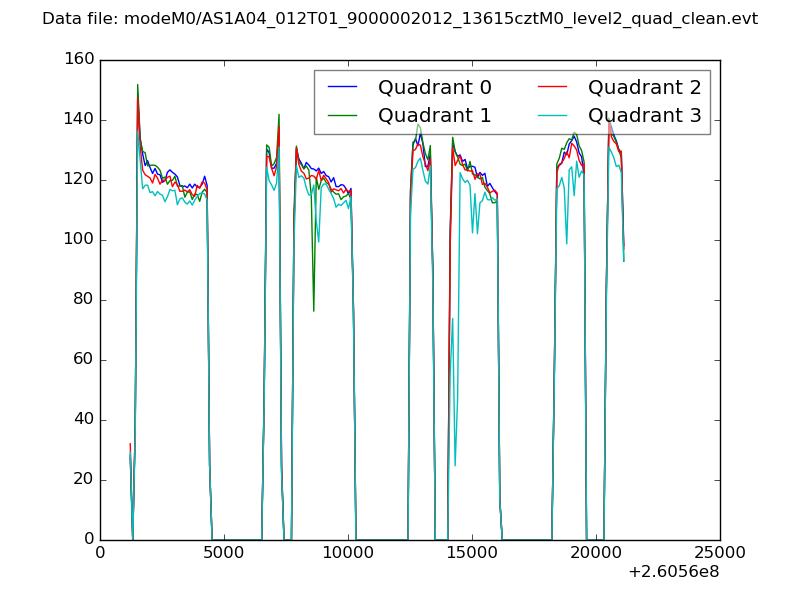 |
|
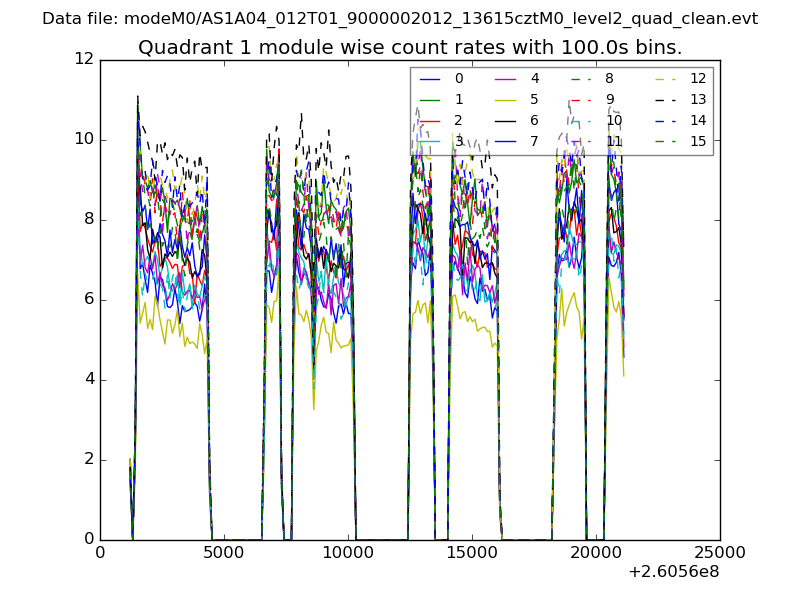
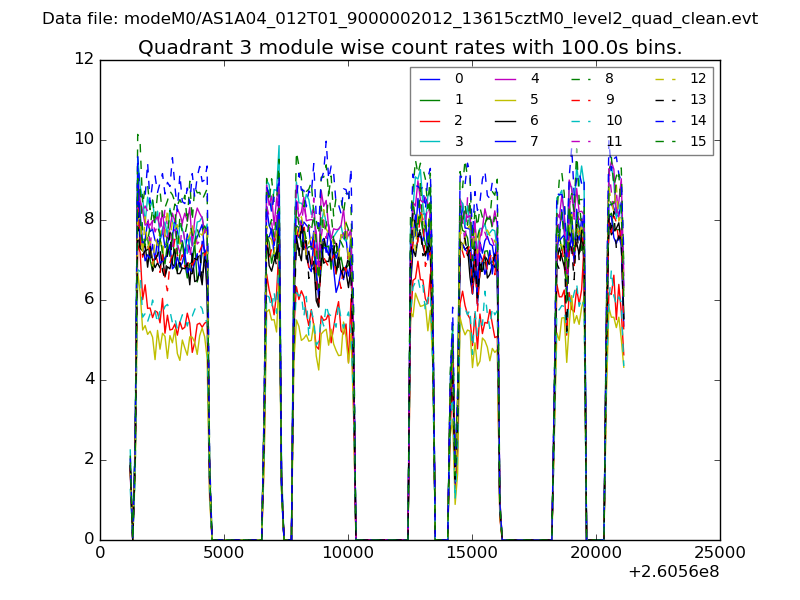
| Module-wise count rates for Quadrant A Data is divided into 100 sec bins |
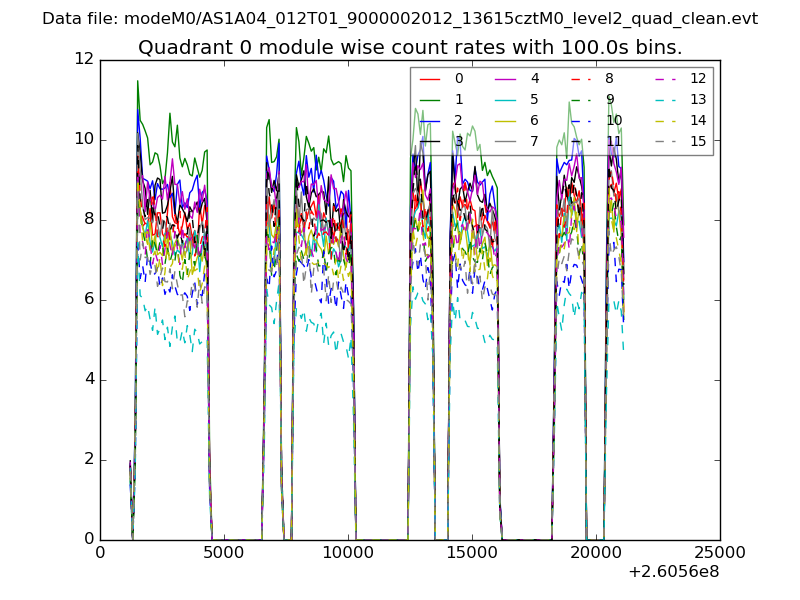 |
 |
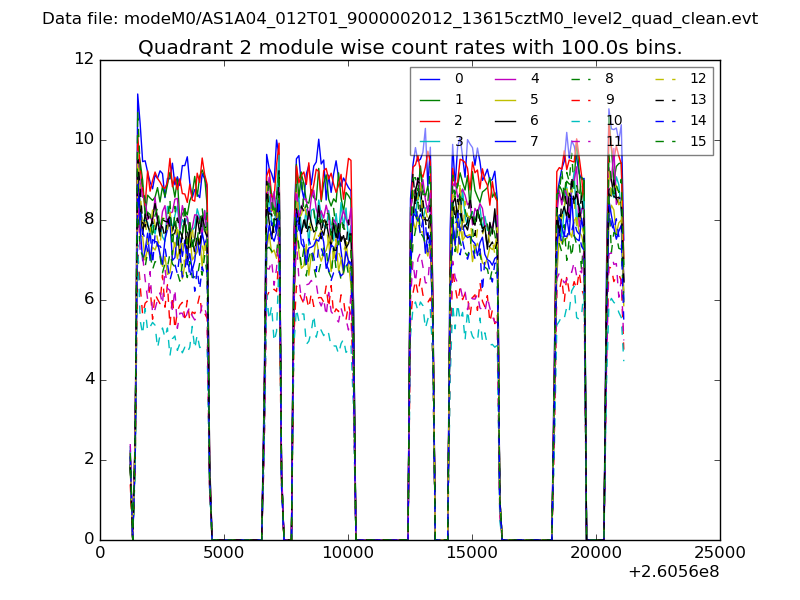
| Module-wise count rates for Quadrant B Data is divided into 100 sec bins |
 |
 |
| Module-wise count rates for Quadrant C Data is divided into 100 sec bins |
 |
 |
| Module-wise count rates for Quadrant D Data is divided into 100 sec bins |
 |
 |
| Parameter | Plot |
|---|---|
| CZT HV Monitor | 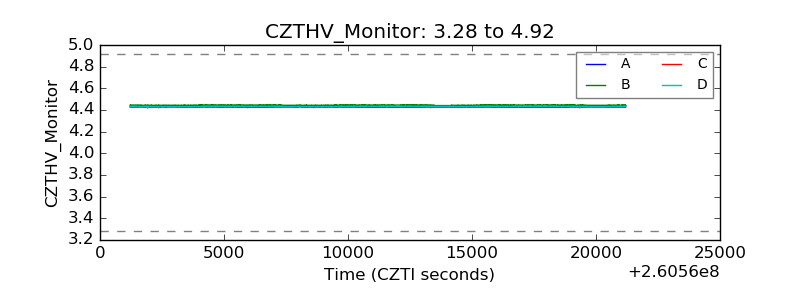 |
| D_VDD | 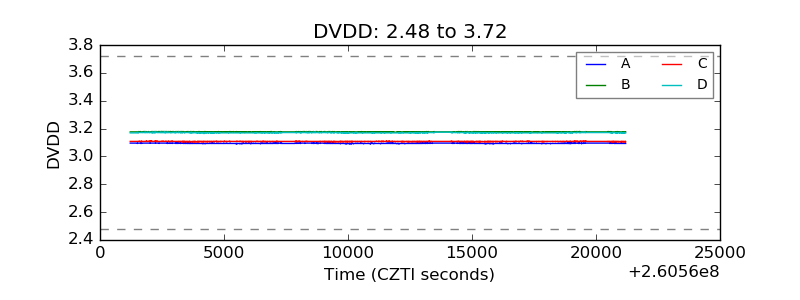 |
| Temperature 1 | 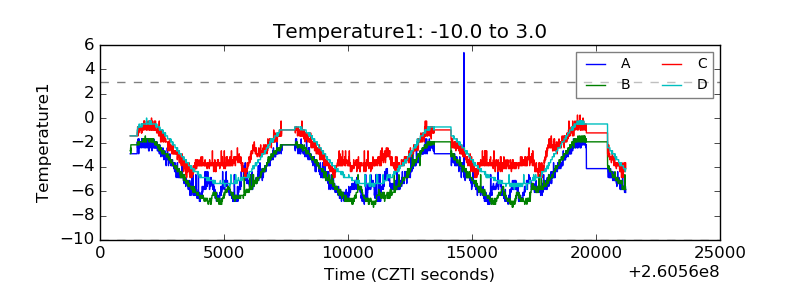 |
| Veto HV Monitor | 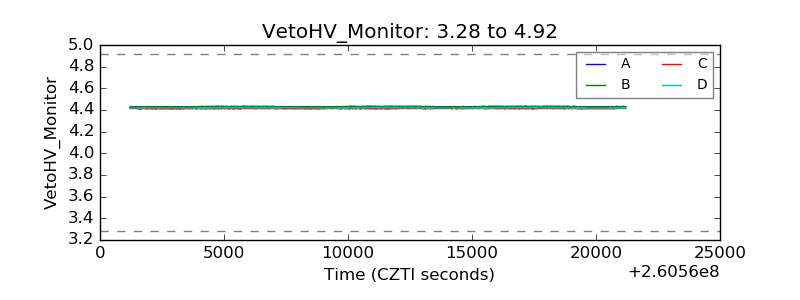 |
| Veto LLD | 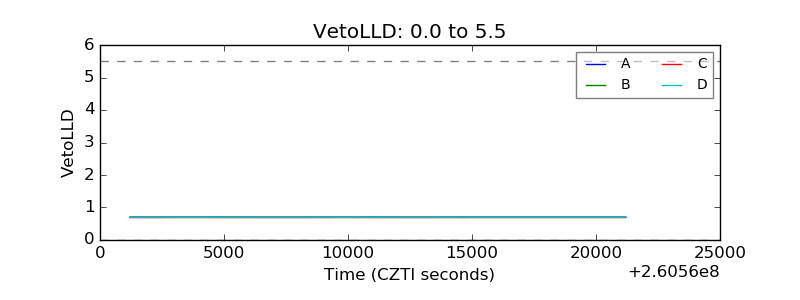 |
| Alpha Counter |  |
| _CPM_Rate | 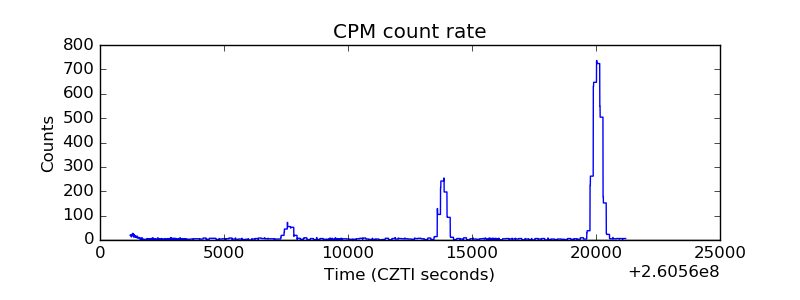 |
| CZT Counter | 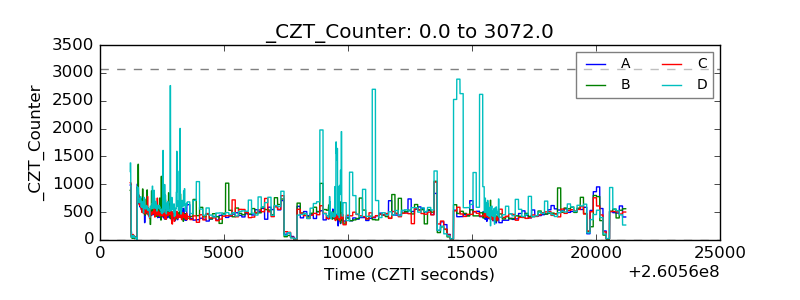 |
| +2.5 Volts monitor |  |
| +5 Volts monitor |  |
| _ROLL_ROT | 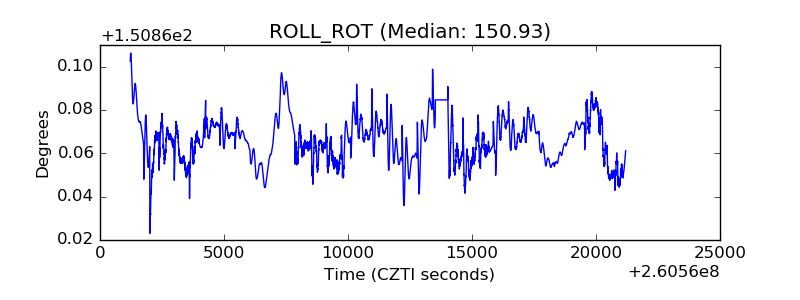 |
| _Roll_DEC | 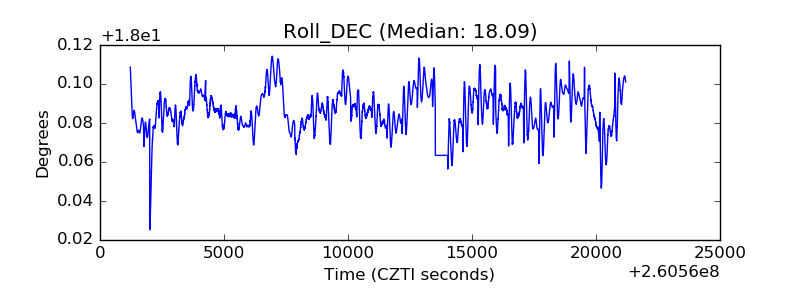 |
| _Roll_RA | 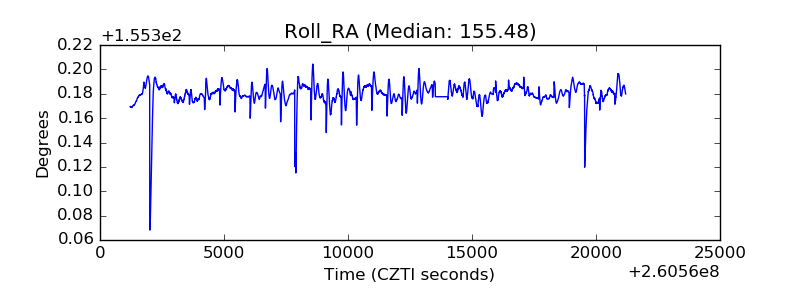 |
| Veto Counter | 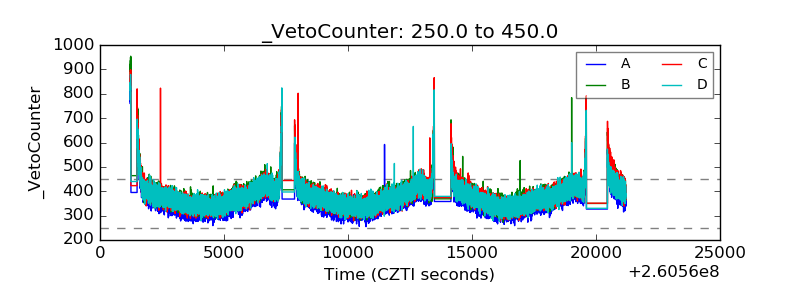 |