| Param | Original file | Final file |
|---|---|---|
| Filename | modeM0/AS1C03_015T02_9000002008cztM0_level2.fits | modeM0/AS1C03_015T02_9000002008cztM0_level2_quad_clean.evt |
| Size (bytes) | 125,346,240 | 123,920,640 |
| Size | 119.5 MB | 118.2 MB |
| Events in quadrant A | 791,628 | 787,588 |
| Events in quadrant B | 747,946 | 788,740 |
| Events in quadrant C | 757,836 | 747,878 |
| Events in quadrant D | 602,402 | 532,567 |
| Mode SS | |||
|---|---|---|---|
| Quadrant | BADHDUFLAG | Total packets | Discarded packets |
| A | 0 | 262 | 0 |
| B | 0 | 262 | 0 |
| C | 0 | 262 | 0 |
| D | 0 | 262 | 0 |
| Mode M0 | |||
|---|---|---|---|
| Quadrant | BADHDUFLAG | Total packets | Discarded packets |
| A | 0 | 26508 | 0 |
| B | 0 | 29915 | 0 |
| C | 0 | 26666 | 0 |
| D | 0 | 51746 | 0 |
| Mode M9 | |||
|---|---|---|---|
| Quadrant | BADHDUFLAG | Total packets | Discarded packets |
| A | 0 | 24 | 0 |
| B | 0 | 24 | 0 |
| C | 0 | 24 | 0 |
| D | 0 | 24 | 0 |
| Quadrant | Total seconds | Saturated seconds | Saturation percentage |
|---|---|---|---|
| A | 12955 | 58 | 0.447704% |
| B | 12955 | 221 | 1.705905% |
| C | 12955 | 55 | 0.424547% |
| D | 12955 | 2593 | 20.015438% |
Noise dominated data is calculated using 1-second bins in cleaned event files. If a bin has >2000 counts, and if more than 50% of those come from <1% of pixels, then it is considered to be noise-dominated and hence unusable.
| Quadrant | # 1 sec bins | Bins with >0 counts | Bins with >2000 counts | High rate bins dominated by noise | Noise dominated (total time) | Noise dominated (detector-on time) | Marked lightcurve |
|---|---|---|---|---|---|---|---|
| A | 15415 | 12955 | 0 | 0 | 0.00% | 0.00% | 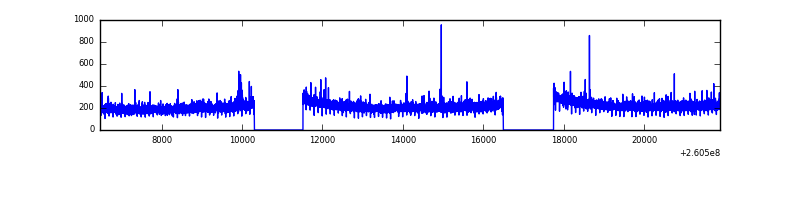 |
| B | 15415 | 12953 | 0 | 0 | 0.00% | 0.00% | 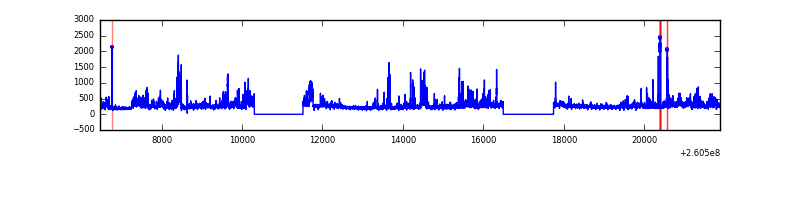 |
| C | 15415 | 12954 | 0 | 0 | 0.00% | 0.00% |  |
| D | 15415 | 12952 | 0 | 0 | 0.00% | 0.00% |  |
Top three noisy pixels from each quadrant. If the there are fewer than three noisy pixels in the level2.evt file, extra rows are filled as -1
| Pixel properties | Quadrant properties | ||||||
|---|---|---|---|---|---|---|---|
| Quadrant | DetID | PixID | Counts | Sigma | Mean | Median | Sigma |
| A | 0 | 29 | 759 | 10.67 | 206 | 195 | 52.9 |
| A | 7 | 110 | 700 | 9.55 | 206 | 195 | 52.9 |
| A | 9 | 19 | 623 | 8.1 | 206 | 195 | 52.9 |
| B | 2 | 9 | 654 | 11.26 | 198 | 191 | 41.1 |
| B | 5 | 128 | 517 | 7.93 | 198 | 191 | 41.1 |
| B | 14 | 254 | 502 | 7.57 | 198 | 191 | 41.1 |
| C | 1 | 81 | 569 | 7.15 | 200 | 188 | 53.3 |
| C | 1 | 80 | 552 | 6.83 | 200 | 188 | 53.3 |
| C | 3 | 126 | 537 | 6.55 | 200 | 188 | 53.3 |
| D | 6 | 67 | 465 | 6.43 | 172 | 157 | 47.9 |
| D | 10 | 189 | 452 | 6.15 | 172 | 157 | 47.9 |
| D | 6 | 231 | 443 | 5.97 | 172 | 157 | 47.9 |
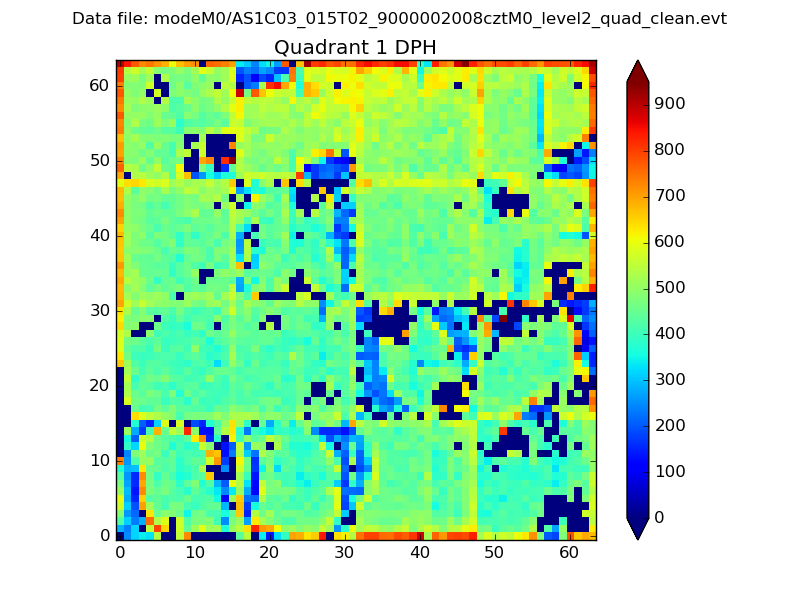
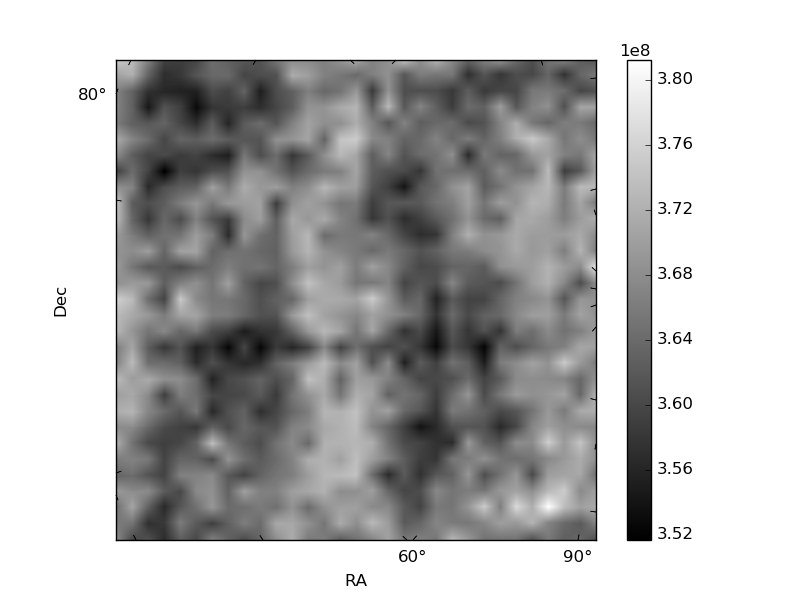
Histogram calculated using DETX and DETY for each event in the final _common_clean file
| Quadrant A |  |
 |
Quadrant B |
|---|---|---|---|
| Quadrant D | 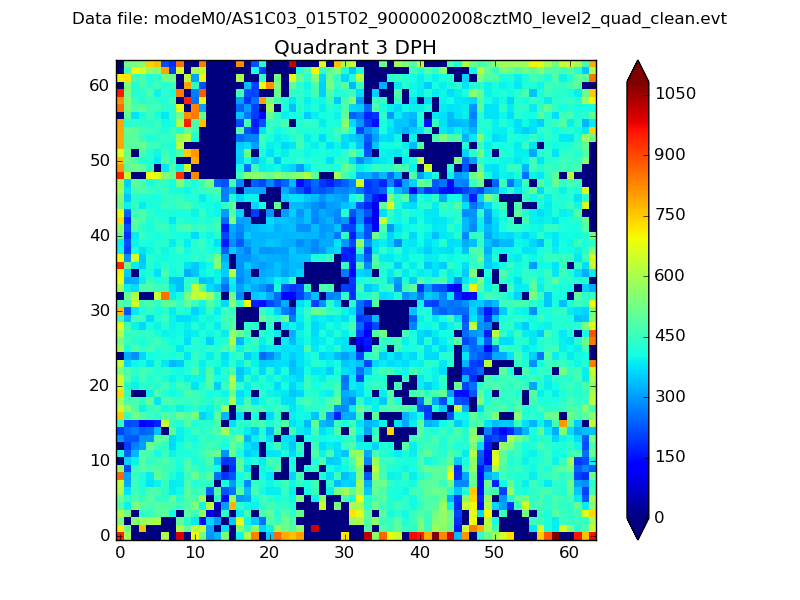 |
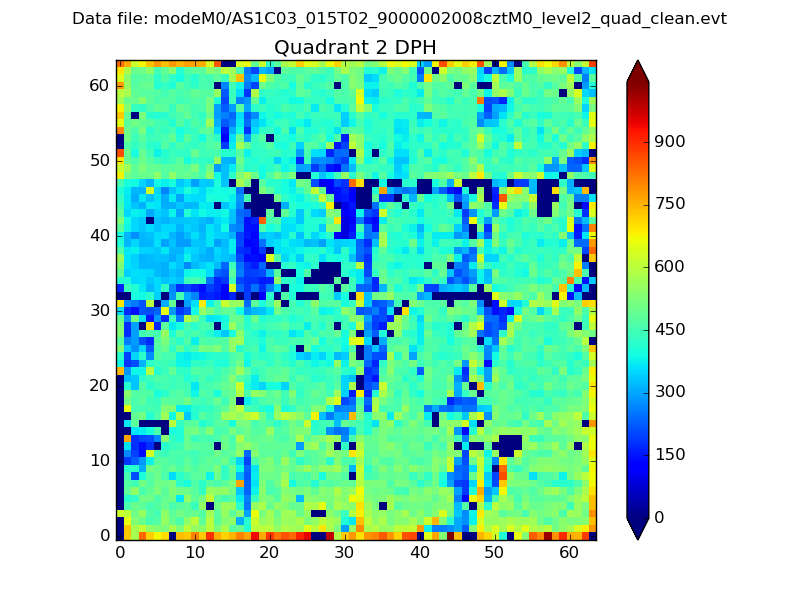 |
Quadrant C |
| Plot type | Count rate plots | Images |
|---|---|---|
| Comparison with Poisson distribution Blue bars denote a histogram of data divided into 1 sec bins. Red curve is a Poisson curve with rate = median count rate of data. |
 |
 |
| Quadrant-wise count rates Data is divided into 100 sec bins |
 |
|
| Module-wise count rates for Quadrant A Data is divided into 100 sec bins |
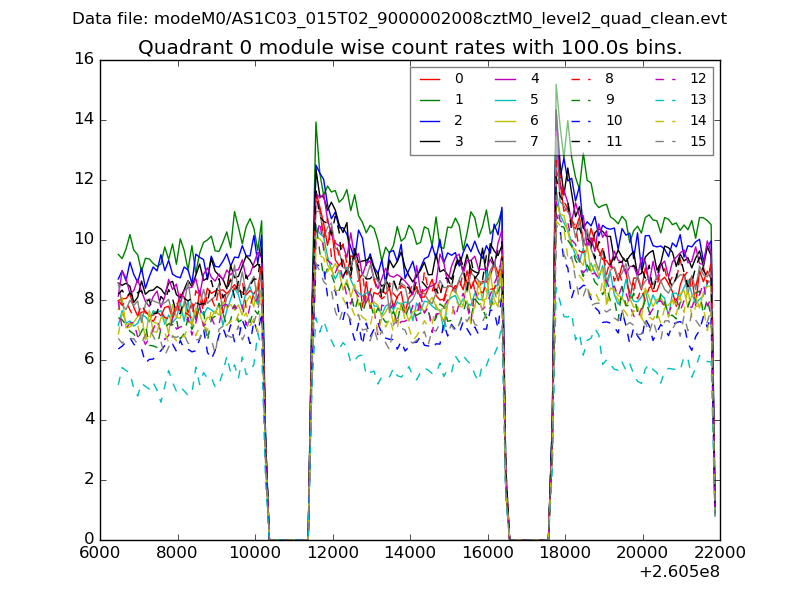 |
 |
| Module-wise count rates for Quadrant B Data is divided into 100 sec bins |
 |
 |
| Module-wise count rates for Quadrant C Data is divided into 100 sec bins |
 |
 |
| Module-wise count rates for Quadrant D Data is divided into 100 sec bins |
 |
 |
| Parameter | Plot |
|---|---|
| CZT HV Monitor |  |
| D_VDD |  |
| Temperature 1 |  |
| Veto HV Monitor |  |
| Veto LLD |  |
| Alpha Counter |  |
| _CPM_Rate |  |
| CZT Counter |  |
| +2.5 Volts monitor |  |
| +5 Volts monitor |  |
| _ROLL_ROT | 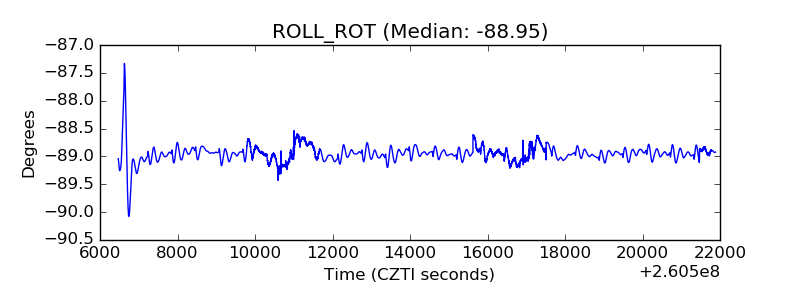 |
| _Roll_DEC |  |
| _Roll_RA | 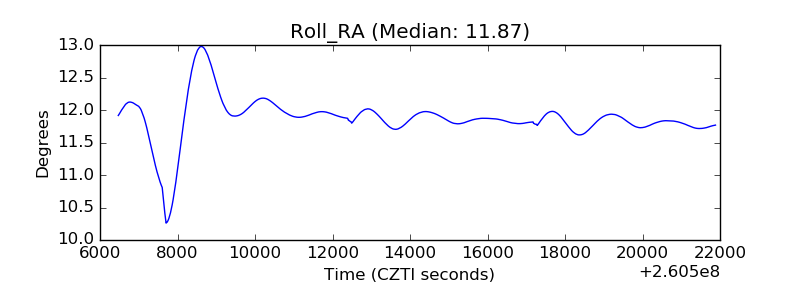 |
| Veto Counter |  |