| Param | Original file | Final file |
|---|---|---|
| Filename | modeM0/AS1C03_015T02_9000002008_13605cztM0_level2.evt | modeM0/AS1C03_015T02_9000002008_13605cztM0_level2_quad_clean.evt |
| Size (bytes) | 418,222,080 | 82,978,560 |
| Size | 398.8 MB | 79.1 MB |
| Events in quadrant A | 1,997,280 | 590,086 |
| Events in quadrant B | 2,255,777 | 594,361 |
| Events in quadrant C | 2,006,670 | 575,708 |
| Events in quadrant D | 6,124,622 | 460,583 |
| Mode SS | |||
|---|---|---|---|
| Quadrant | BADHDUFLAG | Total packets | Discarded packets |
| A | 0 | 82 | 0 |
| B | 0 | 82 | 0 |
| C | 0 | 82 | 0 |
| D | 0 | 82 | 0 |
| Mode M0 | |||
|---|---|---|---|
| Quadrant | BADHDUFLAG | Total packets | Discarded packets |
| A | 0 | 8529 | 1 |
| B | 0 | 9209 | 1 |
| C | 0 | 8651 | 1 |
| D | 0 | 21116 | 1 |
| Mode M9 | |||
|---|---|---|---|
| Quadrant | BADHDUFLAG | Total packets | Discarded packets |
| A | 0 | 2 | 0 |
| B | 0 | 2 | 0 |
| C | 0 | 2 | 0 |
| D | 0 | 3 | 0 |
| Quadrant | Total seconds | Saturated seconds | Saturation percentage |
|---|---|---|---|
| A | 4139 | 7 | 0.169123% |
| B | 4139 | 28 | 0.676492% |
| C | 4139 | 19 | 0.459048% |
| D | 4139 | 1473 | 35.588306% |
Noise dominated data is calculated using 1-second bins in cleaned event files. If a bin has >2000 counts, and if more than 50% of those come from <1% of pixels, then it is considered to be noise-dominated and hence unusable.
| Quadrant | # 1 sec bins | Bins with >0 counts | Bins with >2000 counts | High rate bins dominated by noise | Noise dominated (total time) | Noise dominated (detector-on time) | Marked lightcurve |
|---|---|---|---|---|---|---|---|
| A | 4140 | 4140 | 0 | 0 | 0.00% | 0.00% |  |
| B | 4140 | 4140 | 17 | 17 | 0.41% | 0.41% |  |
| C | 4140 | 4140 | 12 | 12 | 0.29% | 0.29% |  |
| D | 4140 | 4140 | 1492 | 1492 | 36.04% | 36.04% |  |
Top three noisy pixels from each quadrant. If the there are fewer than three noisy pixels in the level2.evt file, extra rows are filled as -1
| Pixel properties | Quadrant properties | ||||||
|---|---|---|---|---|---|---|---|
| Quadrant | DetID | PixID | Counts | Sigma | Mean | Median | Sigma |
| A | 1 | 162 | 24438 | 234.99 | 508 | 498 | 101.9 |
| A | 1 | 178 | 7406 | 67.81 | 508 | 498 | 101.9 |
| A | 1 | 161 | 6688 | 60.76 | 508 | 498 | 101.9 |
| B | 0 | 219 | 82539 | 886.04 | 501 | 490 | 92.6 |
| B | 3 | 64 | 52004 | 556.3 | 501 | 490 | 92.6 |
| B | 10 | 244 | 41410 | 441.89 | 501 | 490 | 92.6 |
| C | 3 | 233 | 70527 | 640.17 | 479 | 481 | 109.4 |
| C | 0 | 207 | 41368 | 373.68 | 479 | 481 | 109.4 |
| C | 14 | 234 | 25801 | 231.41 | 479 | 481 | 109.4 |
| D | 13 | 122 | 4258806 | 43024.5 | 417 | 405 | 99.0 |
| D | 8 | 195 | 106568 | 1072.61 | 417 | 405 | 99.0 |
| D | 5 | 222 | 106373 | 1070.64 | 417 | 405 | 99.0 |
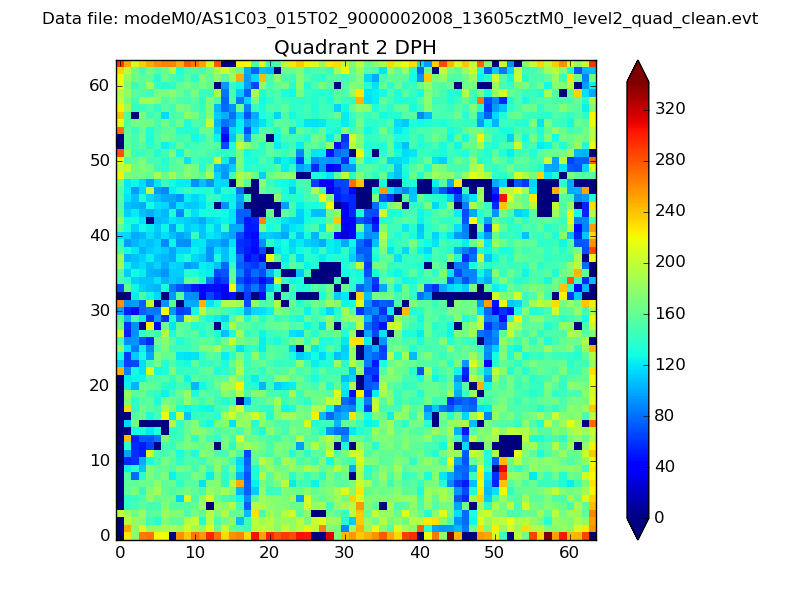
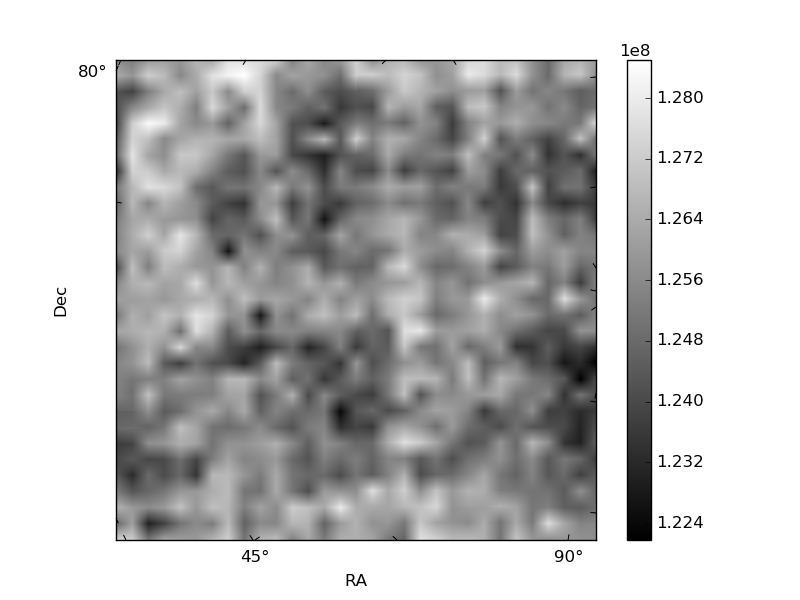
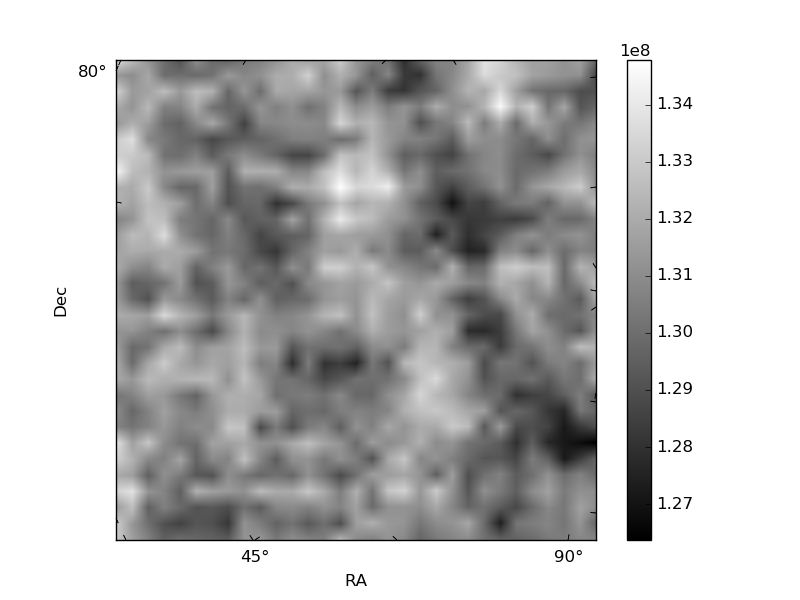
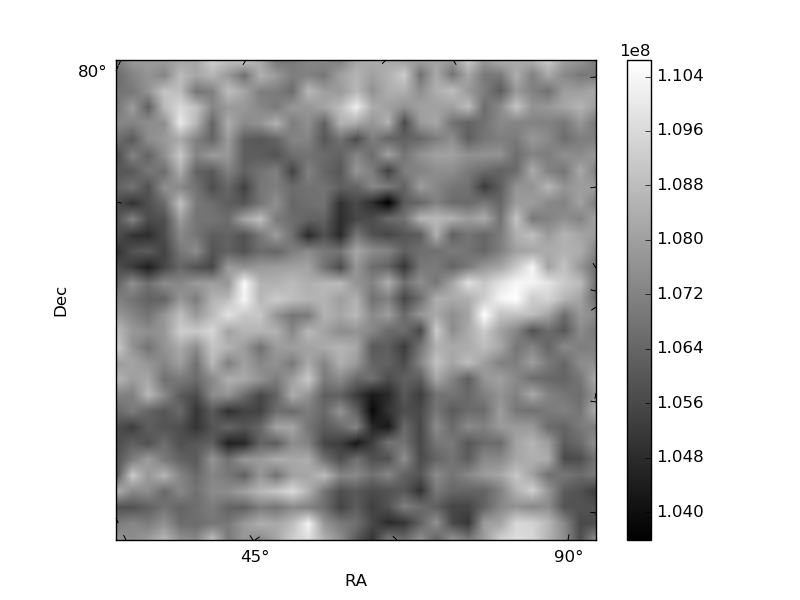
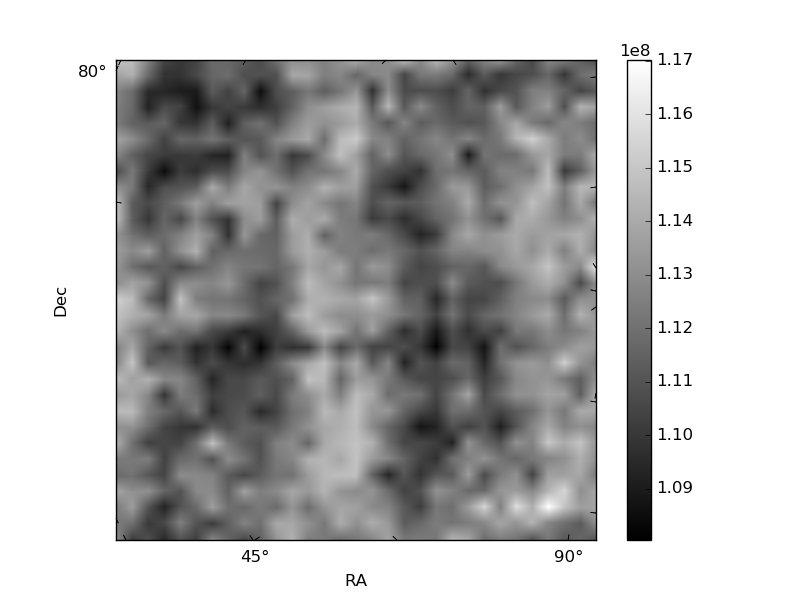
Histogram calculated using DETX and DETY for each event in the final _common_clean file
| Quadrant A | 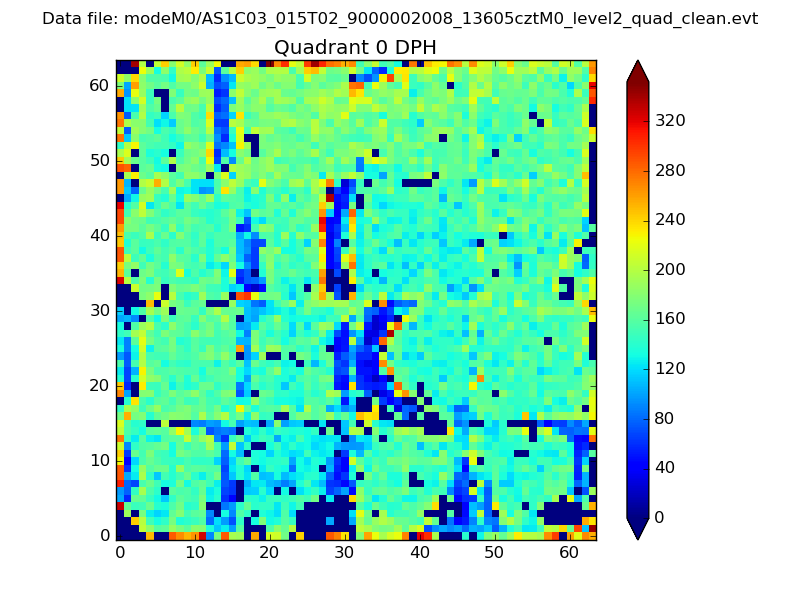 |
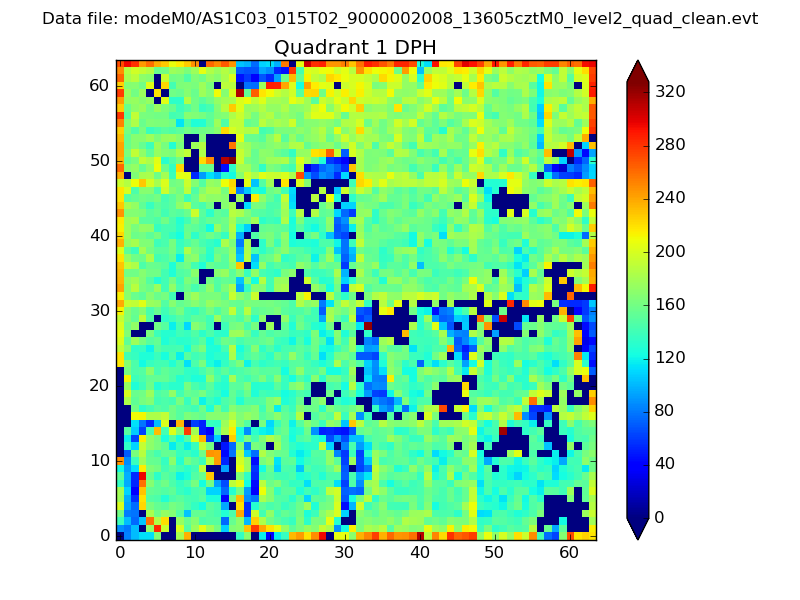 |
Quadrant B |
|---|---|---|---|
| Quadrant D | 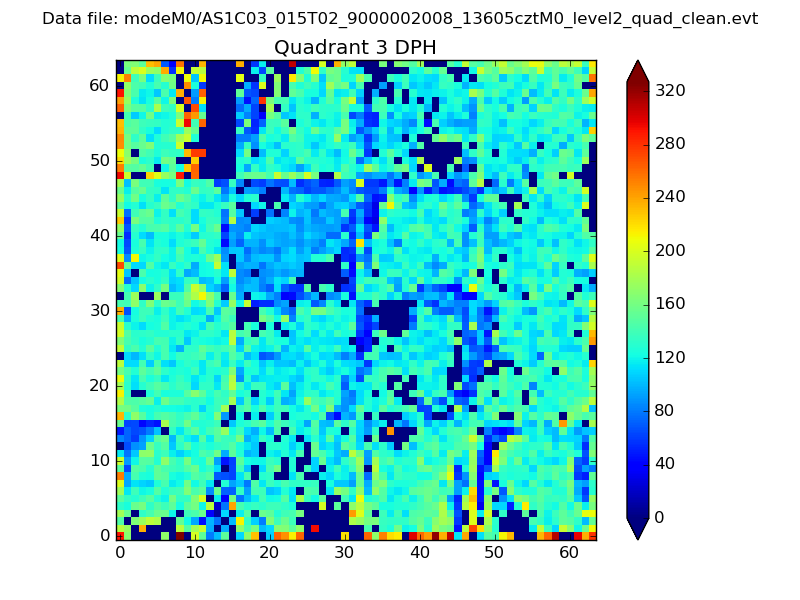 |
 |
Quadrant C |
| Plot type | Count rate plots | Images |
|---|---|---|
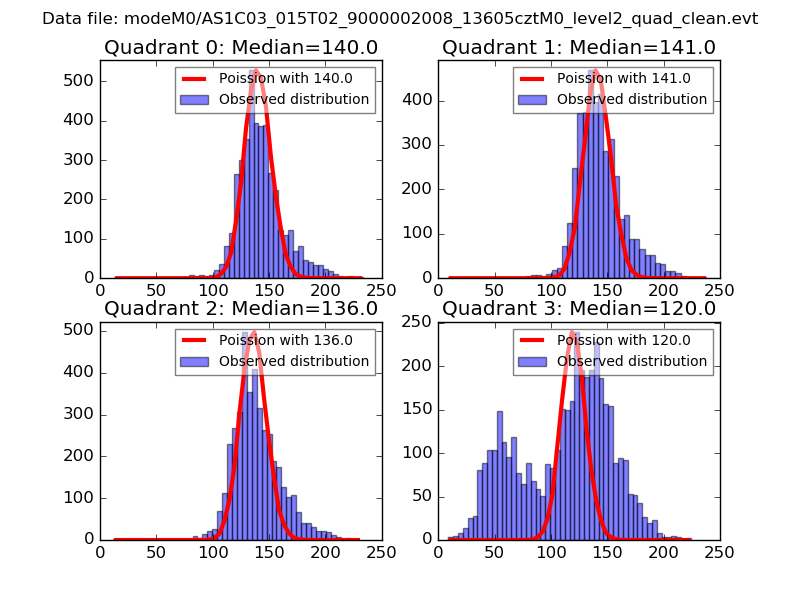
| Comparison with Poisson distribution Blue bars denote a histogram of data divided into 1 sec bins. Red curve is a Poisson curve with rate = median count rate of data. |
 |
 |
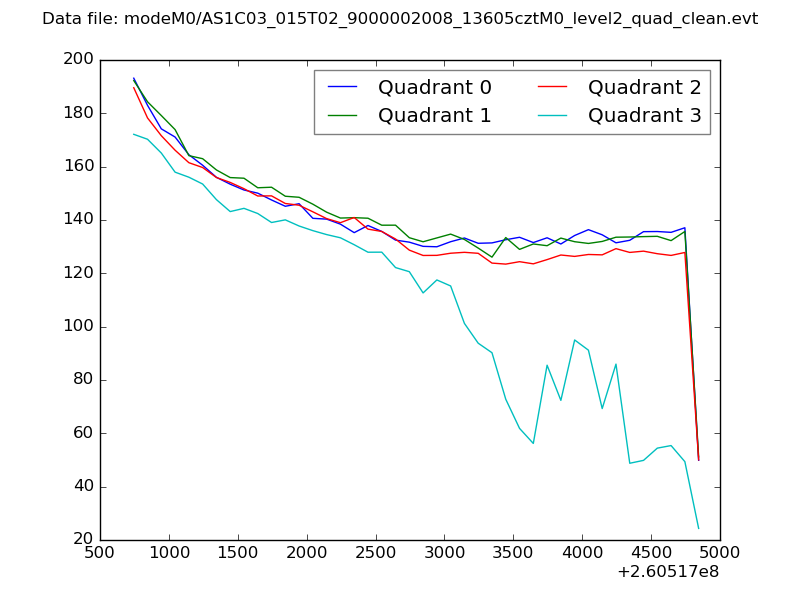
| Quadrant-wise count rates Data is divided into 100 sec bins |
 |
|
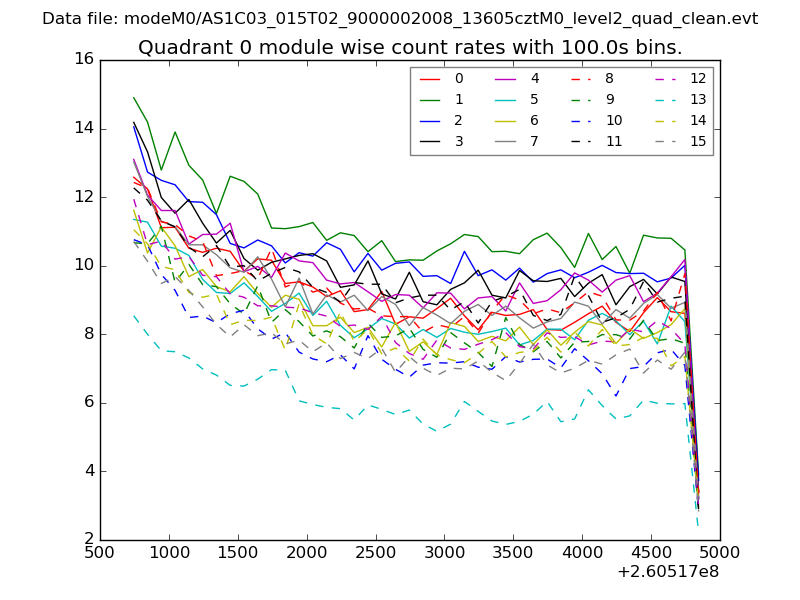
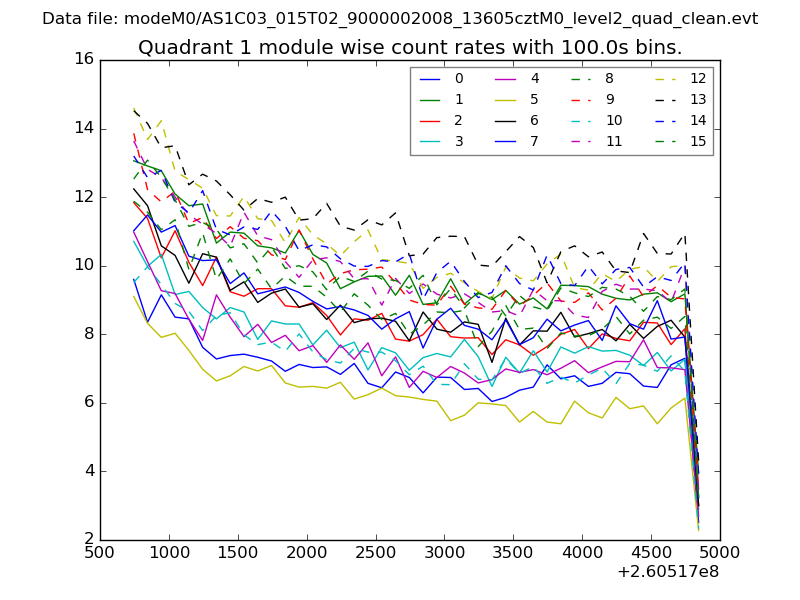
| Module-wise count rates for Quadrant A Data is divided into 100 sec bins |
 |
 |
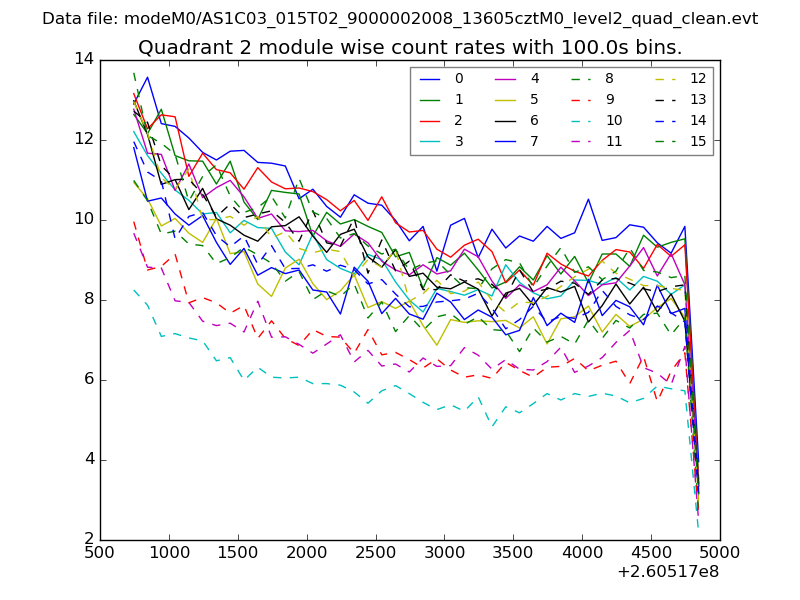
| Module-wise count rates for Quadrant B Data is divided into 100 sec bins |
 |
 |
| Module-wise count rates for Quadrant C Data is divided into 100 sec bins |
 |
 |
| Module-wise count rates for Quadrant D Data is divided into 100 sec bins |
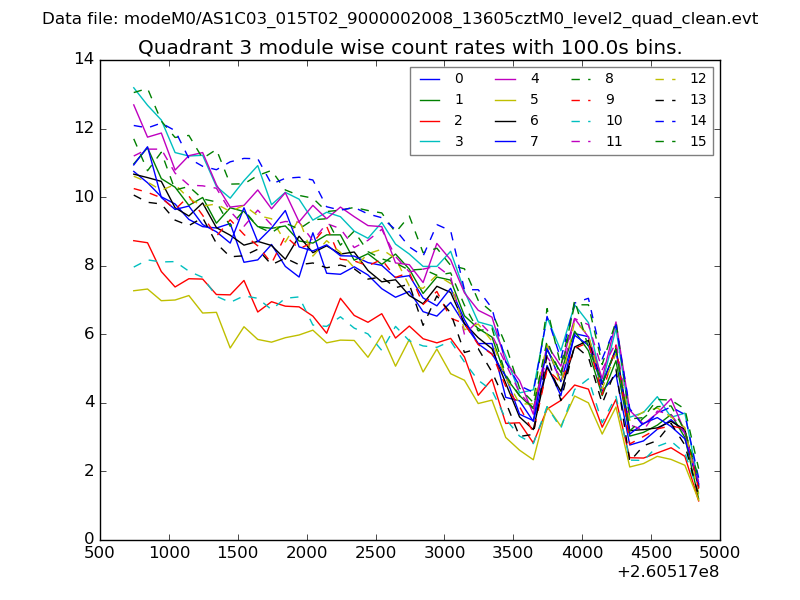 |
 |
| Parameter | Plot |
|---|---|
| CZT HV Monitor | 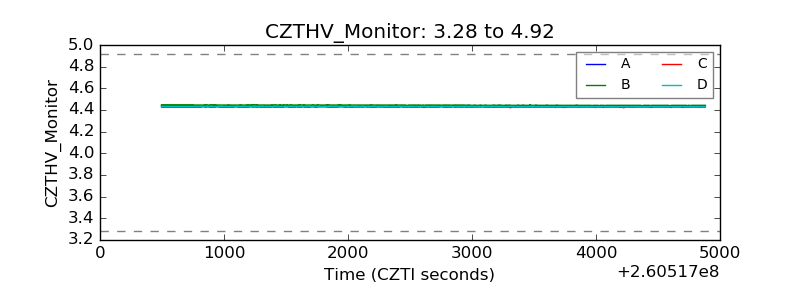 |
| D_VDD | 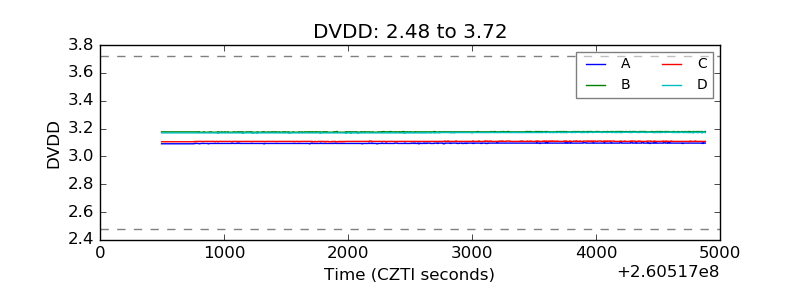 |
| Temperature 1 | 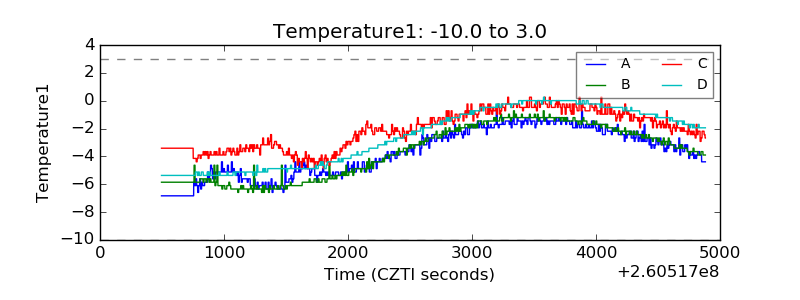 |
| Veto HV Monitor | 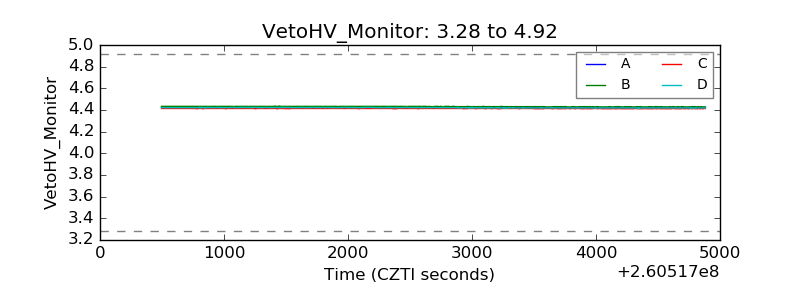 |
| Veto LLD |  |
| Alpha Counter |  |
| _CPM_Rate | 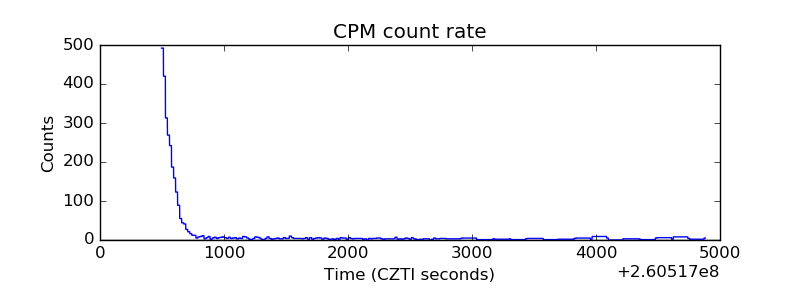 |
| CZT Counter | 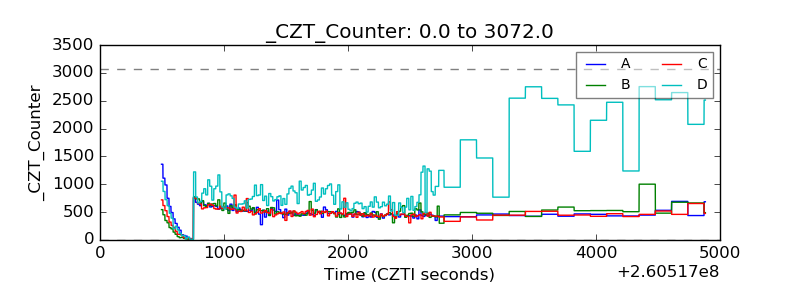 |
| +2.5 Volts monitor |  |
| +5 Volts monitor |  |
| _ROLL_ROT | 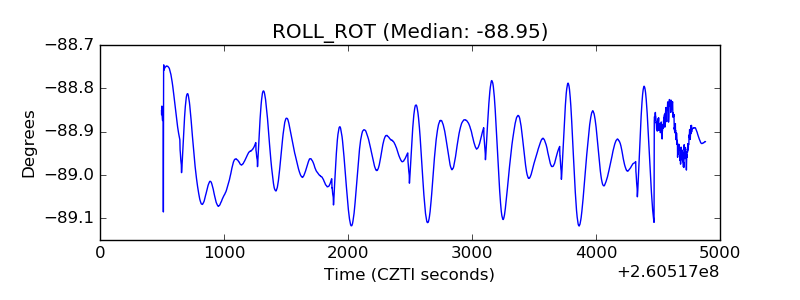 |
| _Roll_DEC | 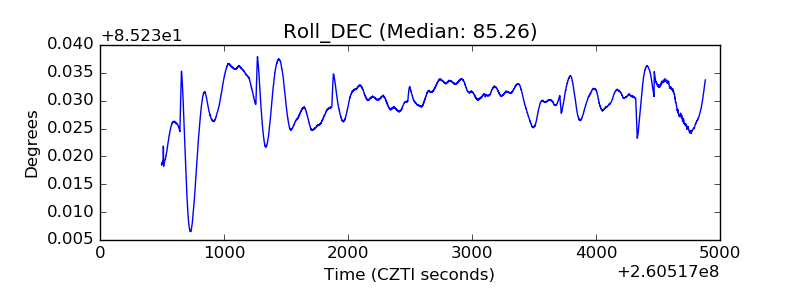 |
| _Roll_RA | 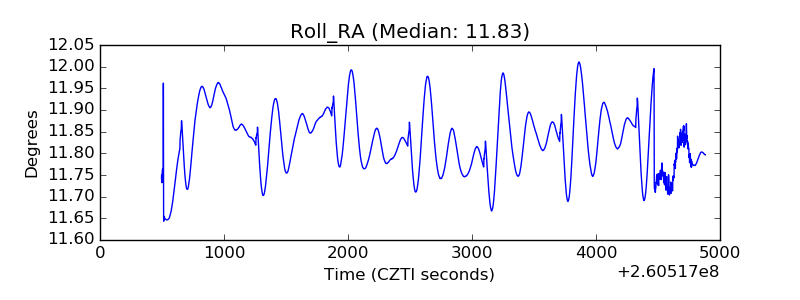 |
| Veto Counter | 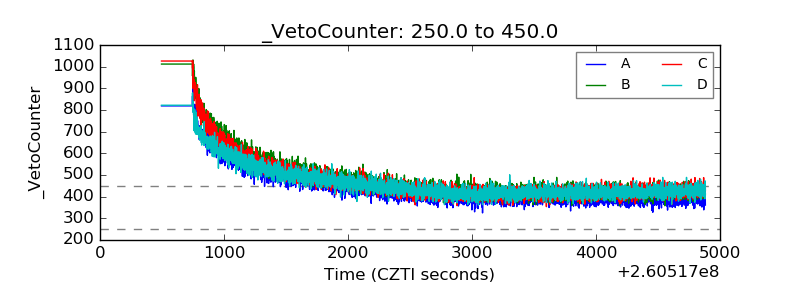 |