| Param | Original file | Final file |
|---|---|---|
| Filename | modeM0/AS1G08_029T01_9000002010cztM0_level2.fits | modeM0/AS1G08_029T01_9000002010cztM0_level2_quad_clean.evt |
| Size (bytes) | 298,094,400 | 306,443,520 |
| Size | 284.3 MB | 292.2 MB |
| Events in quadrant A | 1,869,596 | 1,948,749 |
| Events in quadrant B | 1,767,288 | 1,900,545 |
| Events in quadrant C | 1,792,822 | 1,816,747 |
| Events in quadrant D | 1,526,304 | 1,543,536 |
| Mode M9 | |||
|---|---|---|---|
| Quadrant | BADHDUFLAG | Total packets | Discarded packets |
| A | 0 | 48 | 0 |
| B | 0 | 48 | 0 |
| C | 0 | 48 | 0 |
| D | 0 | 48 | 0 |
| Mode SS | |||
|---|---|---|---|
| Quadrant | BADHDUFLAG | Total packets | Discarded packets |
| A | 0 | 614 | 0 |
| B | 0 | 614 | 0 |
| C | 0 | 614 | 0 |
| D | 0 | 614 | 0 |
| Mode M0 | |||
|---|---|---|---|
| Quadrant | BADHDUFLAG | Total packets | Discarded packets |
| A | 0 | 63630 | 0 |
| B | 0 | 70592 | 0 |
| C | 0 | 63797 | 0 |
| D | 0 | 85746 | 0 |
| Quadrant | Total seconds | Saturated seconds | Saturation percentage |
|---|---|---|---|
| A | 30122 | 732 | 2.430118% |
| B | 30122 | 1070 | 3.552221% |
| C | 30122 | 493 | 1.636678% |
| D | 30122 | 2403 | 7.977558% |
Noise dominated data is calculated using 1-second bins in cleaned event files. If a bin has >2000 counts, and if more than 50% of those come from <1% of pixels, then it is considered to be noise-dominated and hence unusable.
| Quadrant | # 1 sec bins | Bins with >0 counts | Bins with >2000 counts | High rate bins dominated by noise | Noise dominated (total time) | Noise dominated (detector-on time) | Marked lightcurve |
|---|---|---|---|---|---|---|---|
| A | 33751 | 30121 | 0 | 0 | 0.00% | 0.00% | 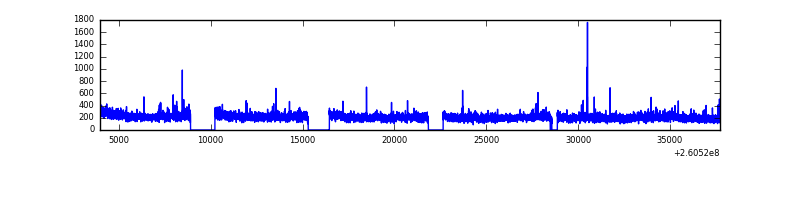 |
| B | 33751 | 30118 | 0 | 0 | 0.00% | 0.00% | 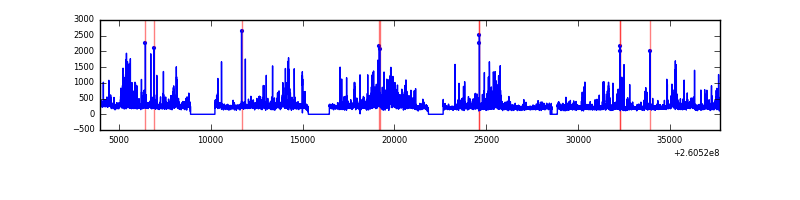 |
| C | 33751 | 30121 | 0 | 0 | 0.00% | 0.00% | 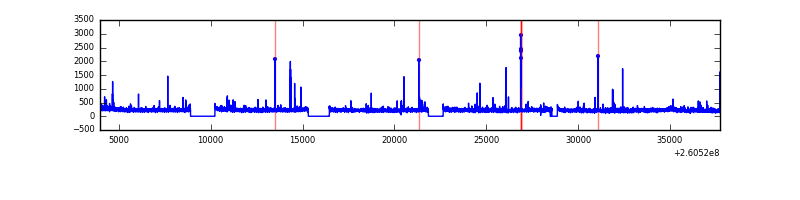 |
| D | 33751 | 30120 | 0 | 0 | 0.00% | 0.00% | 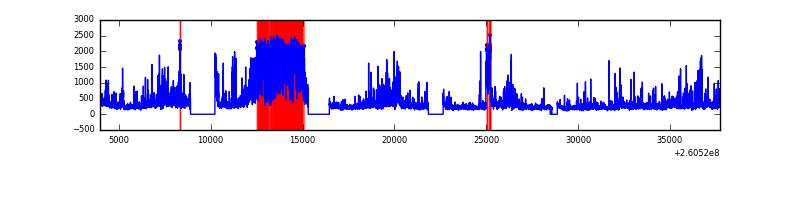 |
Top three noisy pixels from each quadrant. If the there are fewer than three noisy pixels in the level2.evt file, extra rows are filled as -1
| Pixel properties | Quadrant properties | ||||||
|---|---|---|---|---|---|---|---|
| Quadrant | DetID | PixID | Counts | Sigma | Mean | Median | Sigma |
| A | 0 | 29 | 1717 | 10.29 | 487 | 455 | 122.6 |
| A | 7 | 110 | 1499 | 8.52 | 487 | 455 | 122.6 |
| A | 9 | 19 | 1349 | 7.29 | 487 | 455 | 122.6 |
| B | 2 | 9 | 1537 | 11.56 | 466 | 444 | 94.6 |
| B | 5 | 225 | 1169 | 7.67 | 466 | 444 | 94.6 |
| B | 3 | 17 | 1151 | 7.48 | 466 | 444 | 94.6 |
| C | 3 | 126 | 1239 | 6.47 | 474 | 441 | 123.3 |
| C | 2 | 191 | 1228 | 6.38 | 474 | 441 | 123.3 |
| C | 9 | 233 | 1212 | 6.25 | 474 | 441 | 123.3 |
| D | 6 | 231 | 1098 | 6.03 | 436 | 397 | 116.2 |
| D | 7 | 5 | 1084 | 5.91 | 436 | 397 | 116.2 |
| D | 10 | 113 | 1071 | 5.8 | 436 | 397 | 116.2 |
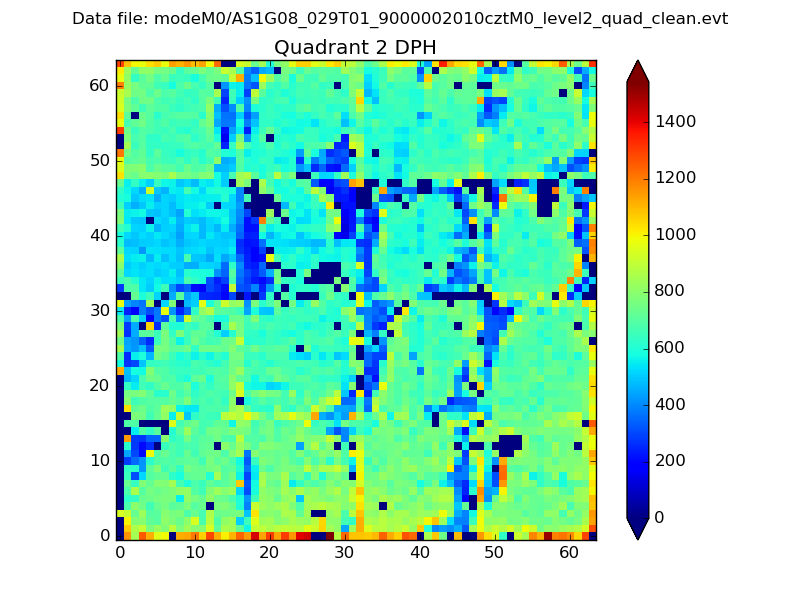
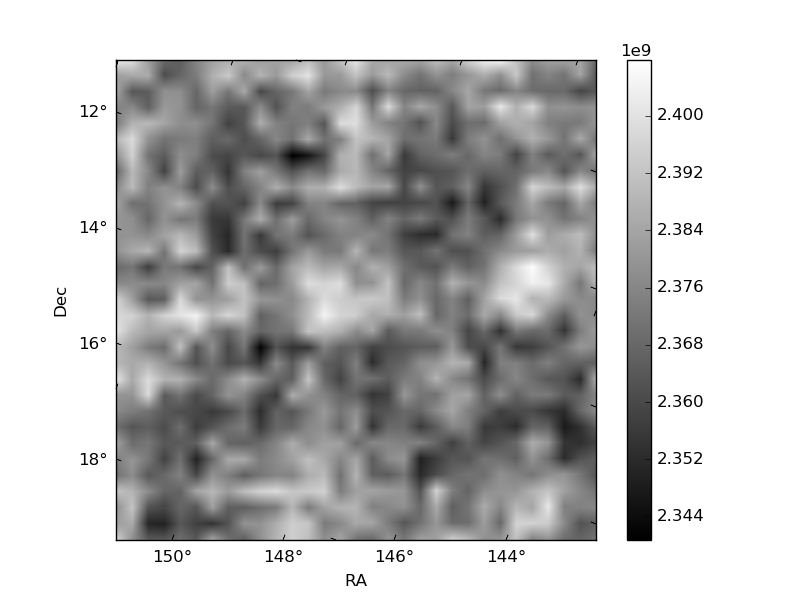
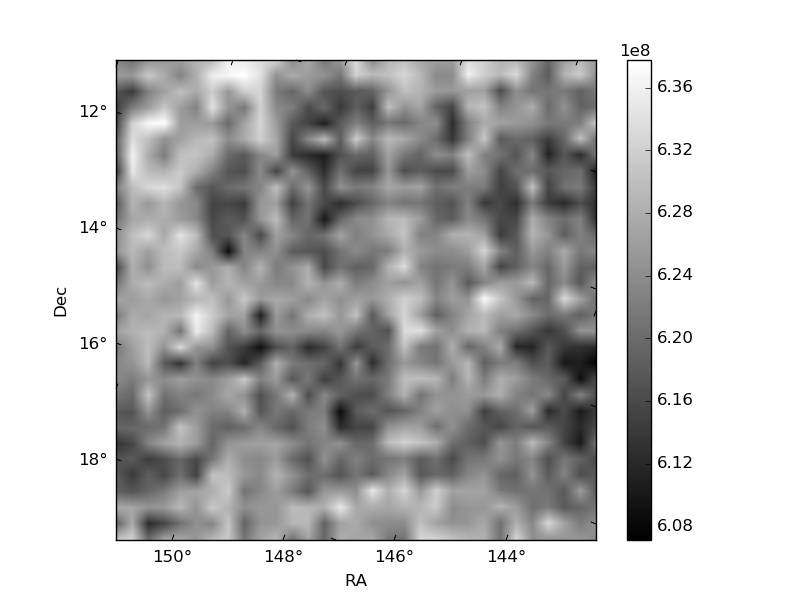
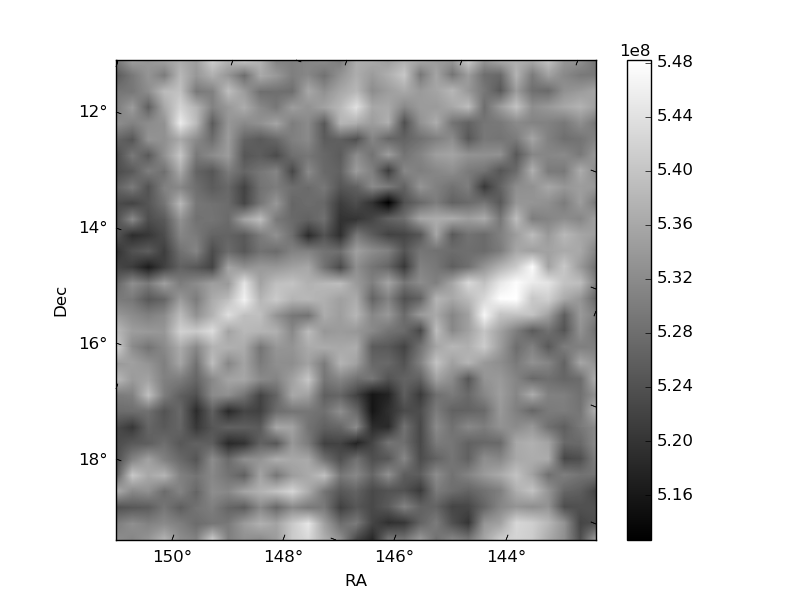
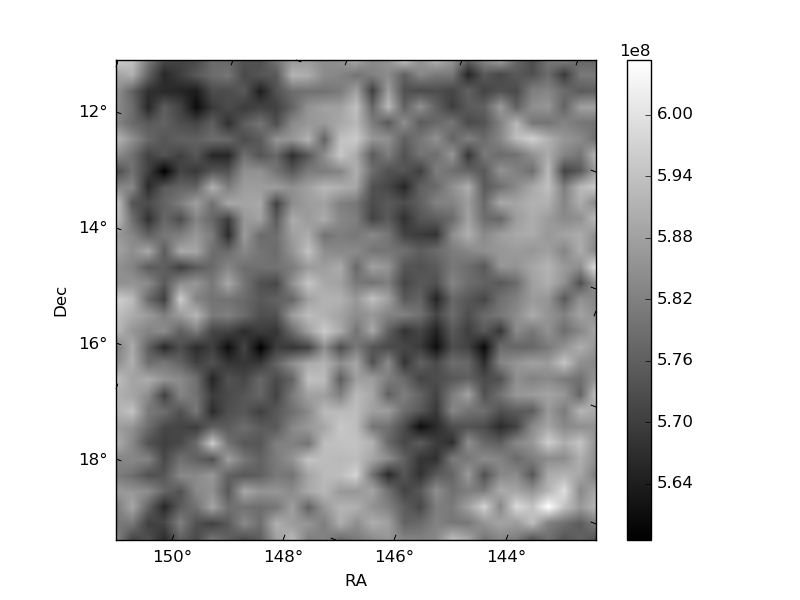
Histogram calculated using DETX and DETY for each event in the final _common_clean file
| Quadrant A | 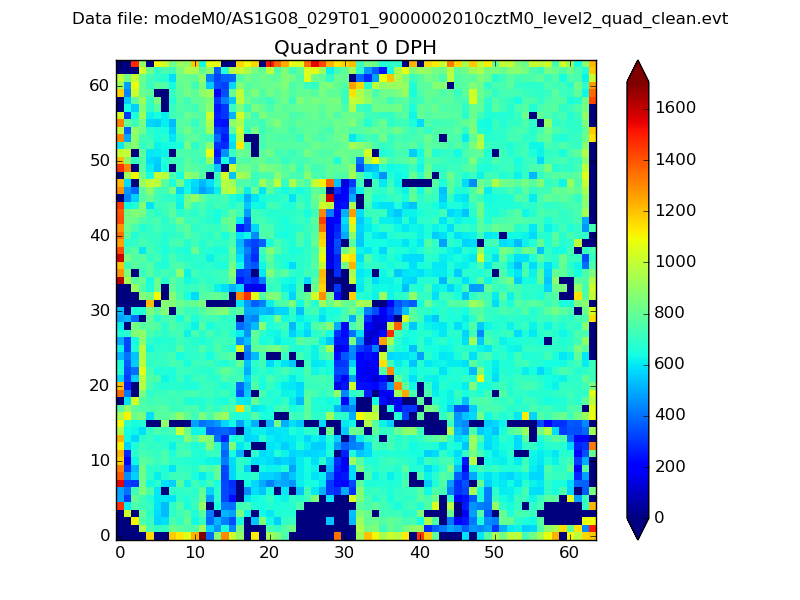 |
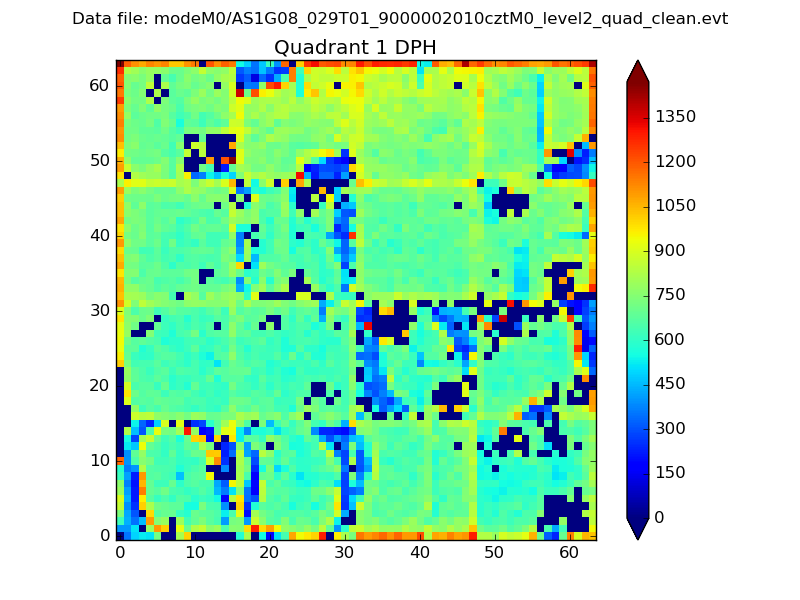 |
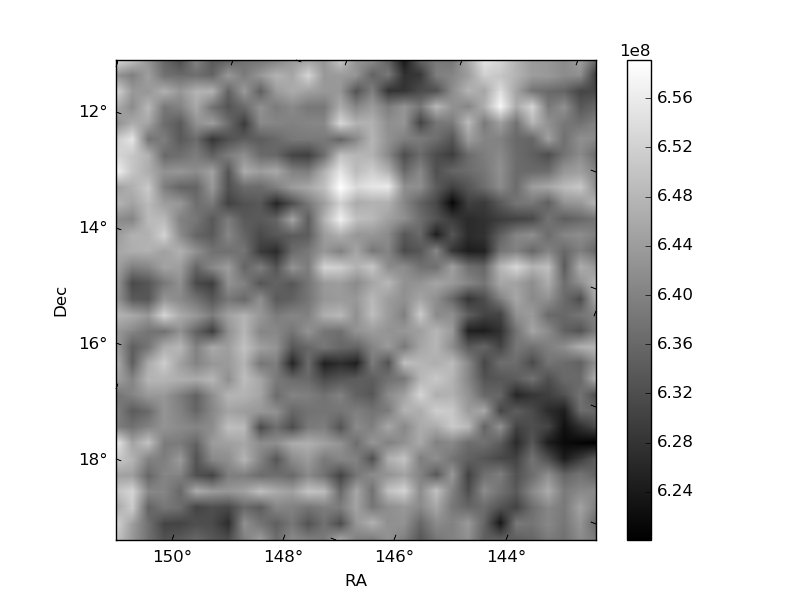
Quadrant B |
|---|---|---|---|
| Quadrant D | 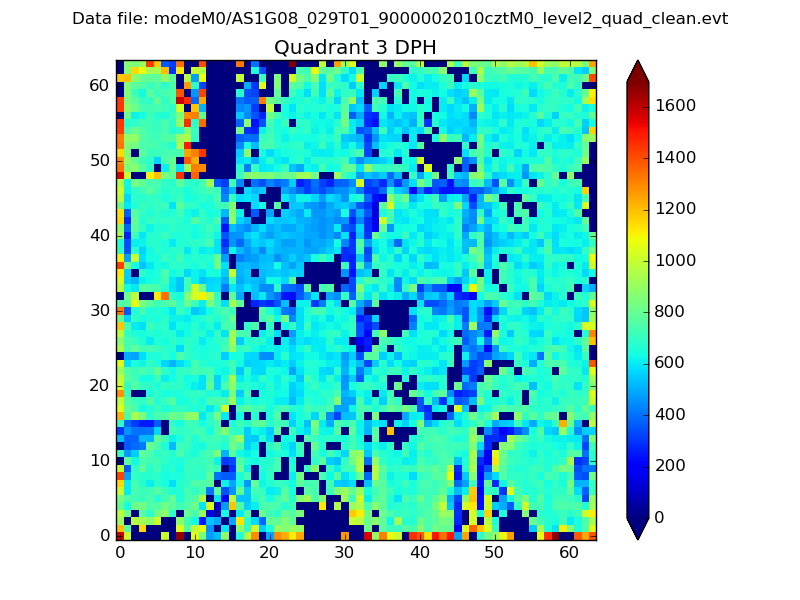 |
 |
Quadrant C |
| Plot type | Count rate plots | Images |
|---|---|---|
| Comparison with Poisson distribution Blue bars denote a histogram of data divided into 1 sec bins. Red curve is a Poisson curve with rate = median count rate of data. |
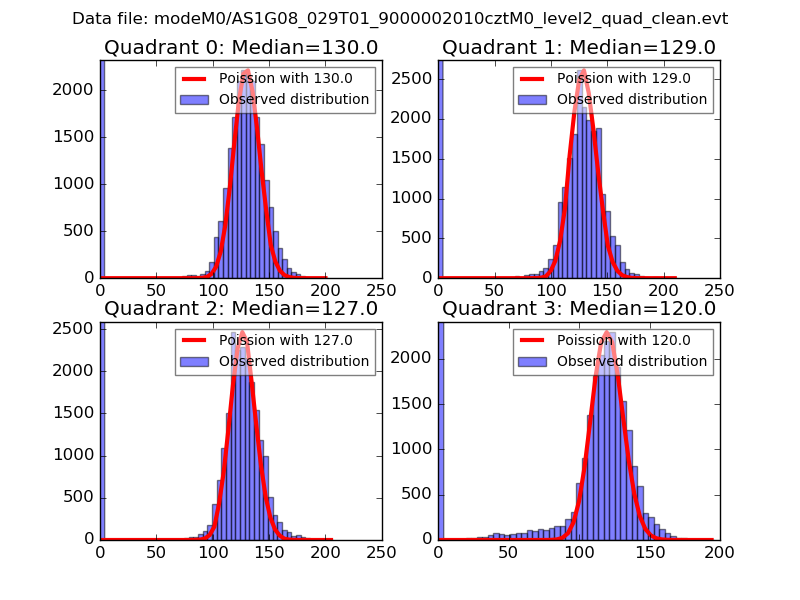 |
 |
| Quadrant-wise count rates Data is divided into 100 sec bins |
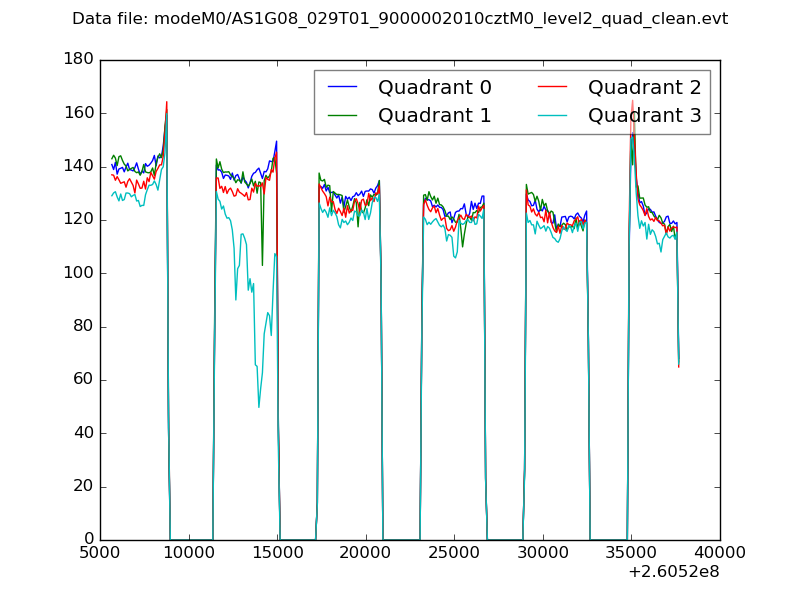 |
|
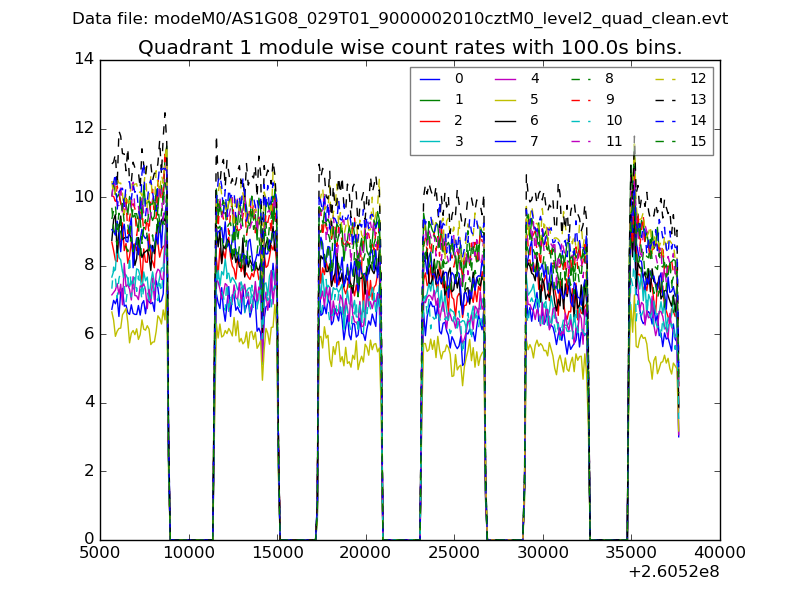
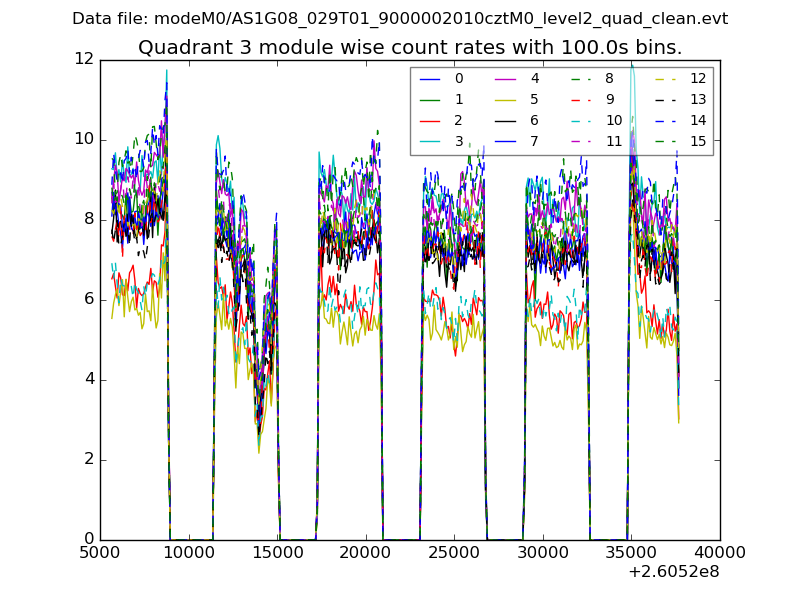
| Module-wise count rates for Quadrant A Data is divided into 100 sec bins |
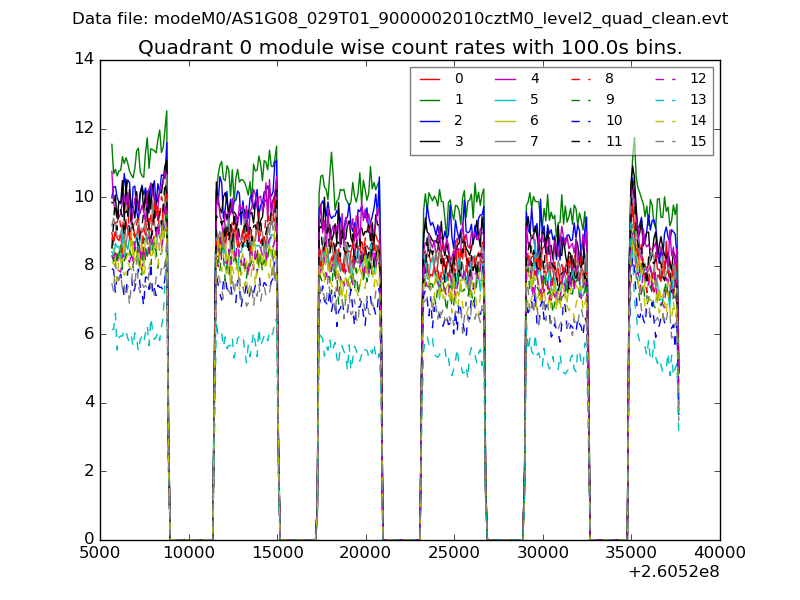 |
 |
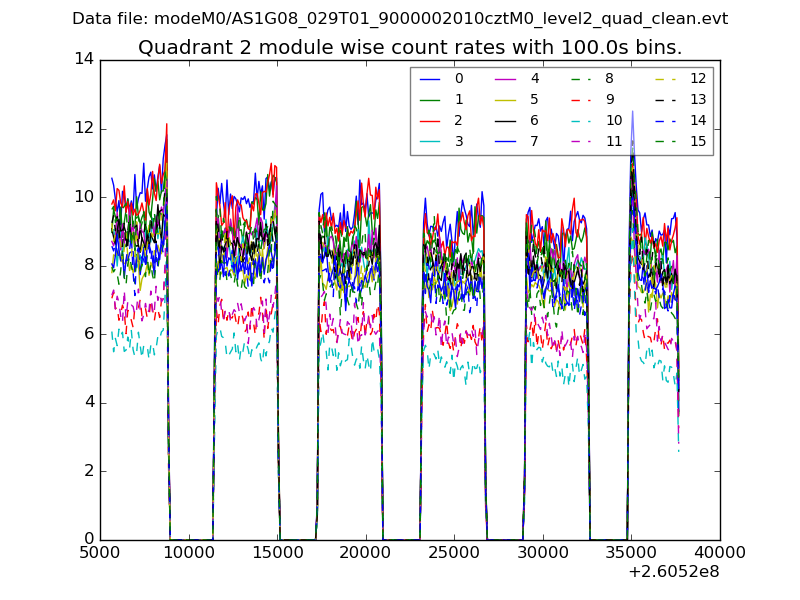
| Module-wise count rates for Quadrant B Data is divided into 100 sec bins |
 |
 |
| Module-wise count rates for Quadrant C Data is divided into 100 sec bins |
 |
 |
| Module-wise count rates for Quadrant D Data is divided into 100 sec bins |
 |
 |
| Parameter | Plot |
|---|---|
| CZT HV Monitor | 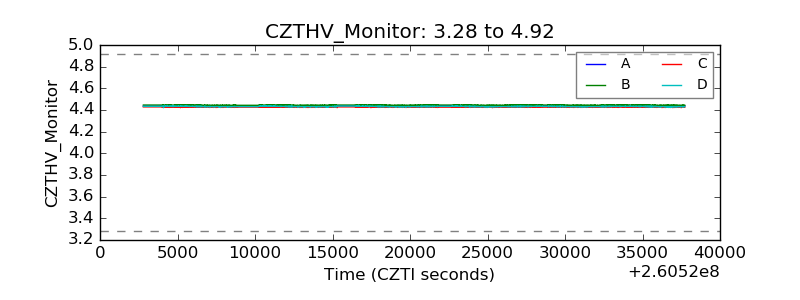 |
| D_VDD | 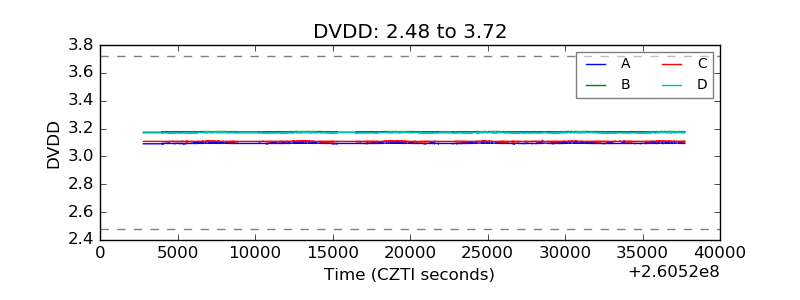 |
| Temperature 1 | 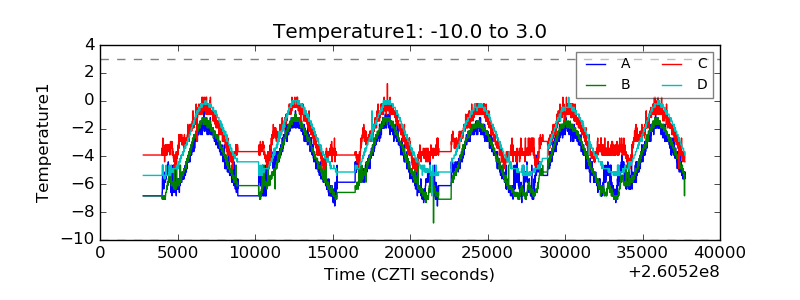 |
| Veto HV Monitor | 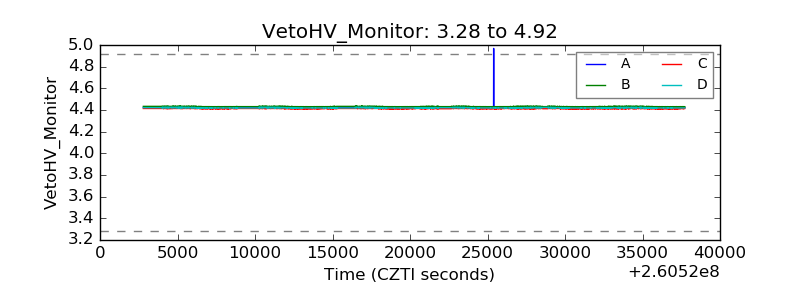 |
| Veto LLD | 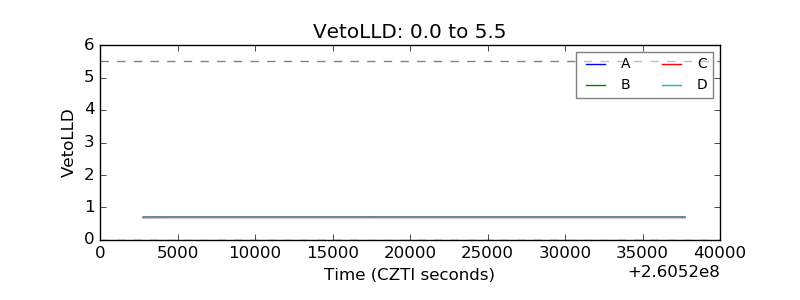 |
| Alpha Counter | 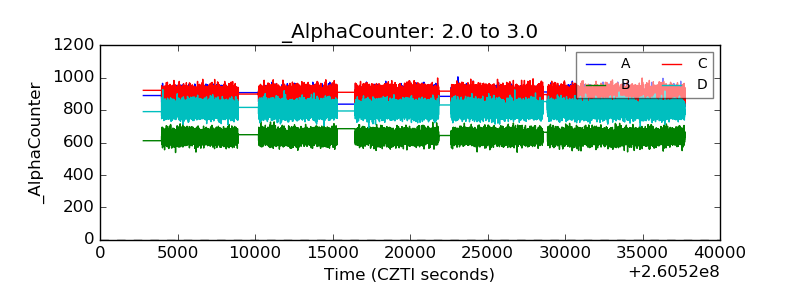 |
| _CPM_Rate | 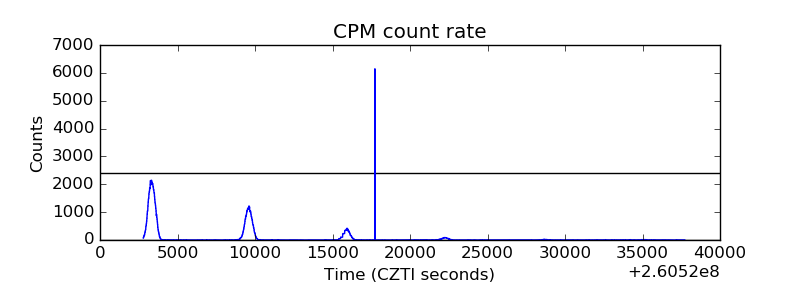 |
| CZT Counter | 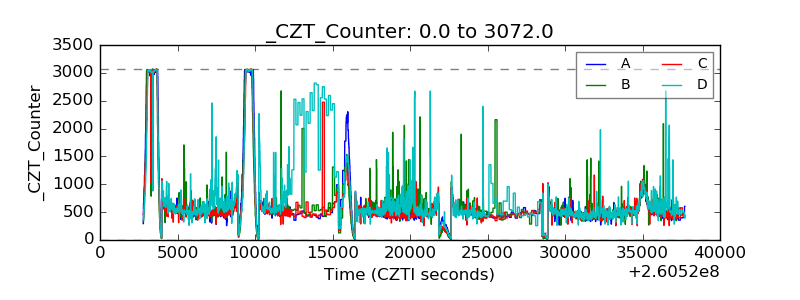 |
| +2.5 Volts monitor | 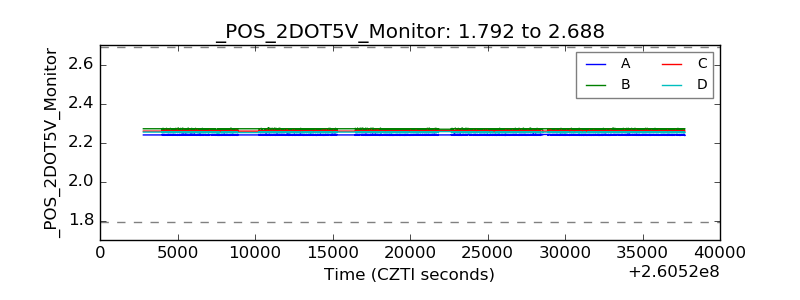 |
| +5 Volts monitor | 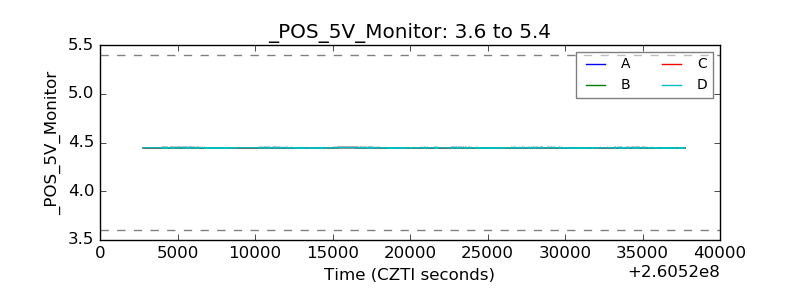 |
| _ROLL_ROT | 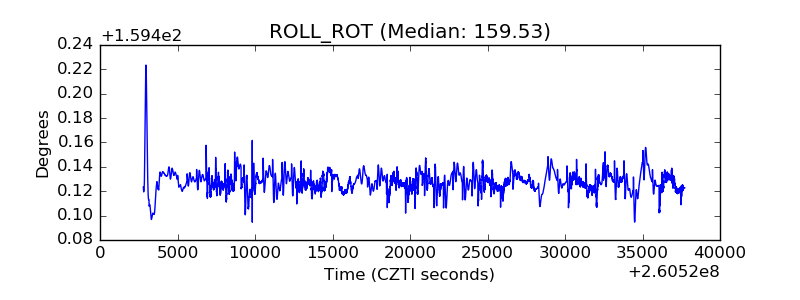 |
| _Roll_DEC | 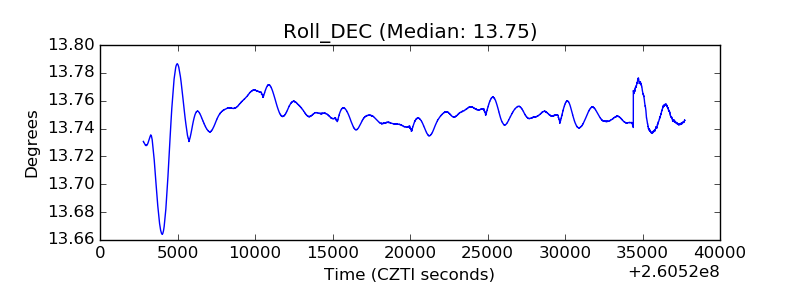 |
| _Roll_RA | 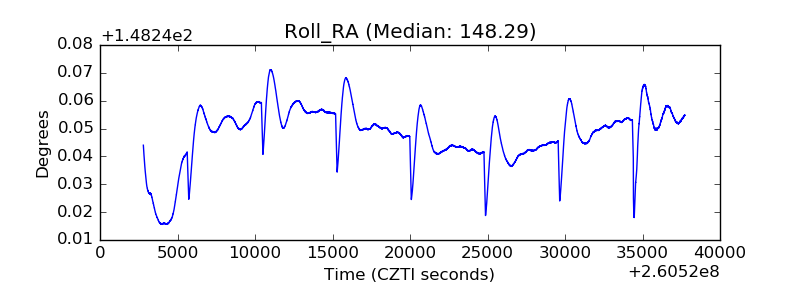 |
| Veto Counter | 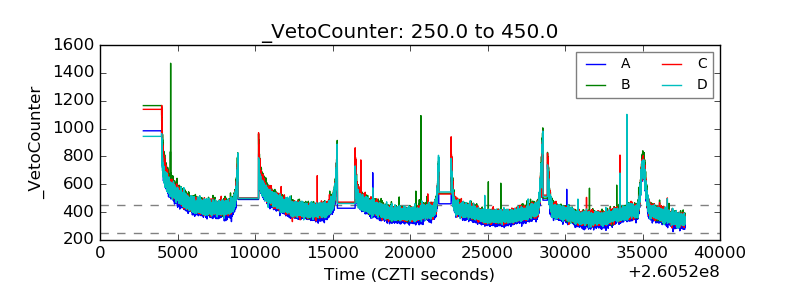 |