| Param | Original file | Final file |
|---|---|---|
| Filename | modeM0/AS1G08_029T01_9000002010_13607cztM0_level2.evt | modeM0/AS1G08_029T01_9000002010_13607cztM0_level2_quad_clean.evt |
| Size (bytes) | 641,934,720 | 83,062,080 |
| Size | 612.2 MB | 79.2 MB |
| Events in quadrant A | 3,353,637 | 557,094 |
| Events in quadrant B | 3,781,085 | 550,780 |
| Events in quadrant C | 3,370,039 | 539,298 |
| Events in quadrant D | 8,499,060 | 416,932 |
| Mode M9 | |||
|---|---|---|---|
| Quadrant | BADHDUFLAG | Total packets | Discarded packets |
| A | 0 | 17 | 0 |
| B | 0 | 17 | 0 |
| C | 0 | 17 | 0 |
| D | 0 | 18 | 0 |
| Mode SS | |||
|---|---|---|---|
| Quadrant | BADHDUFLAG | Total packets | Discarded packets |
| A | 0 | 132 | 0 |
| B | 0 | 132 | 0 |
| C | 0 | 132 | 0 |
| D | 0 | 132 | 0 |
| Mode M0 | |||
|---|---|---|---|
| Quadrant | BADHDUFLAG | Total packets | Discarded packets |
| A | 0 | 13729 | 3 |
| B | 0 | 15043 | 2 |
| C | 0 | 13791 | 2 |
| D | 0 | 29406 | 2 |
| Quadrant | Total seconds | Saturated seconds | Saturation percentage |
|---|---|---|---|
| A | 6452 | 139 | 2.154371% |
| B | 6452 | 197 | 3.053317% |
| C | 6452 | 101 | 1.565406% |
| D | 6452 | 1921 | 29.773714% |
Noise dominated data is calculated using 1-second bins in cleaned event files. If a bin has >2000 counts, and if more than 50% of those come from <1% of pixels, then it is considered to be noise-dominated and hence unusable.
| Quadrant | # 1 sec bins | Bins with >0 counts | Bins with >2000 counts | High rate bins dominated by noise | Noise dominated (total time) | Noise dominated (detector-on time) | Marked lightcurve |
|---|---|---|---|---|---|---|---|
| A | 7603 | 6454 | 0 | 0 | 0.00% | 0.00% | 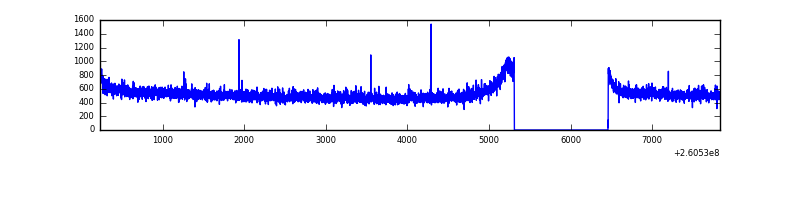 |
| B | 7603 | 6454 | 37 | 37 | 0.49% | 0.57% | 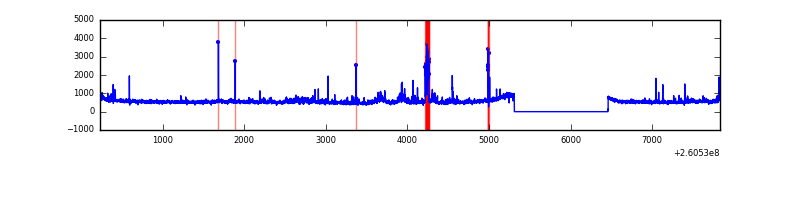 |
| C | 7603 | 6454 | 10 | 10 | 0.13% | 0.15% | 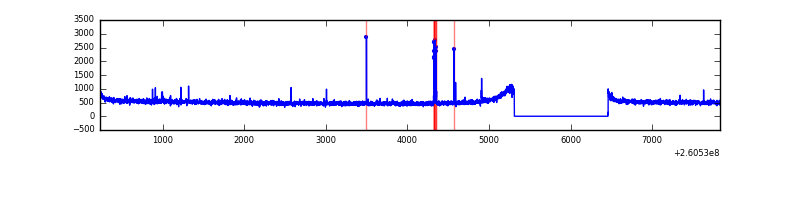 |
| D | 7603 | 6454 | 1882 | 1882 | 24.75% | 29.16% | 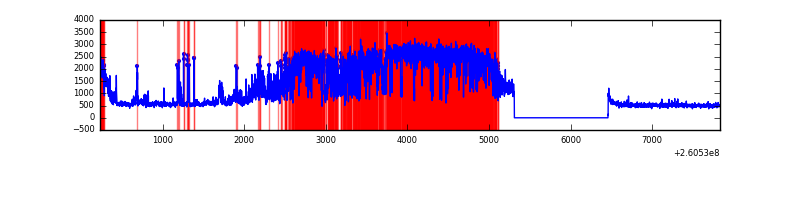 |
Top three noisy pixels from each quadrant. If the there are fewer than three noisy pixels in the level2.evt file, extra rows are filled as -1
| Pixel properties | Quadrant properties | ||||||
|---|---|---|---|---|---|---|---|
| Quadrant | DetID | PixID | Counts | Sigma | Mean | Median | Sigma |
| A | 1 | 162 | 11678 | 61.33 | 864 | 847 | 176.6 |
| A | 2 | 250 | 10978 | 57.37 | 864 | 847 | 176.6 |
| A | 0 | 226 | 7802 | 39.38 | 864 | 847 | 176.6 |
| B | 0 | 219 | 166397 | 1024.09 | 848 | 827 | 161.7 |
| B | 0 | 182 | 102577 | 629.35 | 848 | 827 | 161.7 |
| B | 3 | 64 | 45606 | 276.97 | 848 | 827 | 161.7 |
| C | 3 | 233 | 105418 | 551.8 | 822 | 828 | 189.5 |
| C | 14 | 234 | 46585 | 241.4 | 822 | 828 | 189.5 |
| C | 0 | 207 | 6158 | 28.12 | 822 | 828 | 189.5 |
| D | 13 | 122 | 4739259 | 26202.74 | 752 | 731 | 180.8 |
| D | 8 | 195 | 477938 | 2638.82 | 752 | 731 | 180.8 |
| D | 5 | 222 | 365416 | 2016.61 | 752 | 731 | 180.8 |
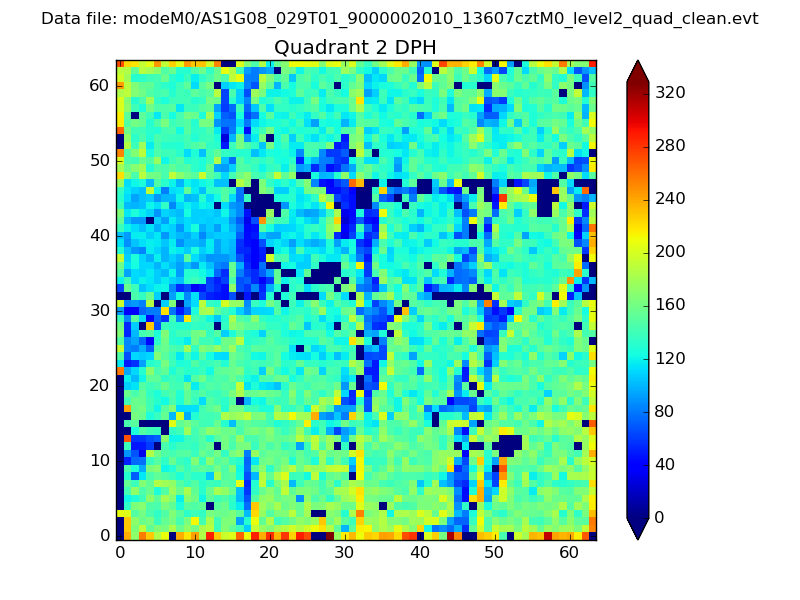
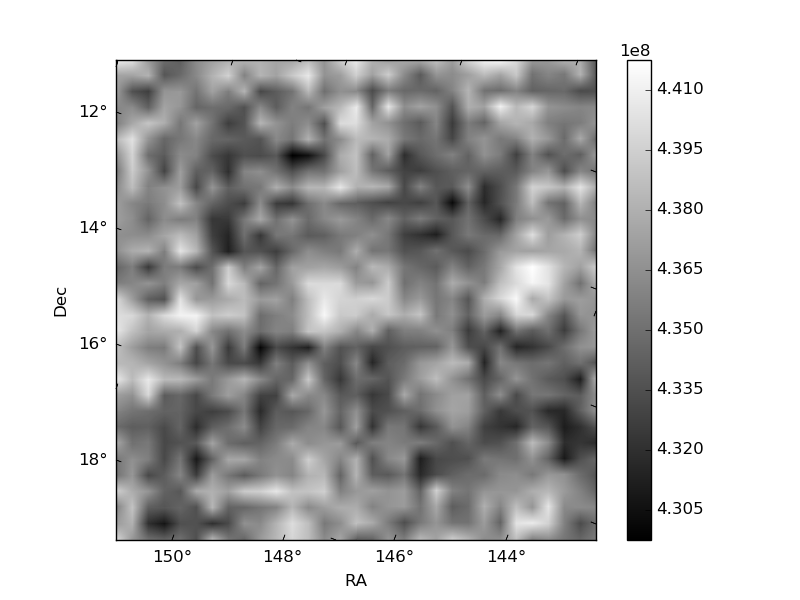
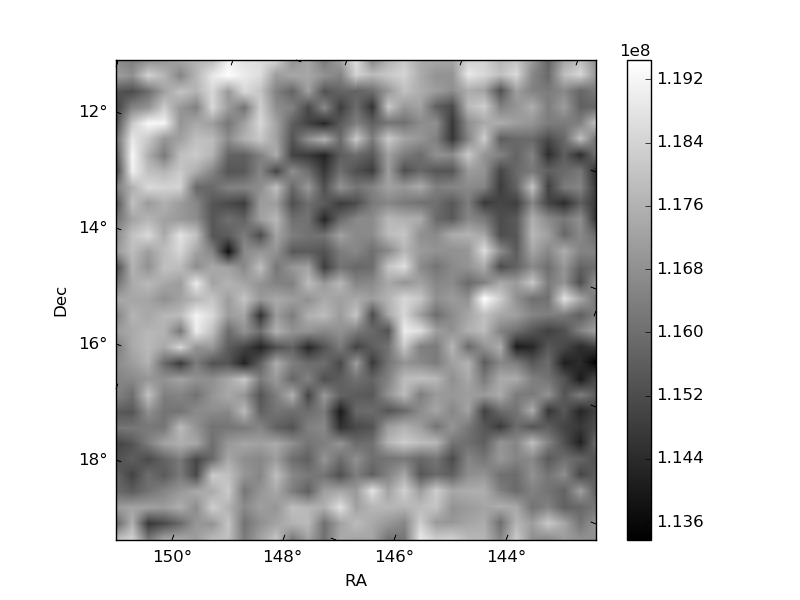
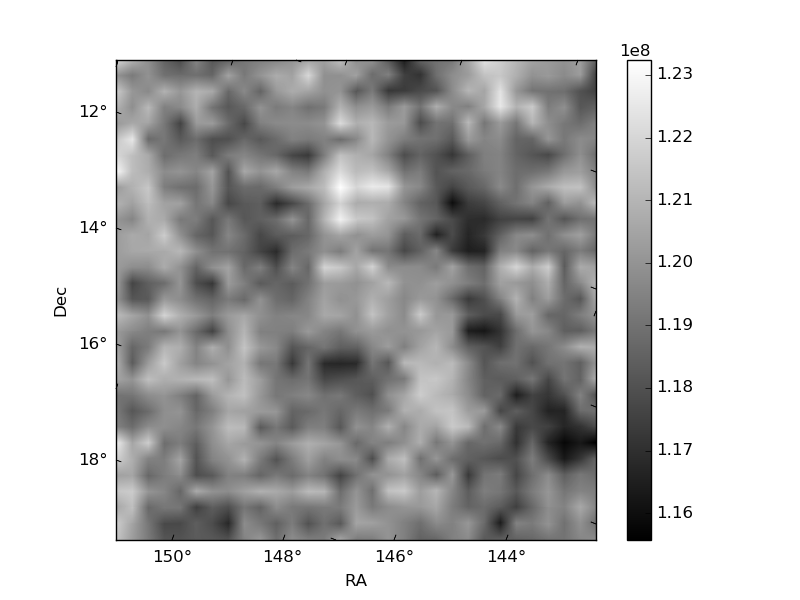
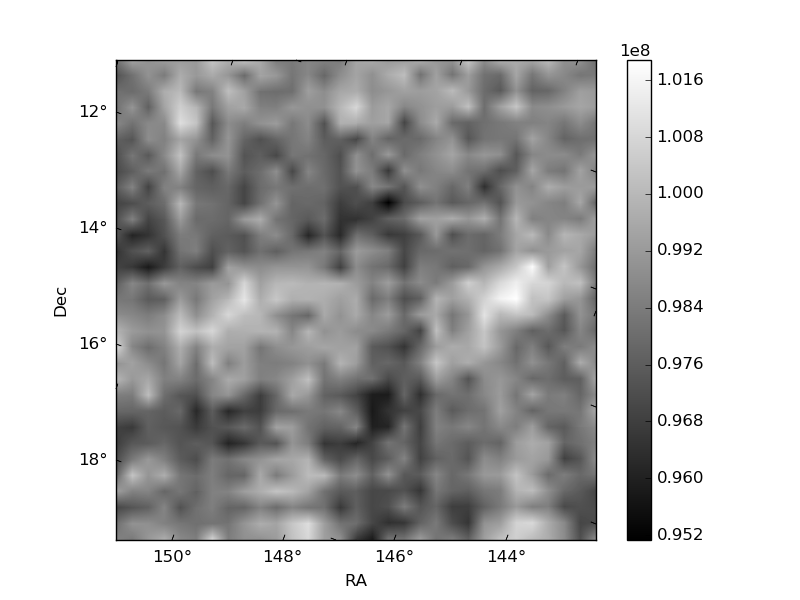
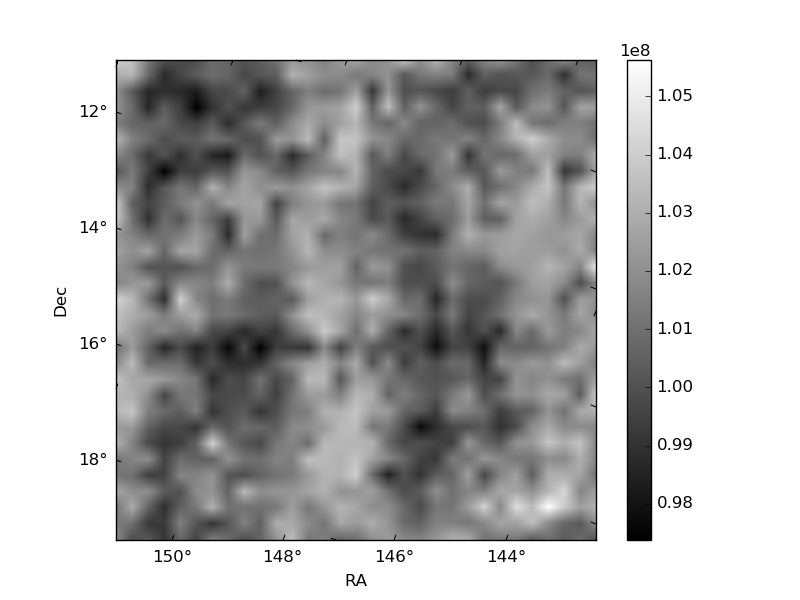
Histogram calculated using DETX and DETY for each event in the final _common_clean file
| Quadrant A | 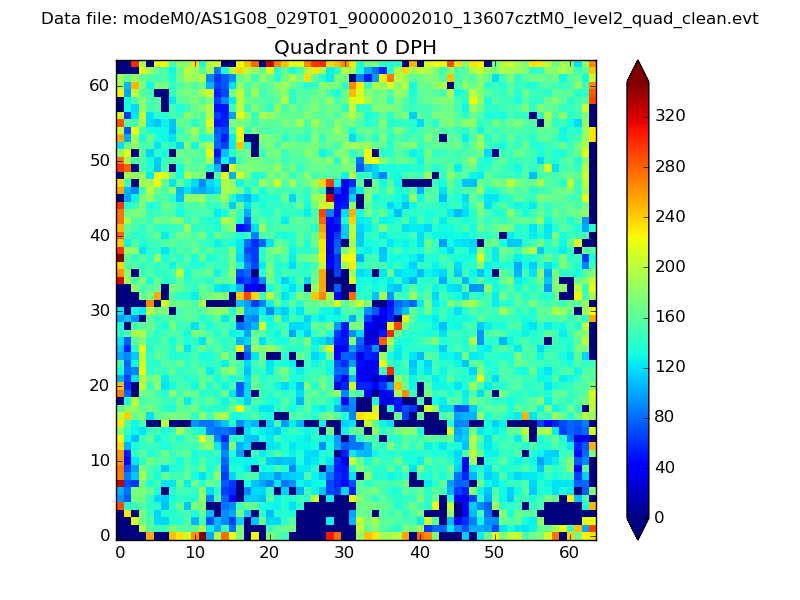 |
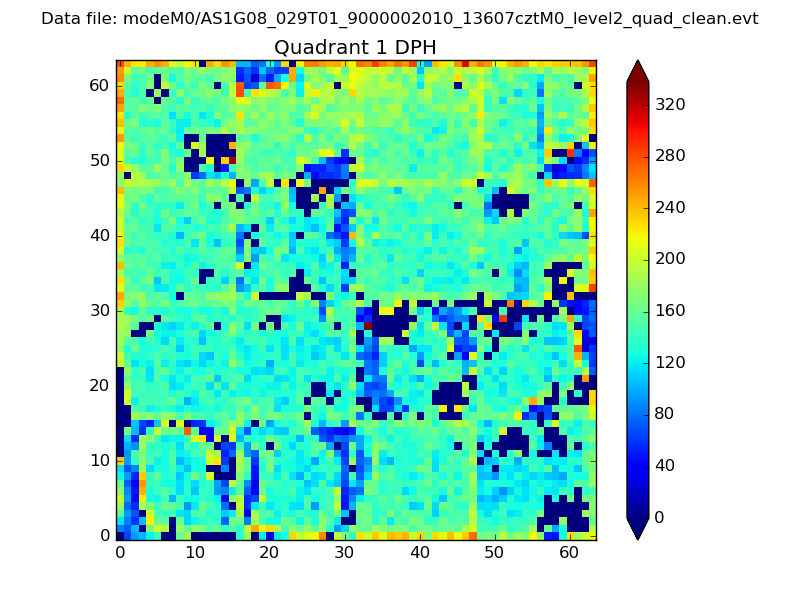 |
Quadrant B |
|---|---|---|---|
| Quadrant D | 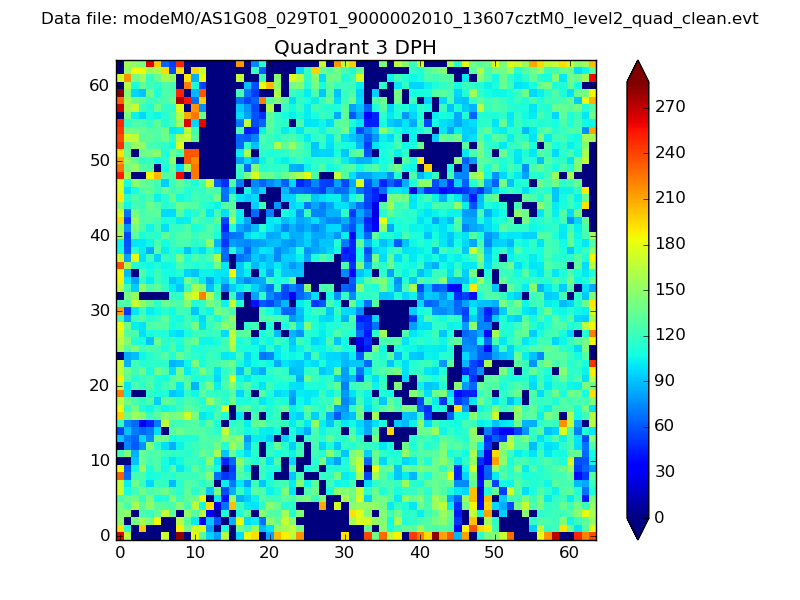 |
 |
Quadrant C |
| Plot type | Count rate plots | Images |
|---|---|---|
| Comparison with Poisson distribution Blue bars denote a histogram of data divided into 1 sec bins. Red curve is a Poisson curve with rate = median count rate of data. |
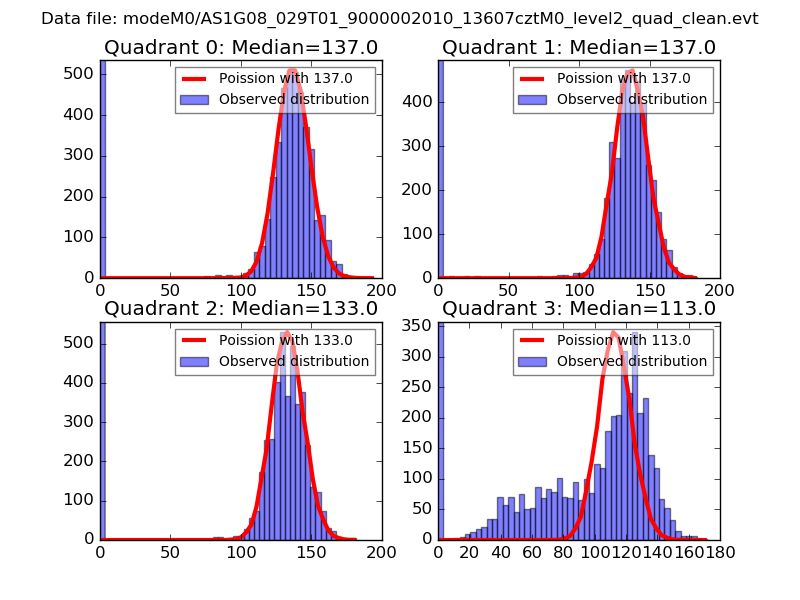 |
 |
| Quadrant-wise count rates Data is divided into 100 sec bins |
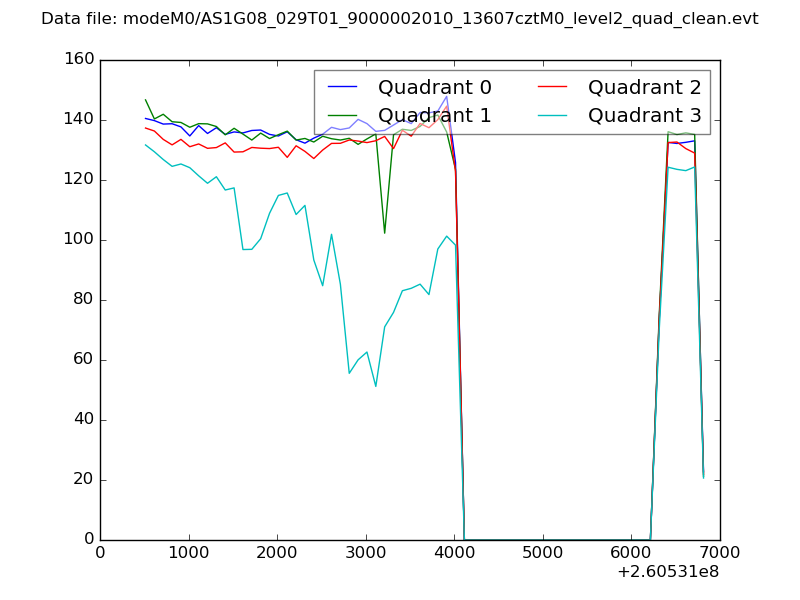 |
|
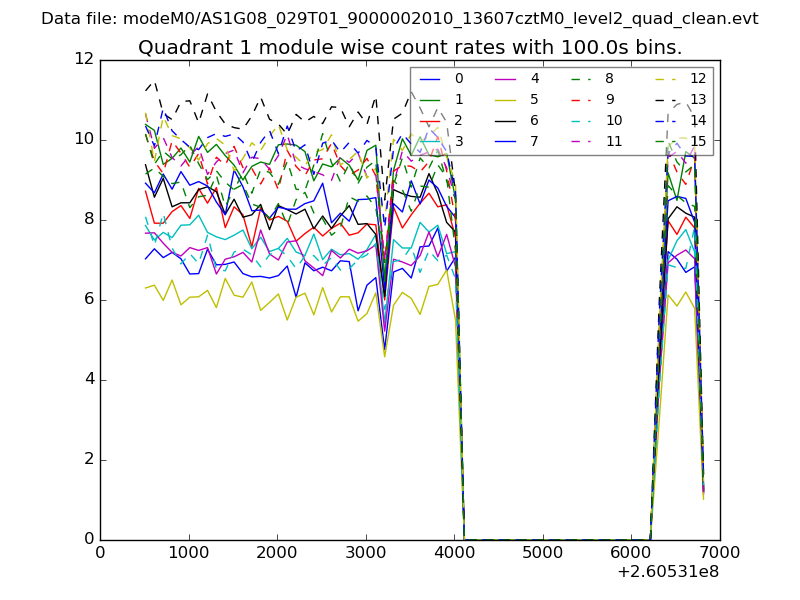
| Module-wise count rates for Quadrant A Data is divided into 100 sec bins |
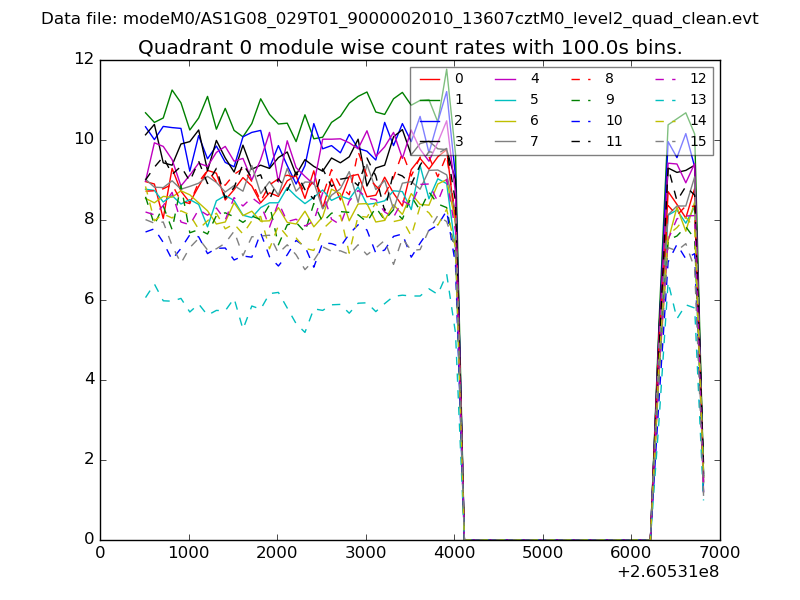 |
 |
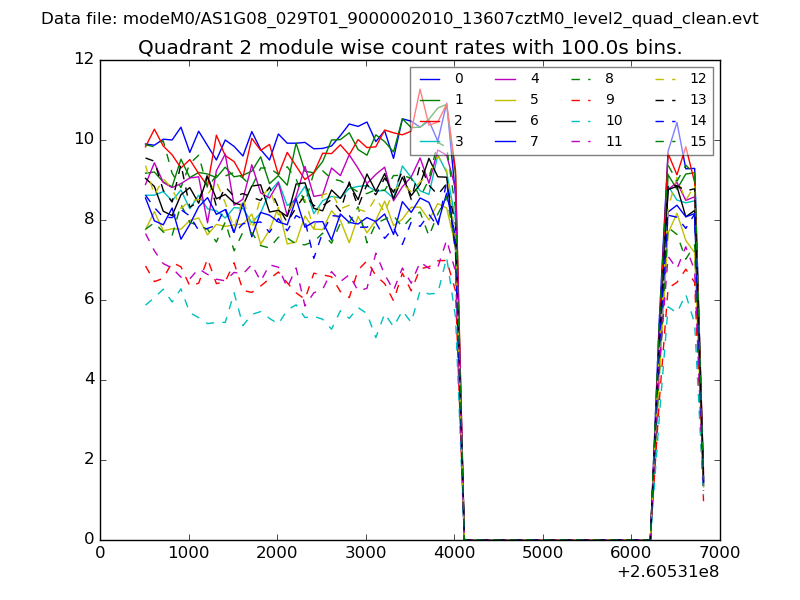
| Module-wise count rates for Quadrant B Data is divided into 100 sec bins |
 |
 |
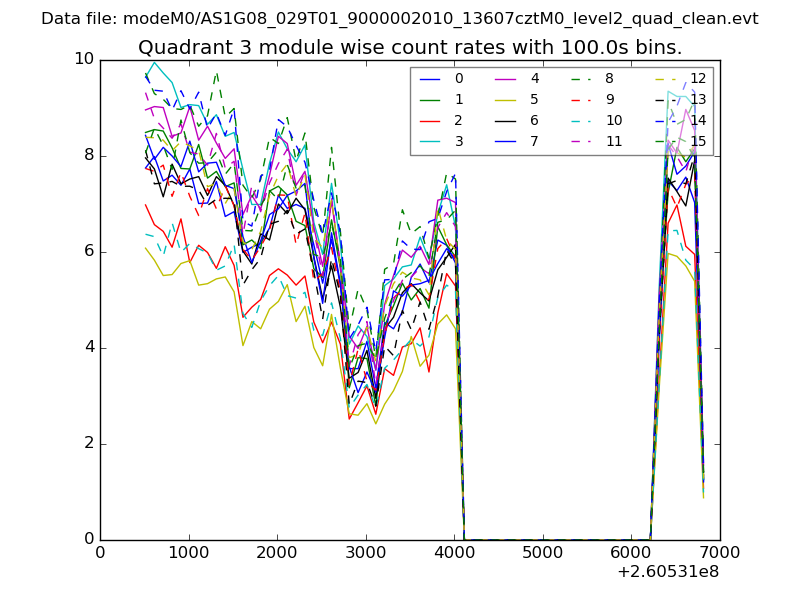
| Module-wise count rates for Quadrant C Data is divided into 100 sec bins |
 |
 |
| Module-wise count rates for Quadrant D Data is divided into 100 sec bins |
 |
 |
| Parameter | Plot |
|---|---|
| CZT HV Monitor | 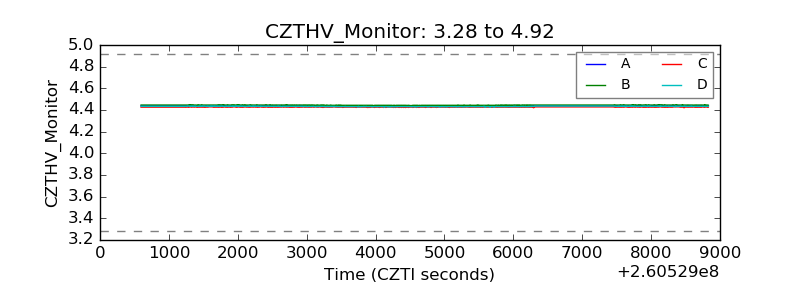 |
| D_VDD | 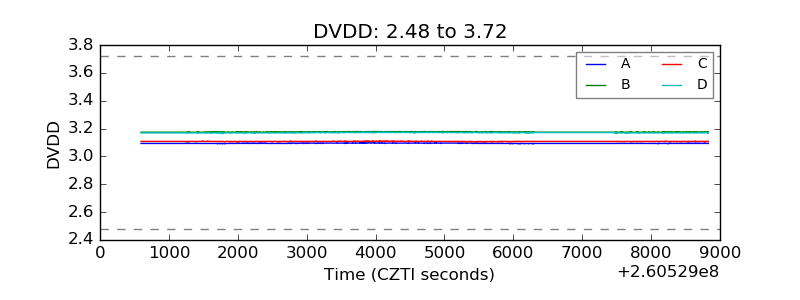 |
| Temperature 1 | 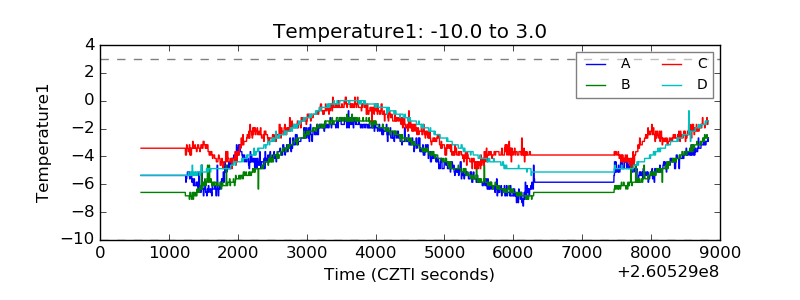 |
| Veto HV Monitor |  |
| Veto LLD | 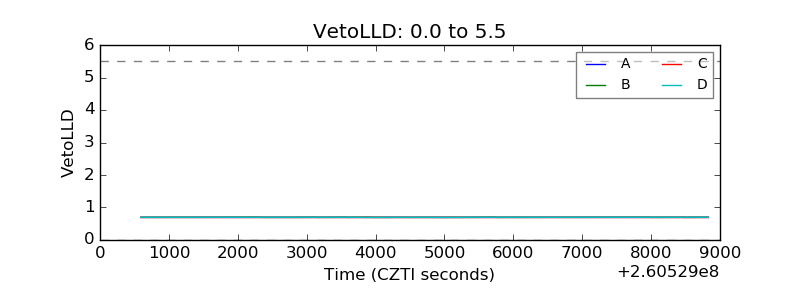 |
| Alpha Counter | 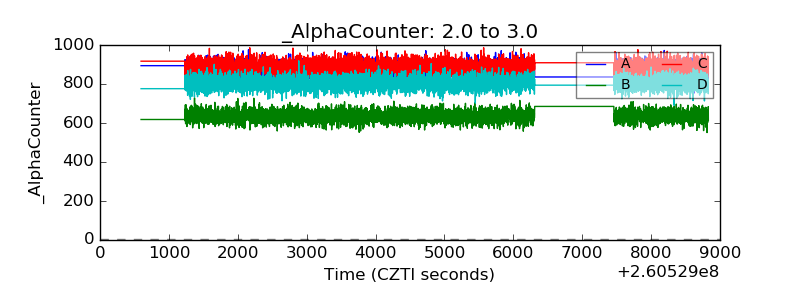 |
| _CPM_Rate |  |
| CZT Counter | 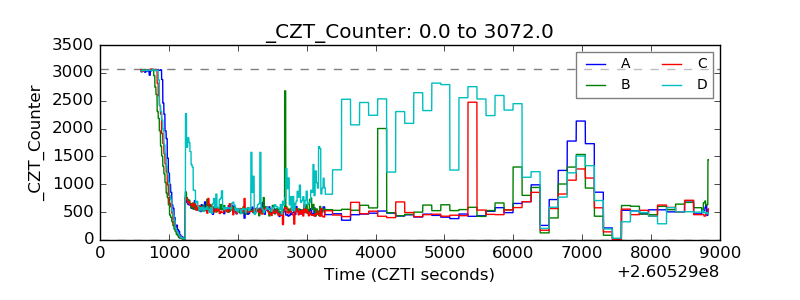 |
| +2.5 Volts monitor |  |
| +5 Volts monitor | 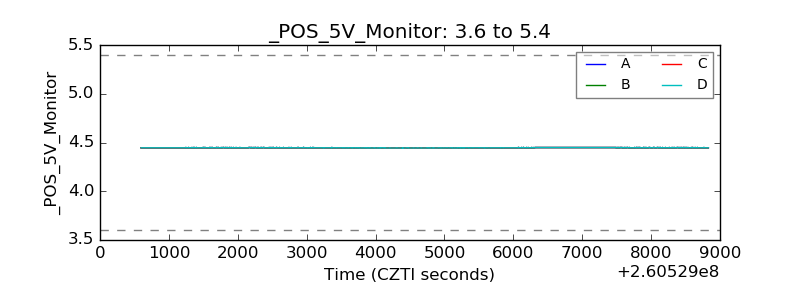 |
| _ROLL_ROT | 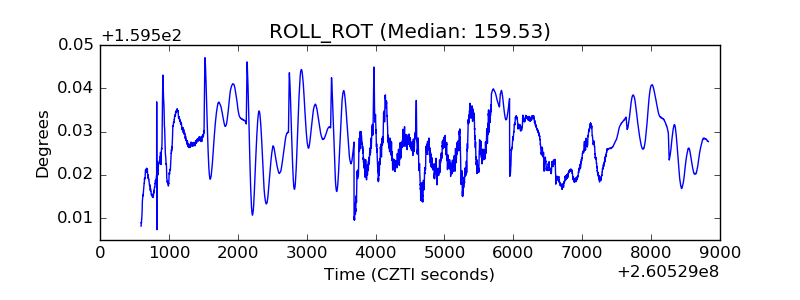 |
| _Roll_DEC | 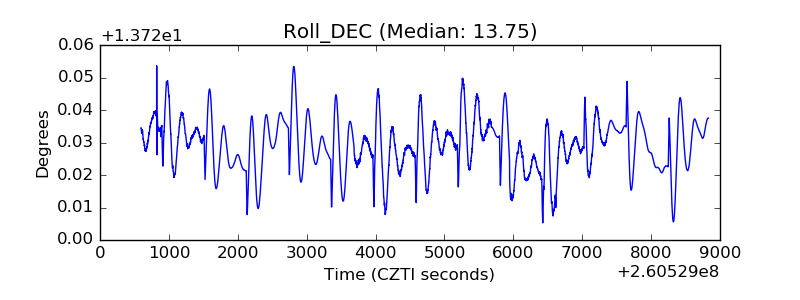 |
| _Roll_RA | 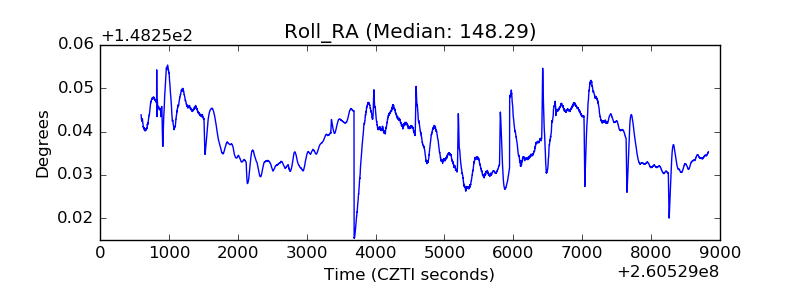 |
| Veto Counter | 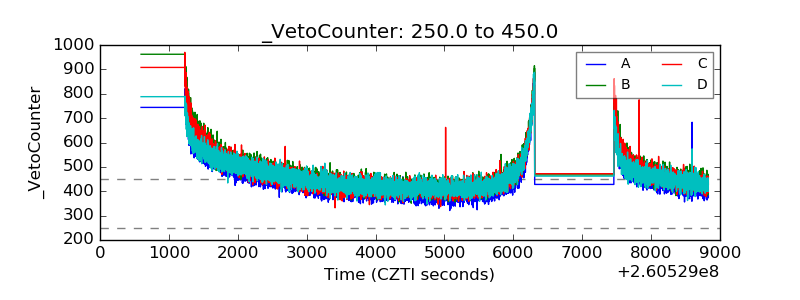 |