| Param | Original file | Final file |
|---|---|---|
| Filename | modeM0/AS1G08_029T01_9000002010_13608cztM0_level2.evt | modeM0/AS1G08_029T01_9000002010_13608cztM0_level2_quad_clean.evt |
| Size (bytes) | 509,538,240 | 91,595,520 |
| Size | 485.9 MB | 87.4 MB |
| Events in quadrant A | 3,399,482 | 586,245 |
| Events in quadrant B | 4,155,524 | 580,770 |
| Events in quadrant C | 3,451,379 | 572,695 |
| Events in quadrant D | 3,957,763 | 554,531 |
| Mode M9 | |||
|---|---|---|---|
| Quadrant | BADHDUFLAG | Total packets | Discarded packets |
| A | 0 | 8 | 0 |
| B | 0 | 8 | 0 |
| C | 0 | 8 | 0 |
| D | 0 | 8 | 0 |
| Mode SS | |||
|---|---|---|---|
| Quadrant | BADHDUFLAG | Total packets | Discarded packets |
| A | 0 | 140 | 0 |
| B | 0 | 140 | 0 |
| C | 0 | 140 | 0 |
| D | 0 | 140 | 0 |
| Mode M0 | |||
|---|---|---|---|
| Quadrant | BADHDUFLAG | Total packets | Discarded packets |
| A | 0 | 14284 | 3 |
| B | 0 | 16548 | 2 |
| C | 0 | 14368 | 2 |
| D | 0 | 15840 | 2 |
| Quadrant | Total seconds | Saturated seconds | Saturation percentage |
|---|---|---|---|
| A | 6880 | 140 | 2.034884% |
| B | 6880 | 222 | 3.226744% |
| C | 6880 | 110 | 1.598837% |
| D | 6881 | 140 | 2.034588% |
Noise dominated data is calculated using 1-second bins in cleaned event files. If a bin has >2000 counts, and if more than 50% of those come from <1% of pixels, then it is considered to be noise-dominated and hence unusable.
| Quadrant | # 1 sec bins | Bins with >0 counts | Bins with >2000 counts | High rate bins dominated by noise | Noise dominated (total time) | Noise dominated (detector-on time) | Marked lightcurve |
|---|---|---|---|---|---|---|---|
| A | 7686 | 6882 | 0 | 0 | 0.00% | 0.00% | 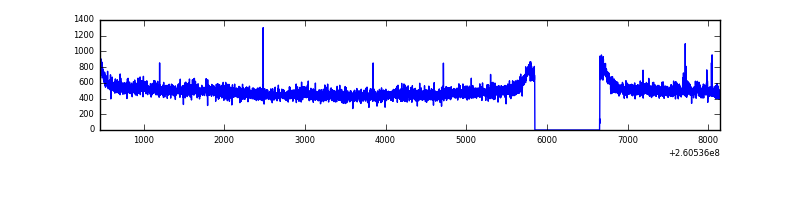 |
| B | 7686 | 6882 | 28 | 28 | 0.36% | 0.41% | 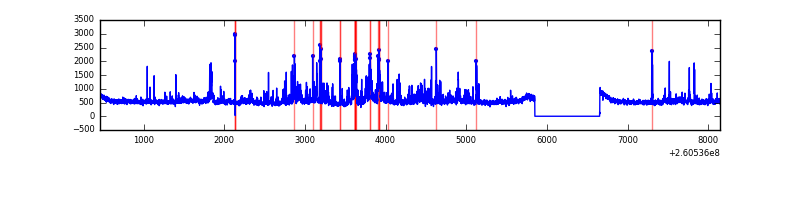 |
| C | 7686 | 6882 | 7 | 7 | 0.09% | 0.10% | 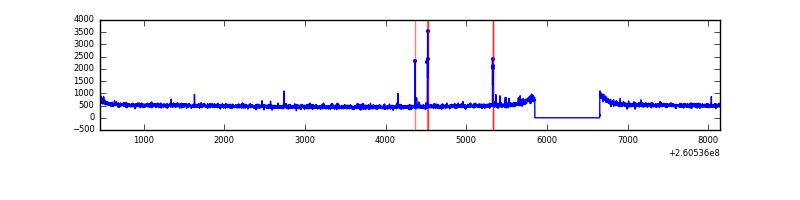 |
| D | 7687 | 6883 | 23 | 23 | 0.30% | 0.33% | 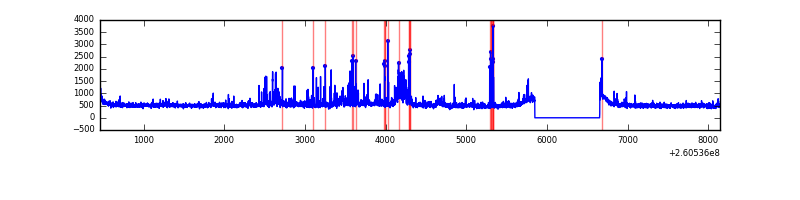 |
Top three noisy pixels from each quadrant. If the there are fewer than three noisy pixels in the level2.evt file, extra rows are filled as -1
| Pixel properties | Quadrant properties | ||||||
|---|---|---|---|---|---|---|---|
| Quadrant | DetID | PixID | Counts | Sigma | Mean | Median | Sigma |
| A | 1 | 162 | 18822 | 100.67 | 872 | 854 | 178.5 |
| A | 2 | 250 | 18207 | 97.22 | 872 | 854 | 178.5 |
| A | 0 | 226 | 7945 | 39.73 | 872 | 854 | 178.5 |
| B | 0 | 219 | 420686 | 2543.04 | 860 | 837 | 165.1 |
| B | 0 | 85 | 113865 | 684.61 | 860 | 837 | 165.1 |
| B | 3 | 209 | 46993 | 279.57 | 860 | 837 | 165.1 |
| C | 3 | 233 | 152546 | 780.98 | 836 | 841 | 194.3 |
| C | 14 | 234 | 20001 | 98.64 | 836 | 841 | 194.3 |
| C | 0 | 207 | 19097 | 93.98 | 836 | 841 | 194.3 |
| D | 8 | 195 | 363303 | 1797.54 | 844 | 823 | 201.7 |
| D | 13 | 122 | 212809 | 1051.24 | 844 | 823 | 201.7 |
| D | 13 | 249 | 62665 | 306.68 | 844 | 823 | 201.7 |
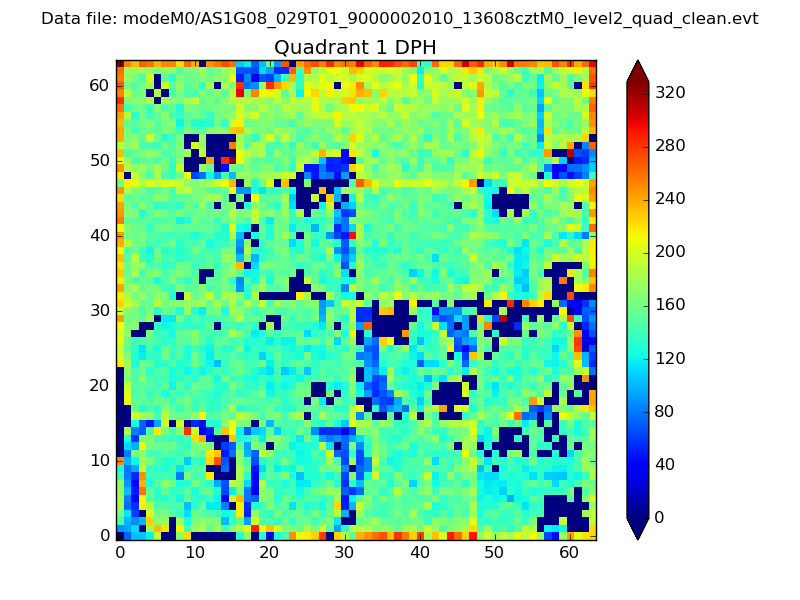
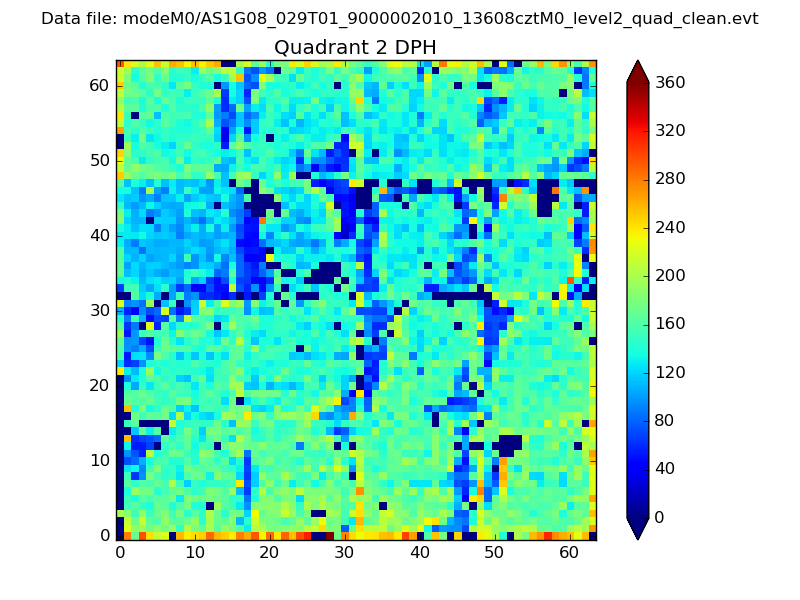
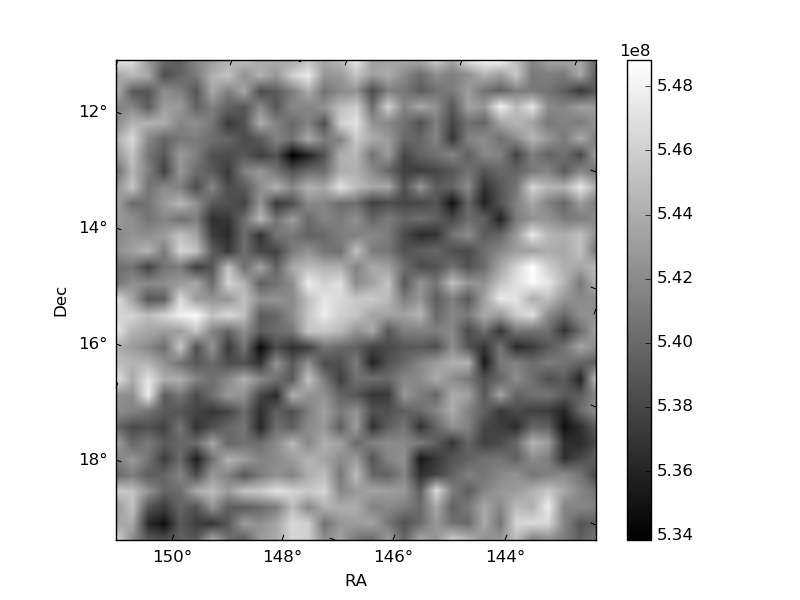
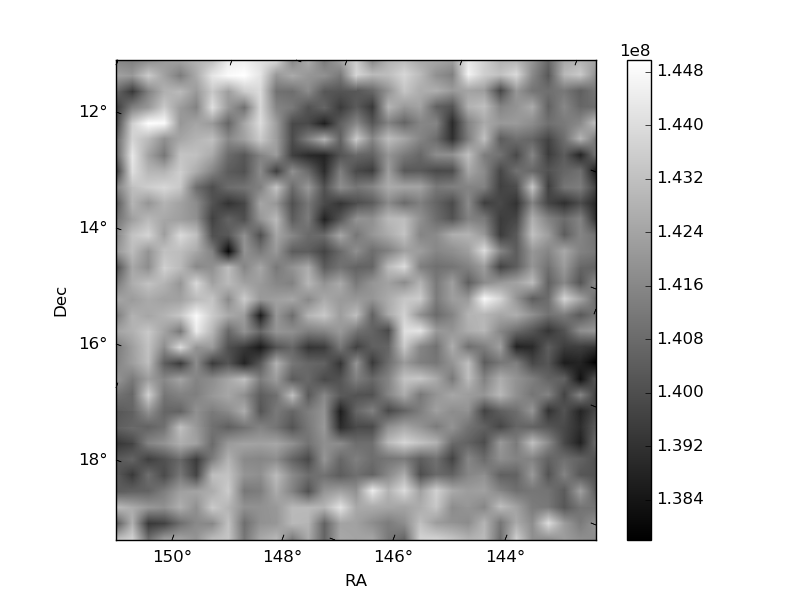
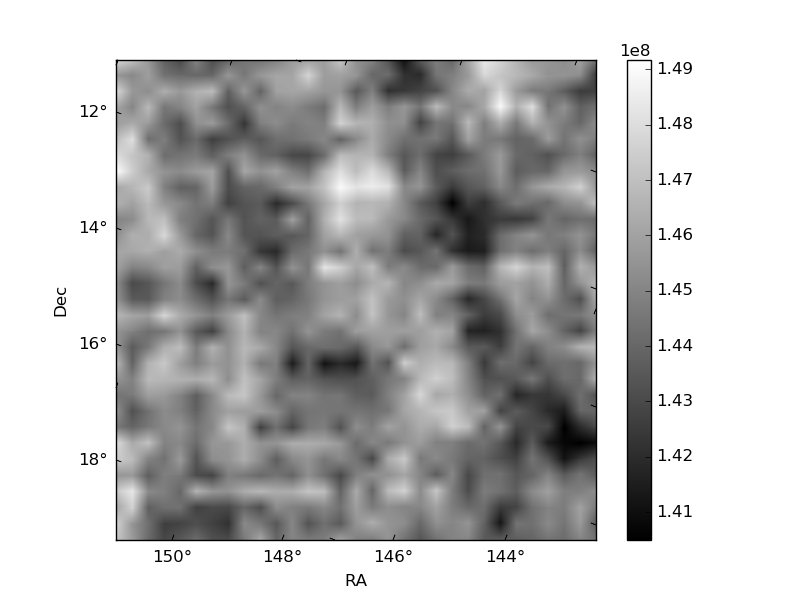
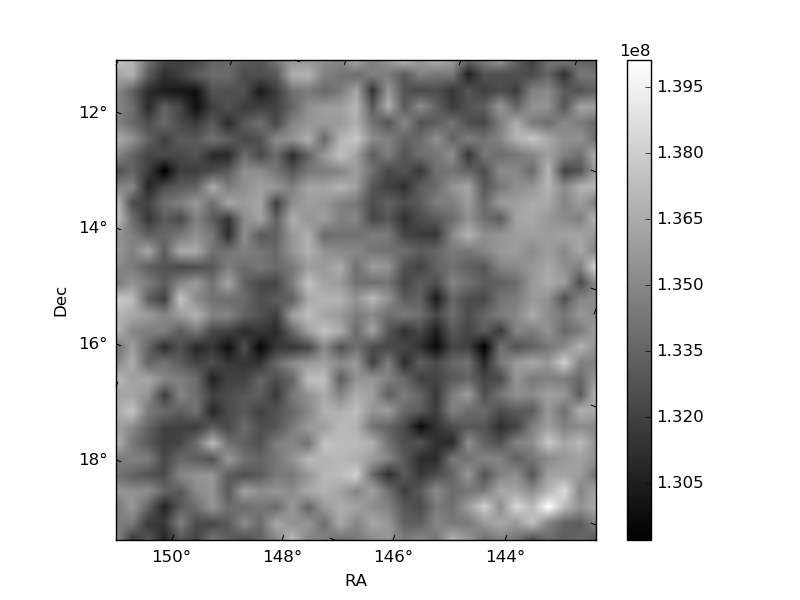
Histogram calculated using DETX and DETY for each event in the final _common_clean file
| Quadrant A |  |
 |
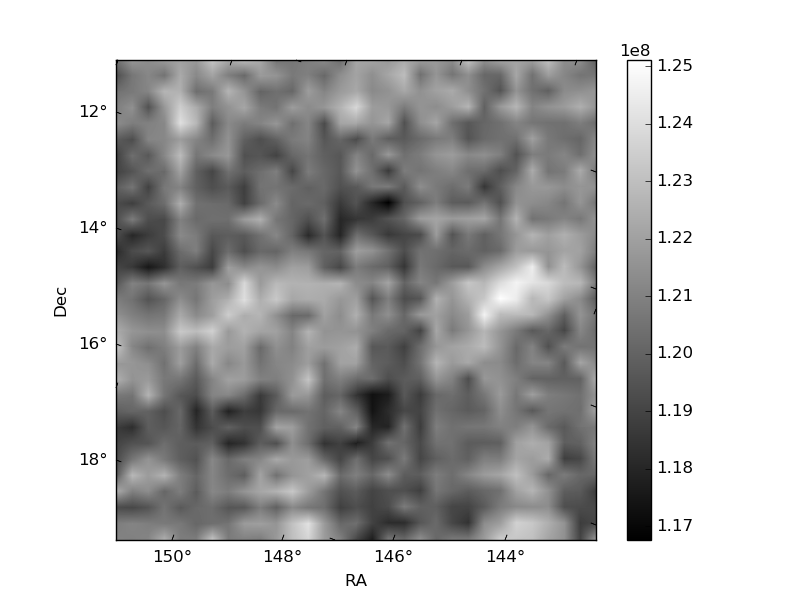
Quadrant B |
|---|---|---|---|
| Quadrant D | 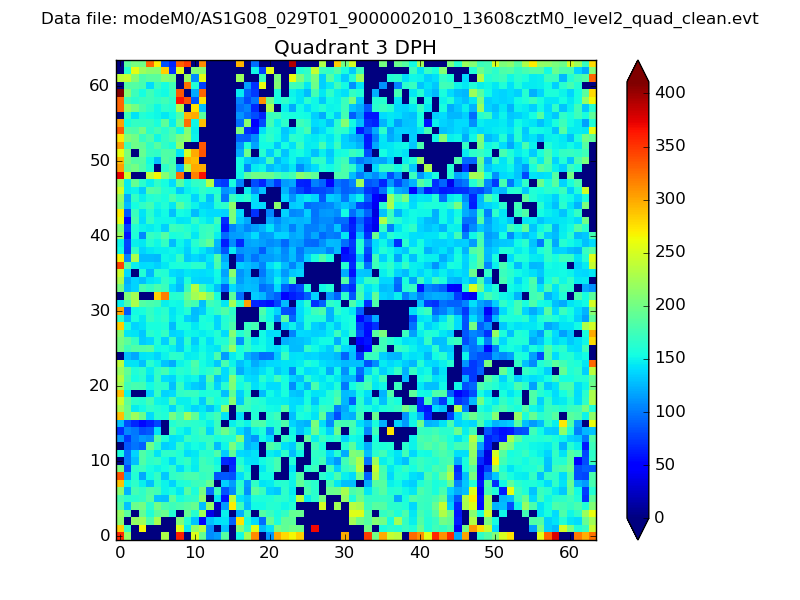 |
 |
Quadrant C |
| Plot type | Count rate plots | Images |
|---|---|---|
| Comparison with Poisson distribution Blue bars denote a histogram of data divided into 1 sec bins. Red curve is a Poisson curve with rate = median count rate of data. |
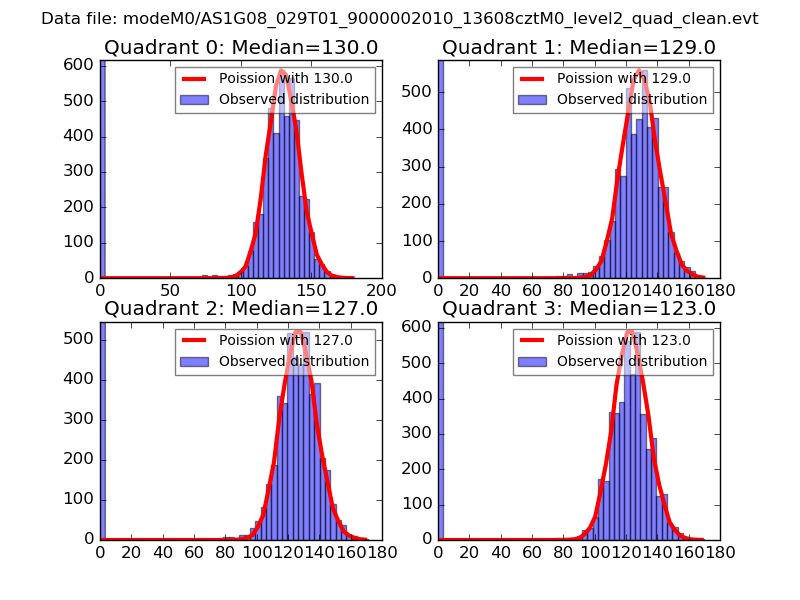 |
 |
| Quadrant-wise count rates Data is divided into 100 sec bins |
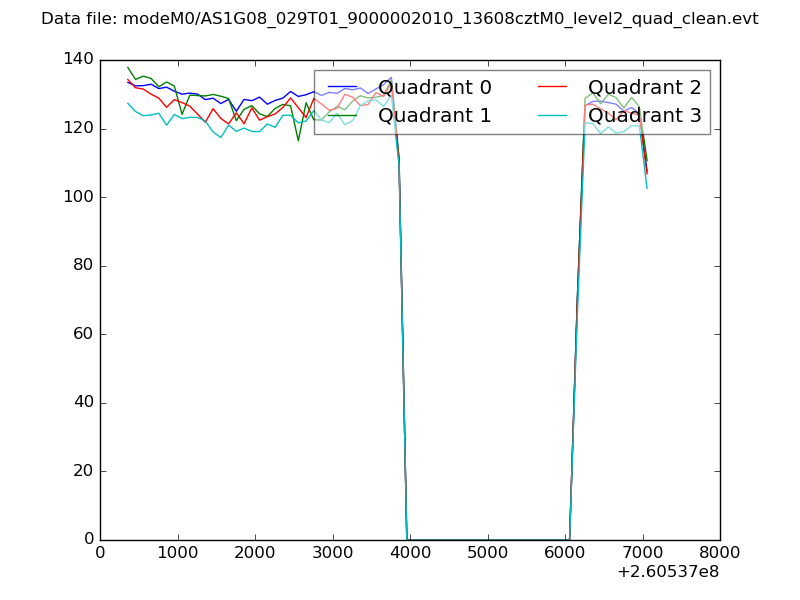 |
|
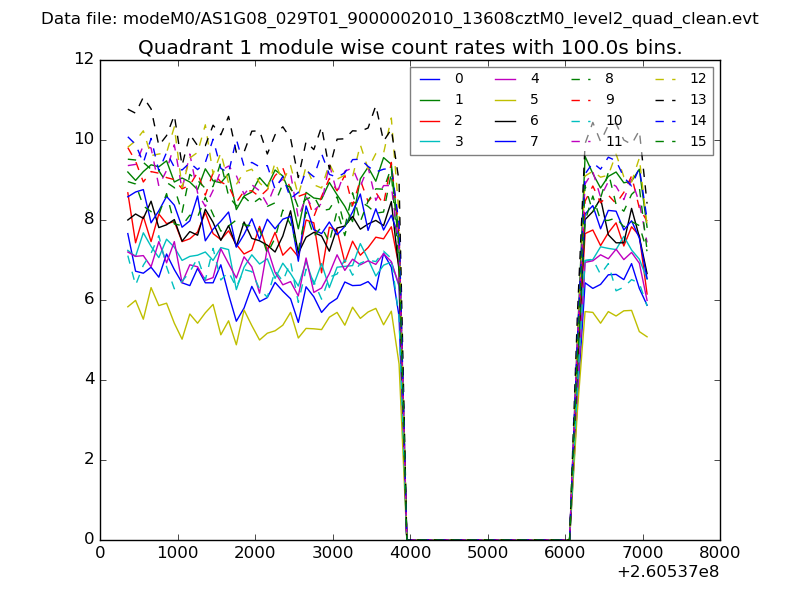
| Module-wise count rates for Quadrant A Data is divided into 100 sec bins |
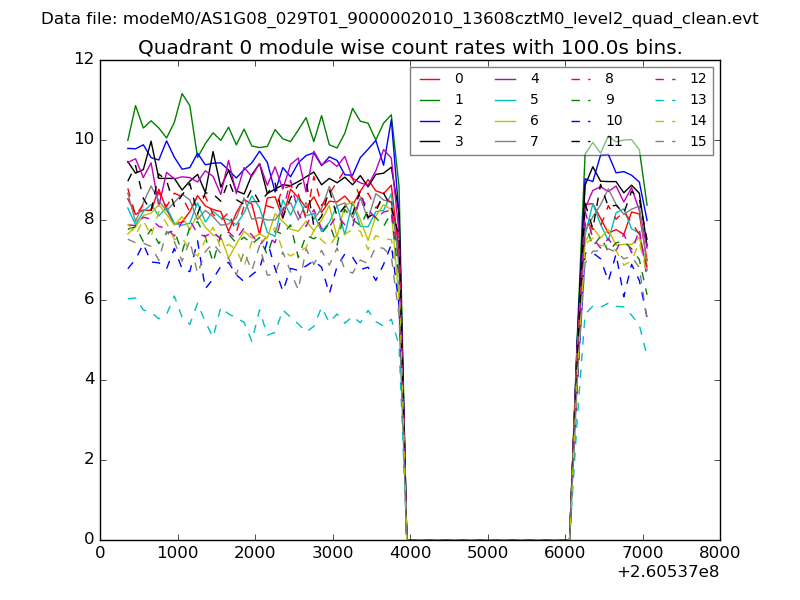 |
 |
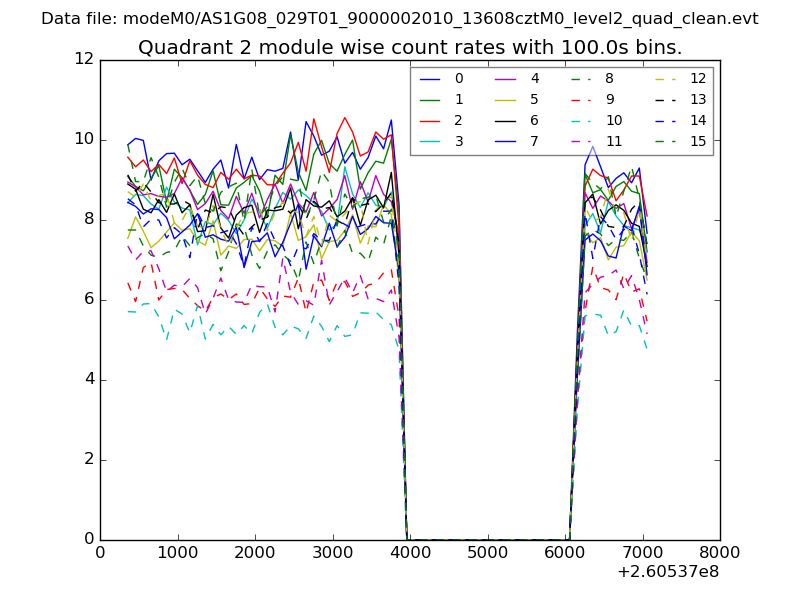
| Module-wise count rates for Quadrant B Data is divided into 100 sec bins |
 |
 |
| Module-wise count rates for Quadrant C Data is divided into 100 sec bins |
 |
 |
| Module-wise count rates for Quadrant D Data is divided into 100 sec bins |
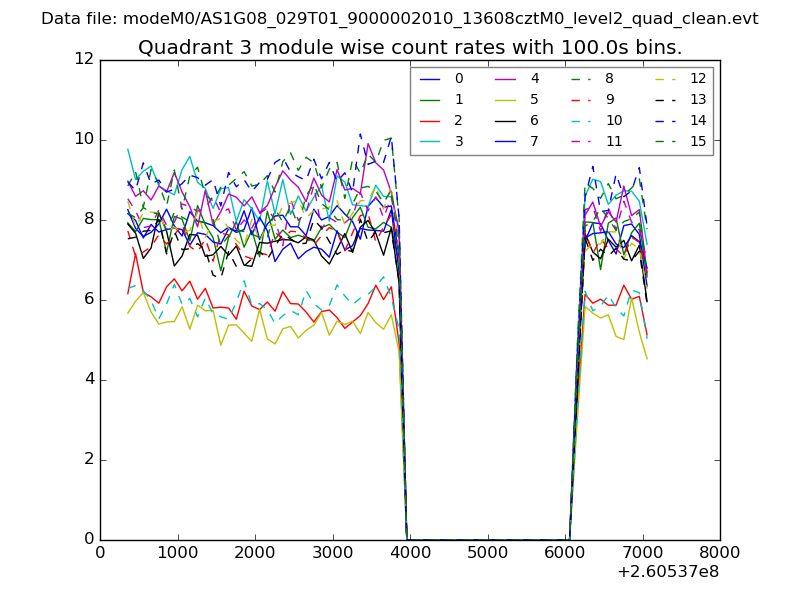 |
 |
| Parameter | Plot |
|---|---|
| CZT HV Monitor | 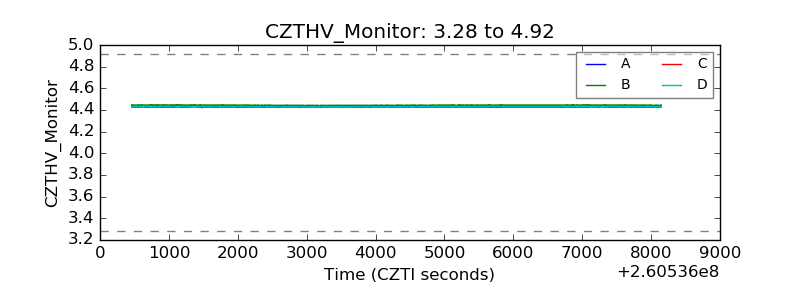 |
| D_VDD | 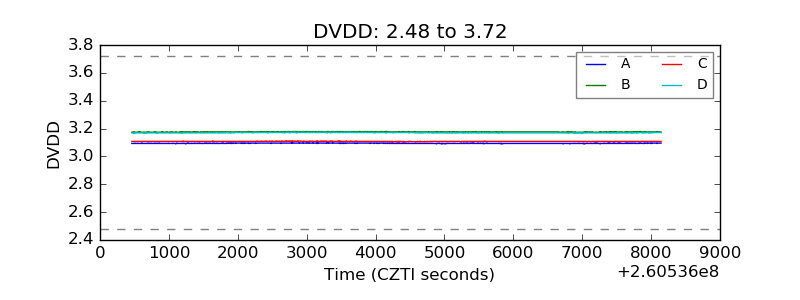 |
| Temperature 1 | 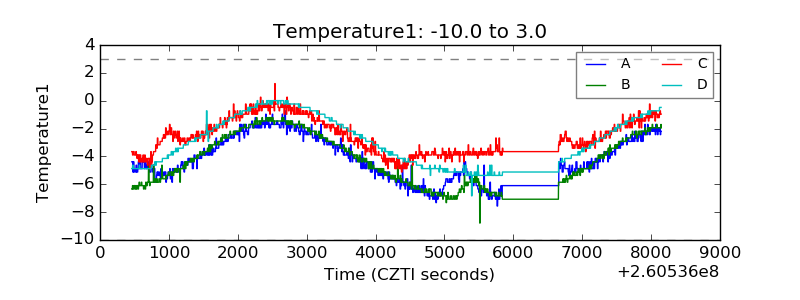 |
| Veto HV Monitor | 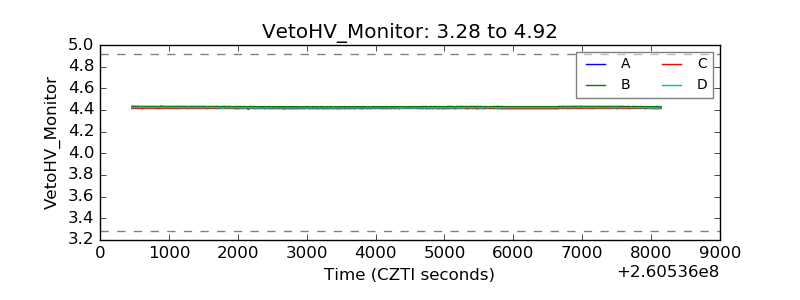 |
| Veto LLD | 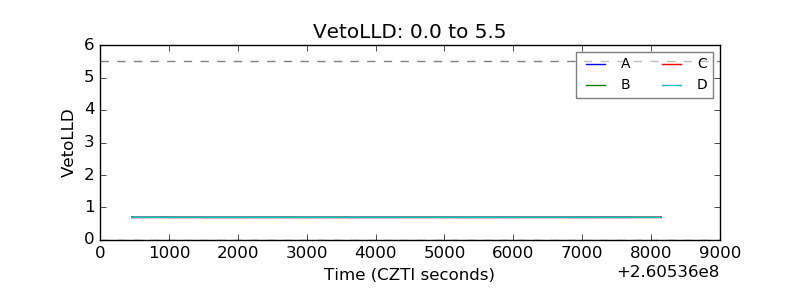 |
| Alpha Counter | 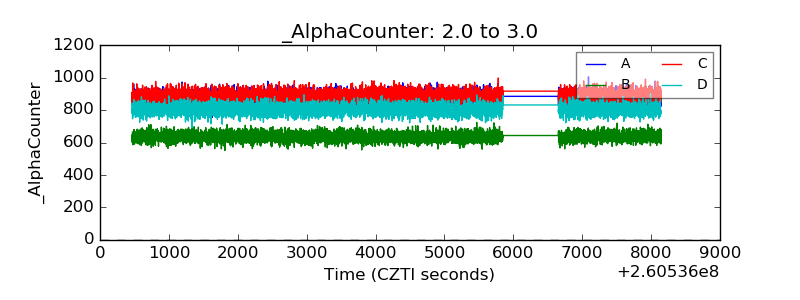 |
| _CPM_Rate | 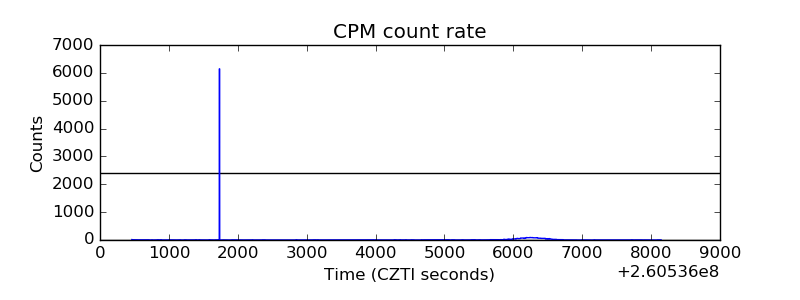 |
| CZT Counter |  |
| +2.5 Volts monitor |  |
| +5 Volts monitor | 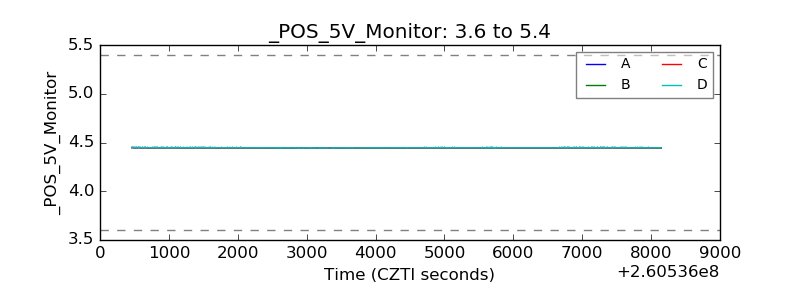 |
| _ROLL_ROT |  |
| _Roll_DEC |  |
| _Roll_RA | 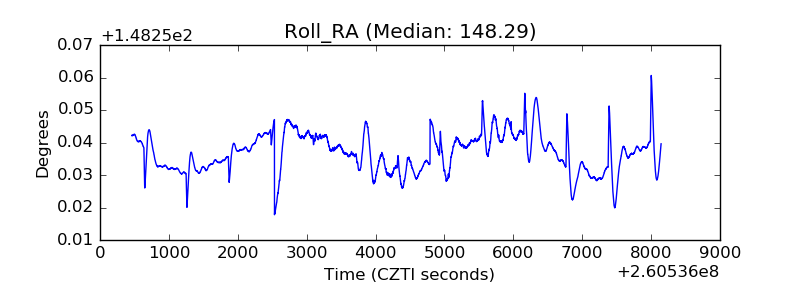 |
| Veto Counter | 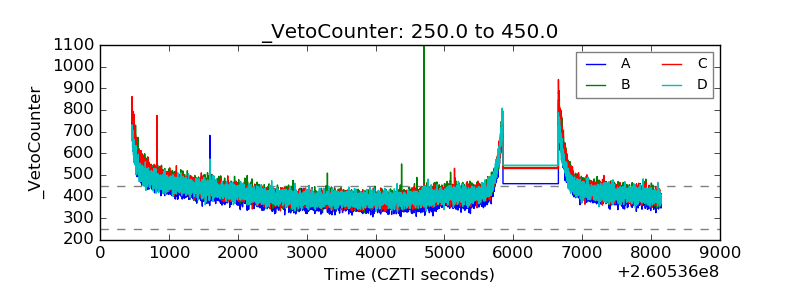 |