| Param | Original file | Final file |
|---|---|---|
| Filename | modeM0/AS1G08_029T01_9000002010_13609cztM0_level2.evt | modeM0/AS1G08_029T01_9000002010_13609cztM0_level2_quad_clean.evt |
| Size (bytes) | 549,158,400 | 99,092,160 |
| Size | 523.7 MB | 94.5 MB |
| Events in quadrant A | 3,753,813 | 631,042 |
| Events in quadrant B | 4,206,219 | 629,615 |
| Events in quadrant C | 3,838,413 | 616,575 |
| Events in quadrant D | 4,318,291 | 596,372 |
| Mode M9 | |||
|---|---|---|---|
| Quadrant | BADHDUFLAG | Total packets | Discarded packets |
| A | 0 | 12 | 0 |
| B | 0 | 12 | 0 |
| C | 0 | 12 | 0 |
| D | 0 | 12 | 0 |
| Mode SS | |||
|---|---|---|---|
| Quadrant | BADHDUFLAG | Total packets | Discarded packets |
| A | 0 | 158 | 0 |
| B | 0 | 158 | 0 |
| C | 0 | 158 | 0 |
| D | 0 | 158 | 0 |
| Mode M0 | |||
|---|---|---|---|
| Quadrant | BADHDUFLAG | Total packets | Discarded packets |
| A | 0 | 15916 | 3 |
| B | 0 | 17130 | 2 |
| C | 0 | 16028 | 2 |
| D | 0 | 17552 | 2 |
| Quadrant | Total seconds | Saturated seconds | Saturation percentage |
|---|---|---|---|
| A | 7579 | 266 | 3.509698% |
| B | 7579 | 347 | 4.578440% |
| C | 7579 | 199 | 2.625676% |
| D | 7579 | 238 | 3.140256% |
Noise dominated data is calculated using 1-second bins in cleaned event files. If a bin has >2000 counts, and if more than 50% of those come from <1% of pixels, then it is considered to be noise-dominated and hence unusable.
| Quadrant | # 1 sec bins | Bins with >0 counts | Bins with >2000 counts | High rate bins dominated by noise | Noise dominated (total time) | Noise dominated (detector-on time) | Marked lightcurve |
|---|---|---|---|---|---|---|---|
| A | 8730 | 7583 | 3 | 3 | 0.03% | 0.04% | 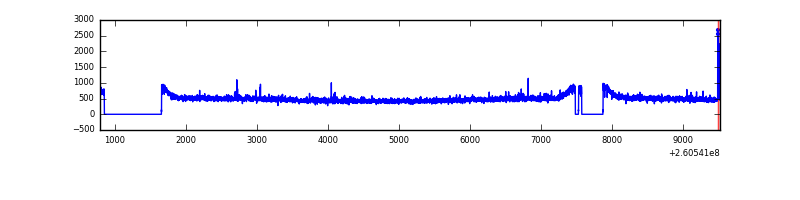 |
| B | 8730 | 7583 | 39 | 39 | 0.45% | 0.51% | 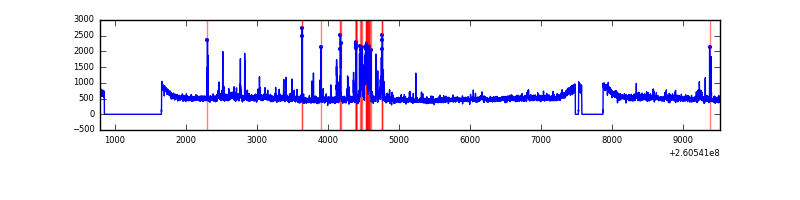 |
| C | 8730 | 7583 | 9 | 9 | 0.10% | 0.12% | 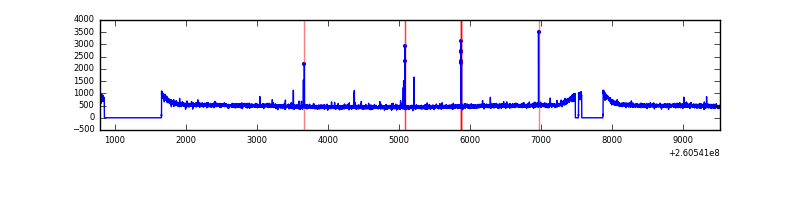 |
| D | 8730 | 7583 | 44 | 44 | 0.50% | 0.58% | 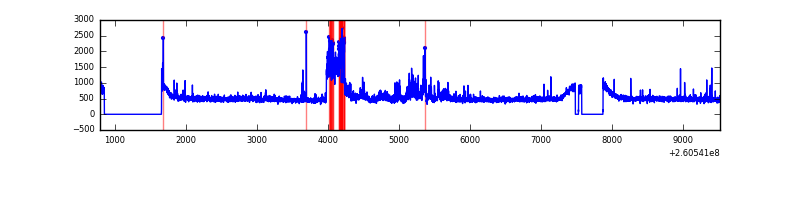 |
Top three noisy pixels from each quadrant. If the there are fewer than three noisy pixels in the level2.evt file, extra rows are filled as -1
| Pixel properties | Quadrant properties | ||||||
|---|---|---|---|---|---|---|---|
| Quadrant | DetID | PixID | Counts | Sigma | Mean | Median | Sigma |
| A | 1 | 162 | 31198 | 153.21 | 955 | 934 | 197.5 |
| A | 2 | 250 | 17636 | 84.55 | 955 | 934 | 197.5 |
| A | 15 | 69 | 16616 | 79.39 | 955 | 934 | 197.5 |
| B | 0 | 219 | 280153 | 1522.34 | 944 | 920 | 183.4 |
| B | 0 | 182 | 44081 | 235.31 | 944 | 920 | 183.4 |
| B | 4 | 142 | 42846 | 228.58 | 944 | 920 | 183.4 |
| C | 3 | 233 | 183696 | 849.73 | 922 | 924 | 215.1 |
| C | 14 | 234 | 31727 | 143.21 | 922 | 924 | 215.1 |
| C | 0 | 207 | 25069 | 112.25 | 922 | 924 | 215.1 |
| D | 12 | 6 | 576596 | 2535.3 | 931 | 907 | 227.1 |
| D | 8 | 195 | 99881 | 435.87 | 931 | 907 | 227.1 |
| D | 13 | 122 | 64344 | 279.37 | 931 | 907 | 227.1 |
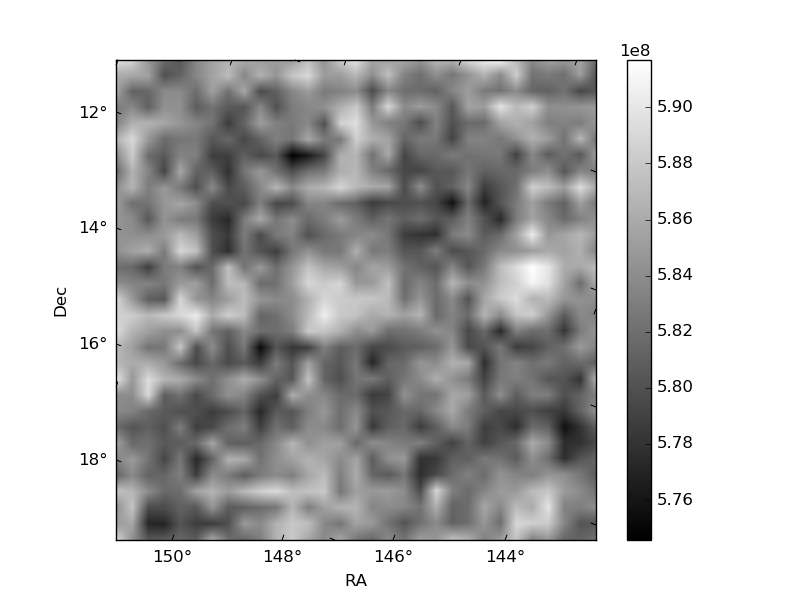
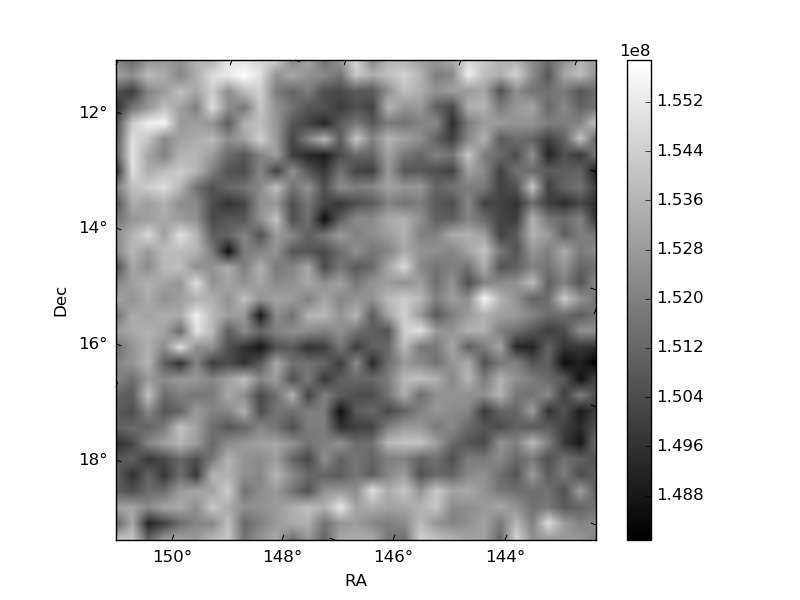
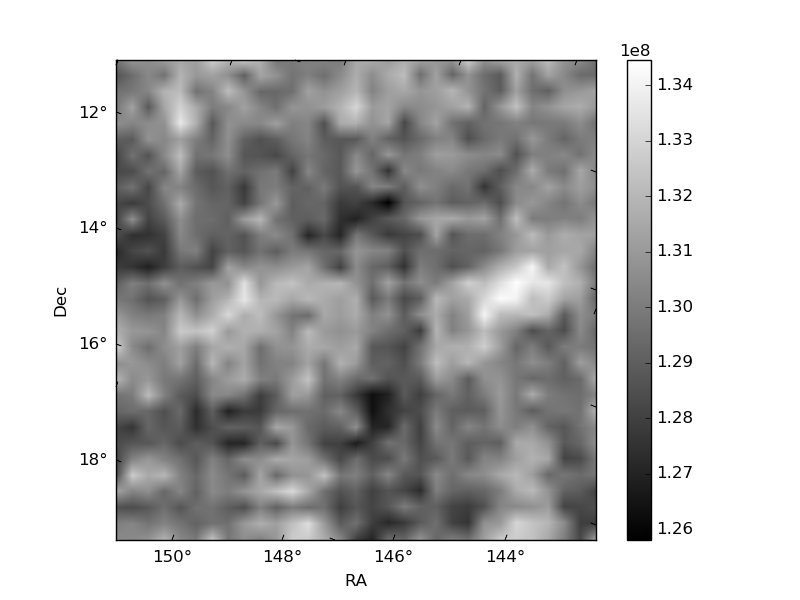
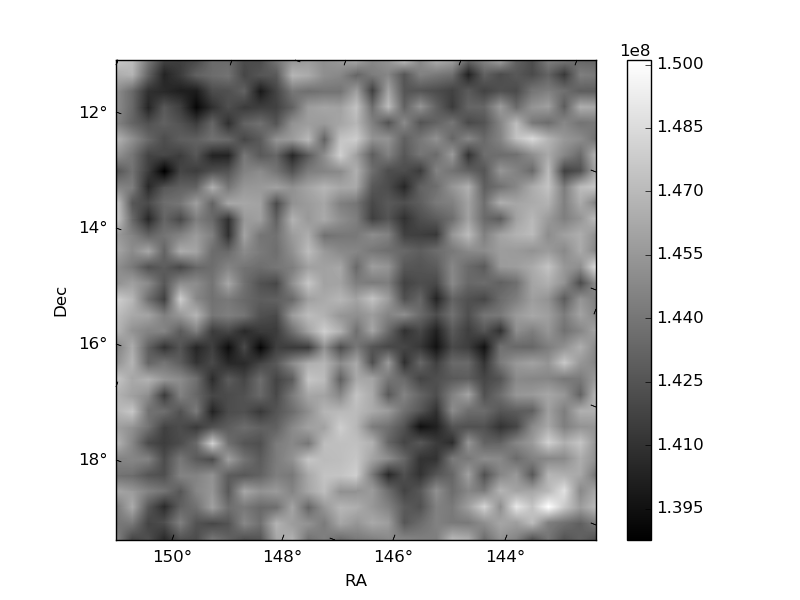
Histogram calculated using DETX and DETY for each event in the final _common_clean file
| Quadrant A | 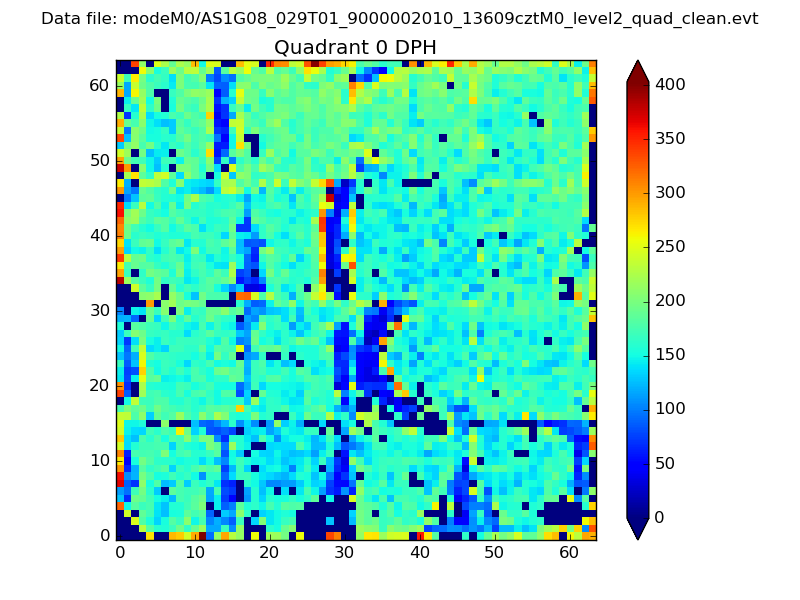 |
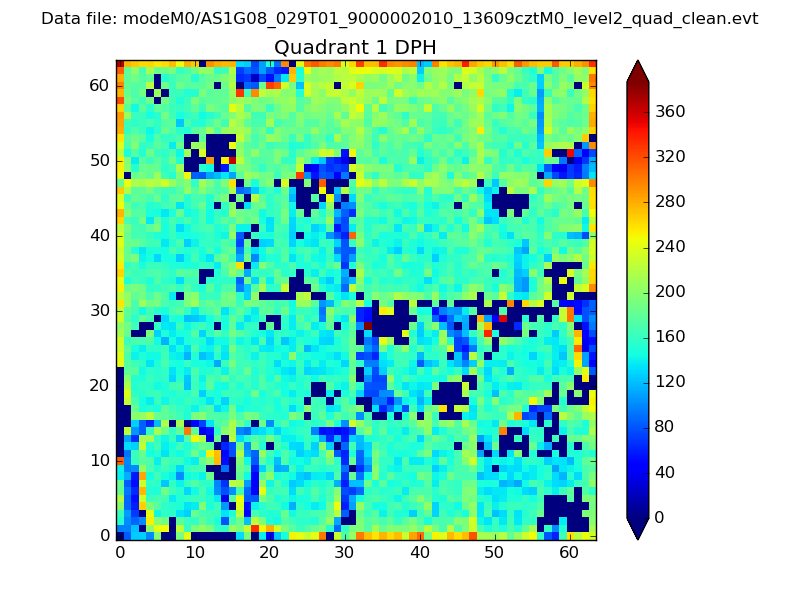 |
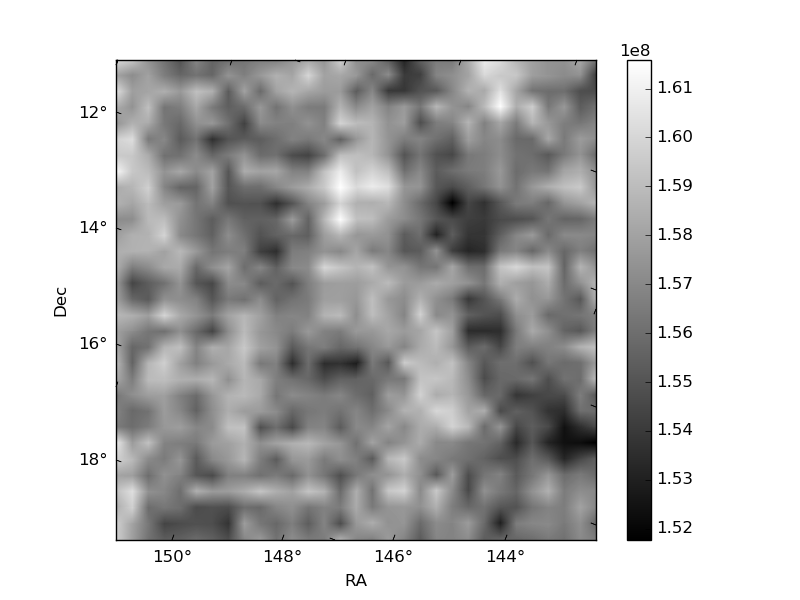
Quadrant B |
|---|---|---|---|
| Quadrant D | 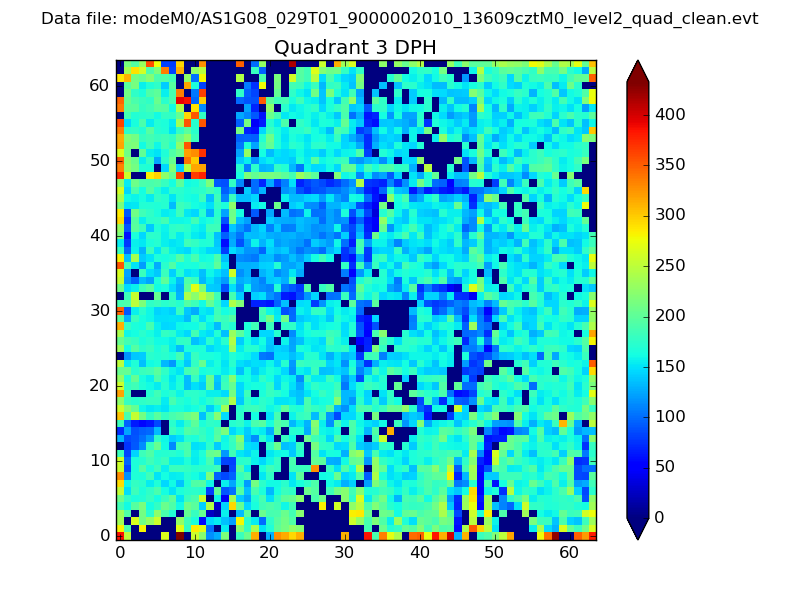 |
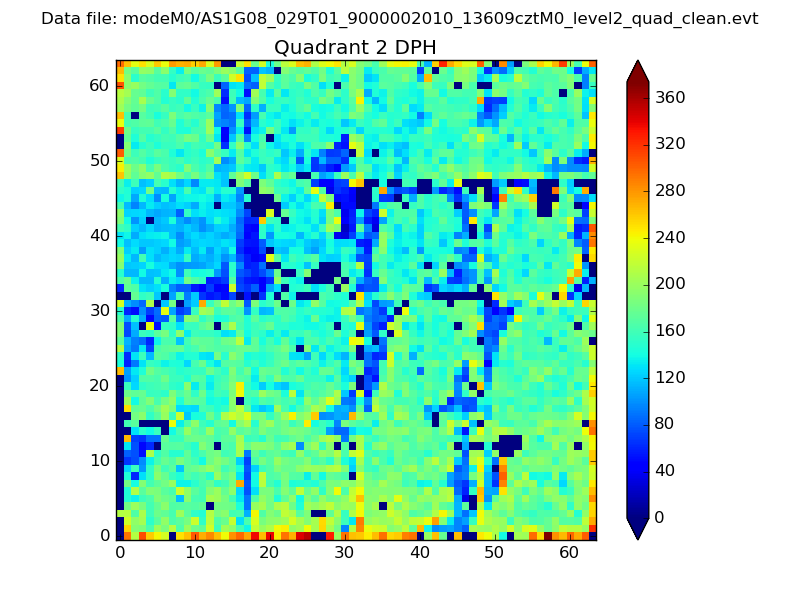 |
Quadrant C |
| Plot type | Count rate plots | Images |
|---|---|---|
| Comparison with Poisson distribution Blue bars denote a histogram of data divided into 1 sec bins. Red curve is a Poisson curve with rate = median count rate of data. |
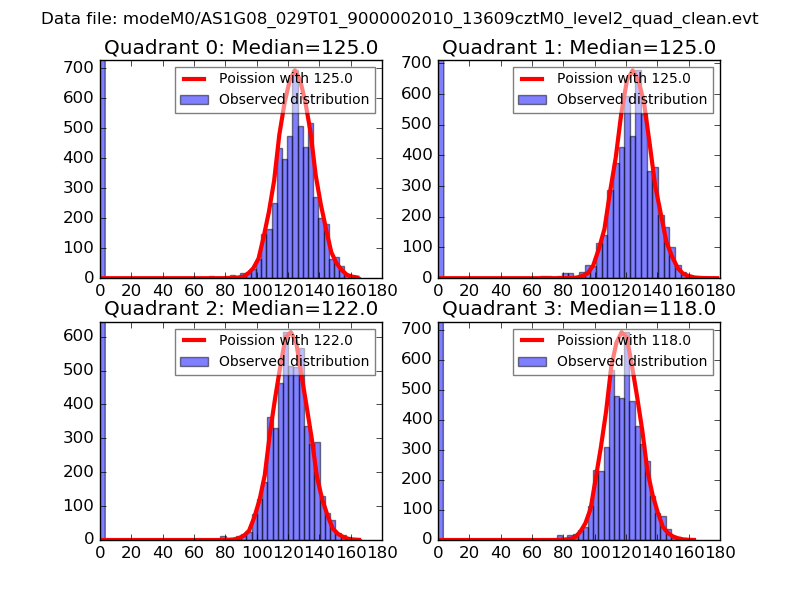 |
 |
| Quadrant-wise count rates Data is divided into 100 sec bins |
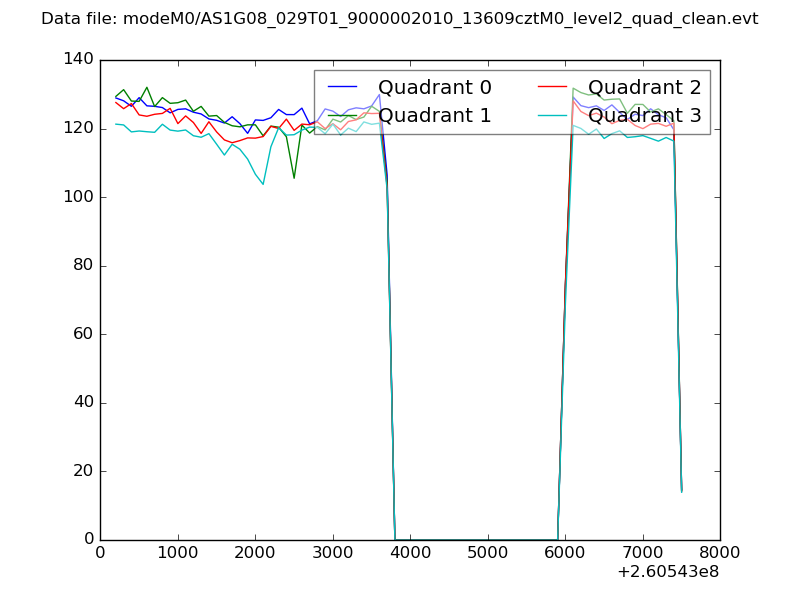 |
|
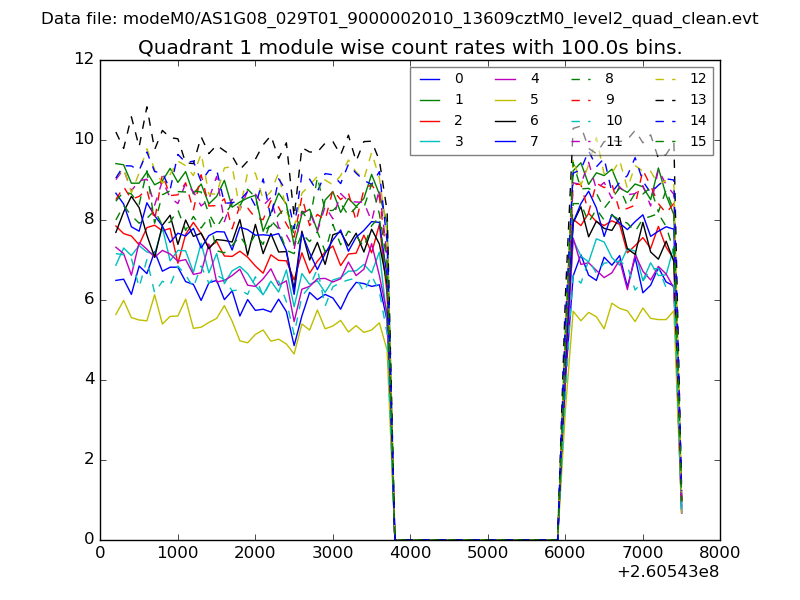
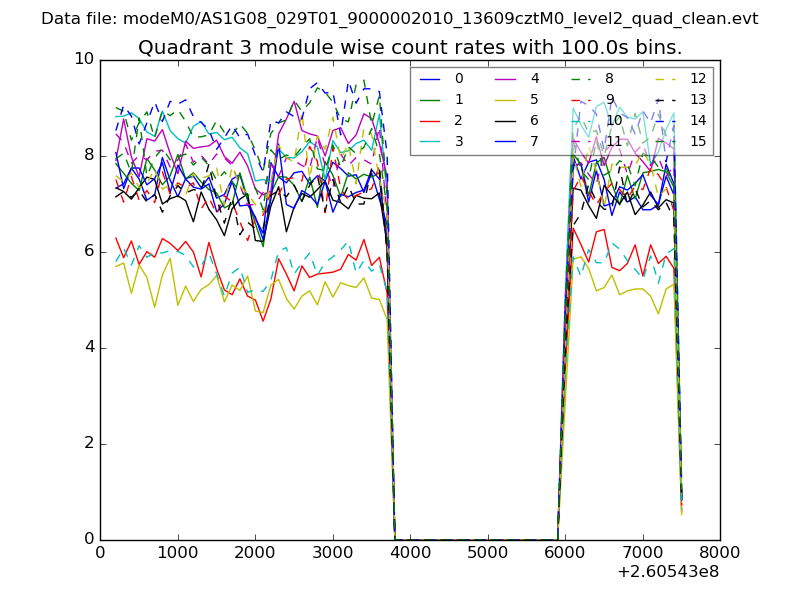
| Module-wise count rates for Quadrant A Data is divided into 100 sec bins |
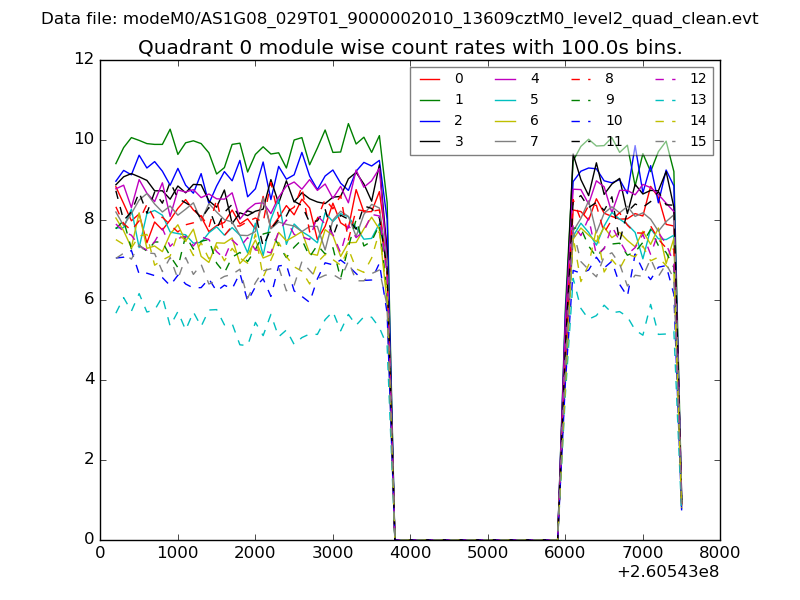 |
 |
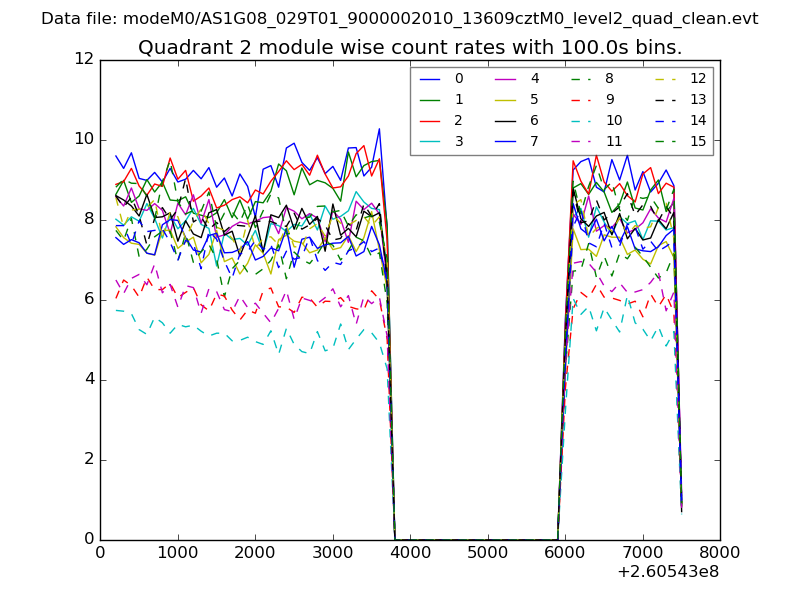
| Module-wise count rates for Quadrant B Data is divided into 100 sec bins |
 |
 |
| Module-wise count rates for Quadrant C Data is divided into 100 sec bins |
 |
 |
| Module-wise count rates for Quadrant D Data is divided into 100 sec bins |
 |
 |
| Parameter | Plot |
|---|---|
| CZT HV Monitor | 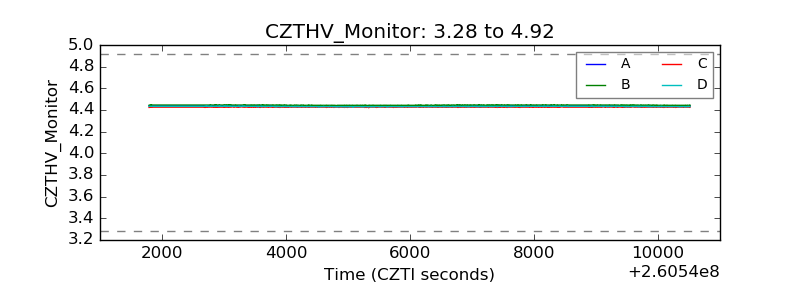 |
| D_VDD | 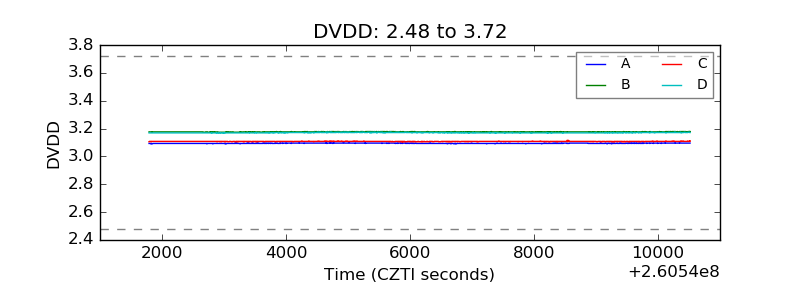 |
| Temperature 1 | 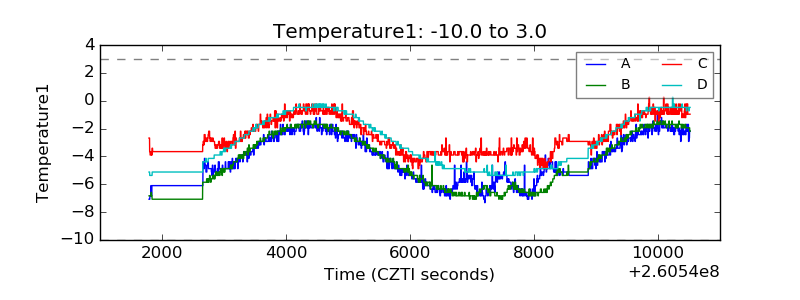 |
| Veto HV Monitor |  |
| Veto LLD | 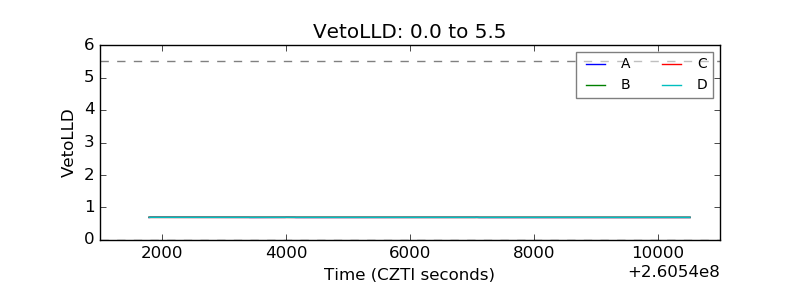 |
| Alpha Counter | 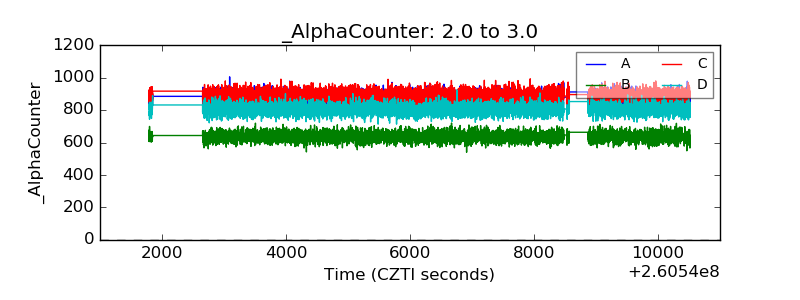 |
| _CPM_Rate | 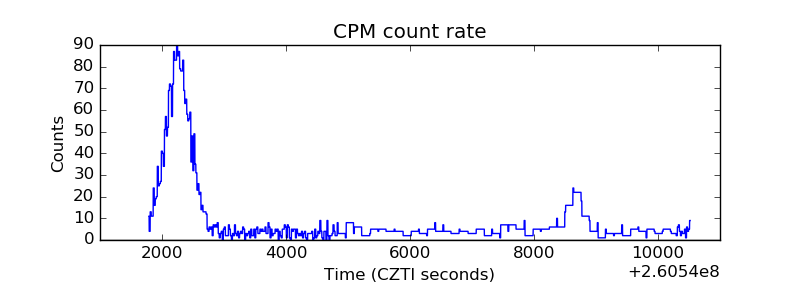 |
| CZT Counter | 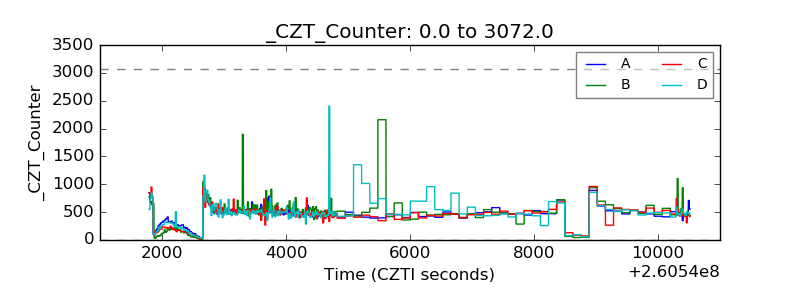 |
| +2.5 Volts monitor |  |
| +5 Volts monitor |  |
| _ROLL_ROT | 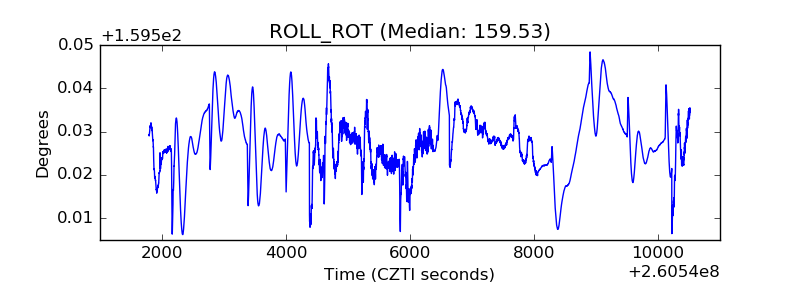 |
| _Roll_DEC |  |
| _Roll_RA | 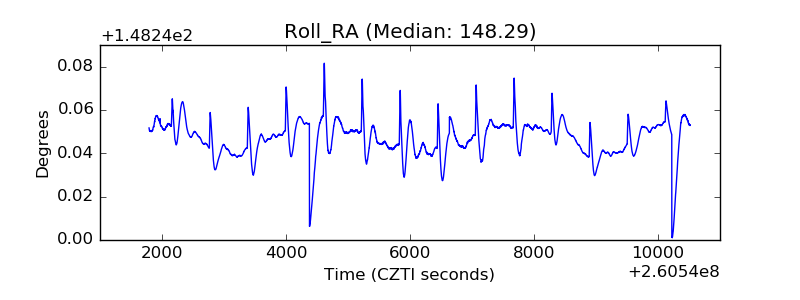 |
| Veto Counter | 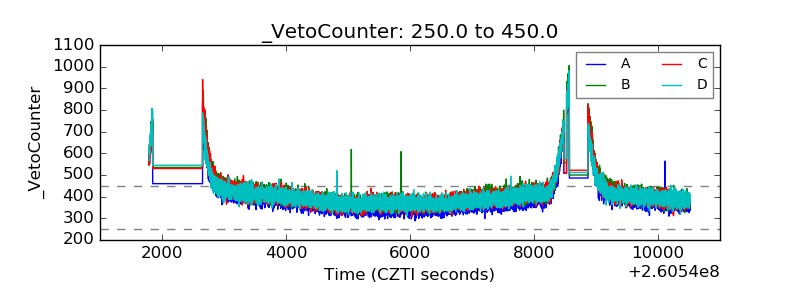 |