| Param | Original file | Final file |
|---|---|---|
| Filename | modeM0/AS1G08_029T01_9000002010_13610cztM0_level2.evt | modeM0/AS1G08_029T01_9000002010_13610cztM0_level2_quad_clean.evt |
| Size (bytes) | 543,594,240 | 105,154,560 |
| Size | 518.4 MB | 100.3 MB |
| Events in quadrant A | 3,774,252 | 671,237 |
| Events in quadrant B | 4,162,826 | 671,954 |
| Events in quadrant C | 3,802,777 | 665,199 |
| Events in quadrant D | 4,202,685 | 642,962 |
| Mode SS | |||
|---|---|---|---|
| Quadrant | BADHDUFLAG | Total packets | Discarded packets |
| A | 0 | 154 | 0 |
| B | 0 | 154 | 0 |
| C | 0 | 154 | 0 |
| D | 0 | 154 | 0 |
| Mode M0 | |||
|---|---|---|---|
| Quadrant | BADHDUFLAG | Total packets | Discarded packets |
| A | 0 | 16215 | 1 |
| B | 0 | 17217 | 0 |
| C | 0 | 16179 | 0 |
| D | 0 | 17346 | 0 |
| Quadrant | Total seconds | Saturated seconds | Saturation percentage |
|---|---|---|---|
| A | 7659 | 228 | 2.976890% |
| B | 7659 | 322 | 4.204204% |
| C | 7659 | 121 | 1.579841% |
| D | 7659 | 140 | 1.827915% |
Noise dominated data is calculated using 1-second bins in cleaned event files. If a bin has >2000 counts, and if more than 50% of those come from <1% of pixels, then it is considered to be noise-dominated and hence unusable.
| Quadrant | # 1 sec bins | Bins with >0 counts | Bins with >2000 counts | High rate bins dominated by noise | Noise dominated (total time) | Noise dominated (detector-on time) | Marked lightcurve |
|---|---|---|---|---|---|---|---|
| A | 7660 | 7660 | 3 | 3 | 0.04% | 0.04% |  |
| B | 7660 | 7660 | 15 | 15 | 0.20% | 0.20% |  |
| C | 7660 | 7660 | 2 | 2 | 0.03% | 0.03% |  |
| D | 7660 | 7660 | 14 | 14 | 0.18% | 0.18% |  |
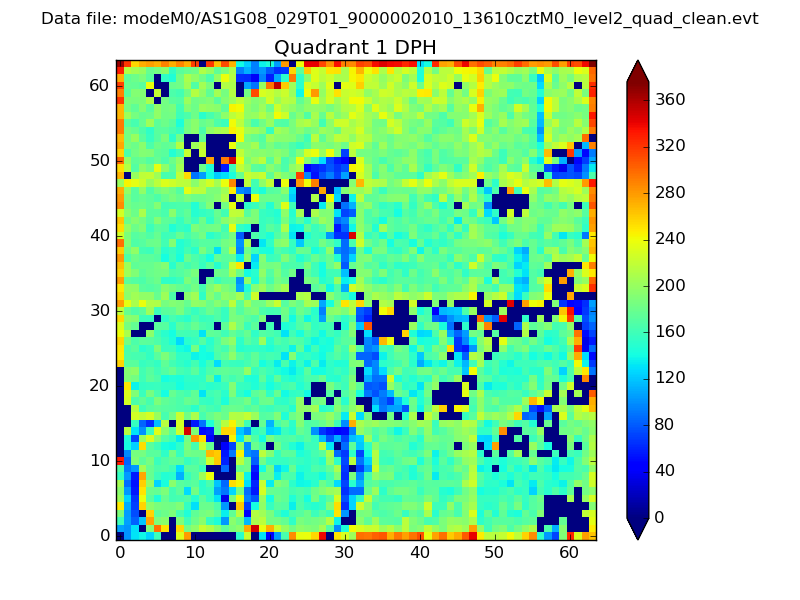
Top three noisy pixels from each quadrant. If the there are fewer than three noisy pixels in the level2.evt file, extra rows are filled as -1
| Pixel properties | Quadrant properties | ||||||
|---|---|---|---|---|---|---|---|
| Quadrant | DetID | PixID | Counts | Sigma | Mean | Median | Sigma |
| A | 1 | 162 | 29478 | 144.5 | 964 | 941 | 197.5 |
| A | 15 | 69 | 17718 | 84.95 | 964 | 941 | 197.5 |
| A | 1 | 178 | 9568 | 43.68 | 964 | 941 | 197.5 |
| B | 0 | 219 | 191178 | 1021.54 | 952 | 927 | 186.2 |
| B | 4 | 173 | 95392 | 507.22 | 952 | 927 | 186.2 |
| B | 3 | 64 | 75348 | 399.6 | 952 | 927 | 186.2 |
| C | 3 | 233 | 144093 | 653.82 | 930 | 935 | 219.0 |
| C | 0 | 207 | 24417 | 107.24 | 930 | 935 | 219.0 |
| C | 13 | 61 | 6787 | 26.73 | 930 | 935 | 219.0 |
| D | 5 | 222 | 319250 | 1379.65 | 937 | 908 | 230.7 |
| D | 8 | 195 | 206449 | 890.79 | 937 | 908 | 230.7 |
| D | 13 | 249 | 58566 | 249.88 | 937 | 908 | 230.7 |
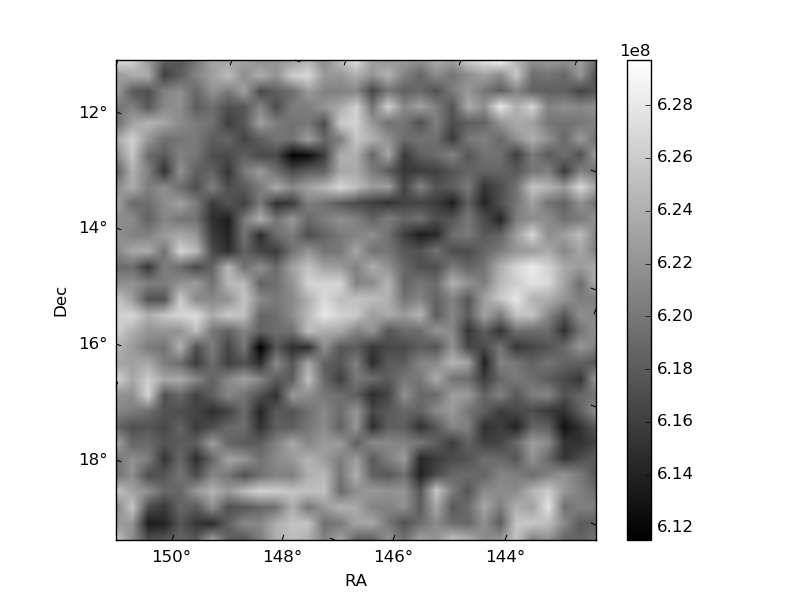
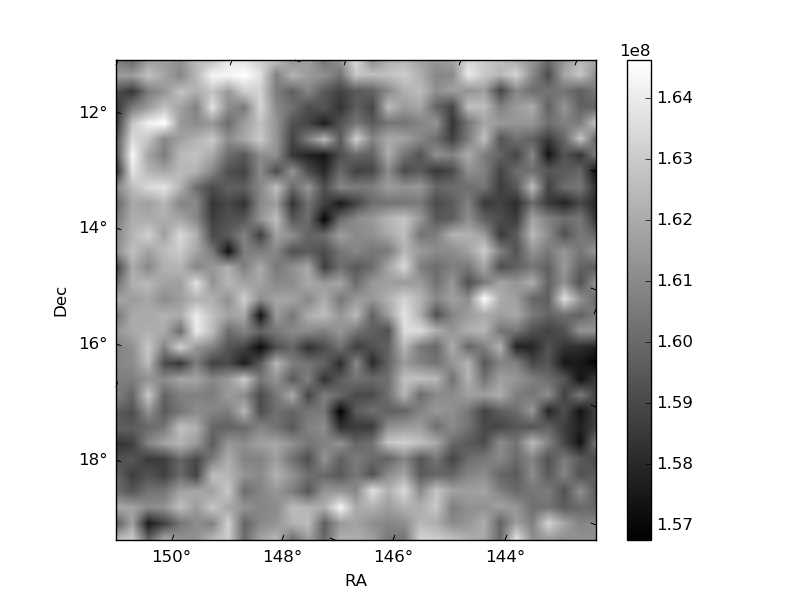
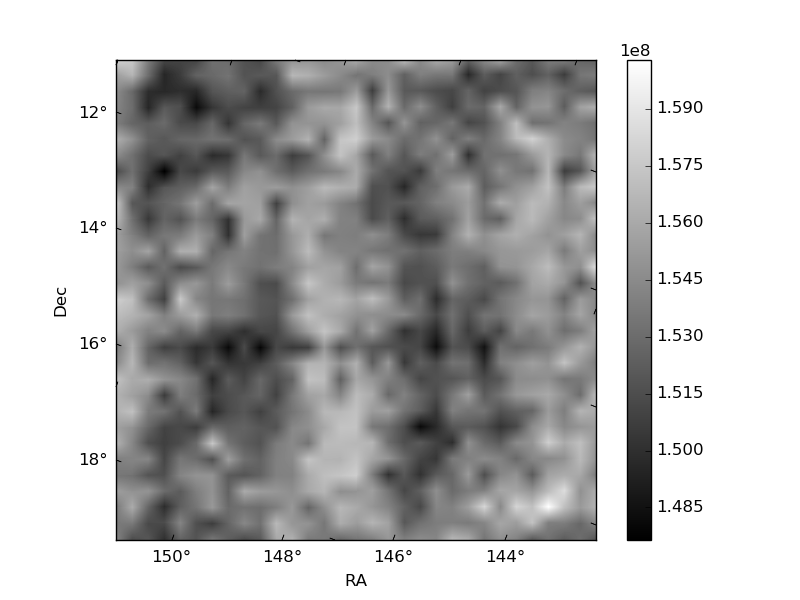
Histogram calculated using DETX and DETY for each event in the final _common_clean file
| Quadrant A | 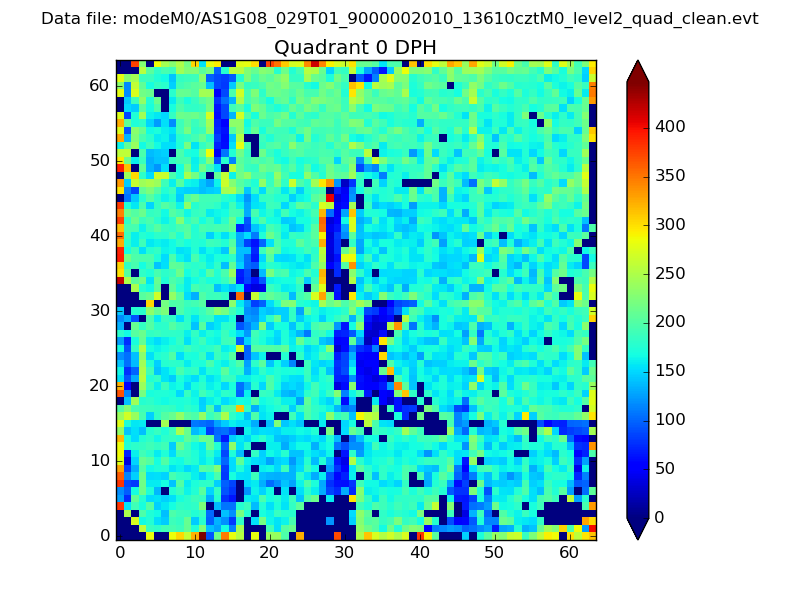 |
 |
Quadrant B |
|---|---|---|---|
| Quadrant D | 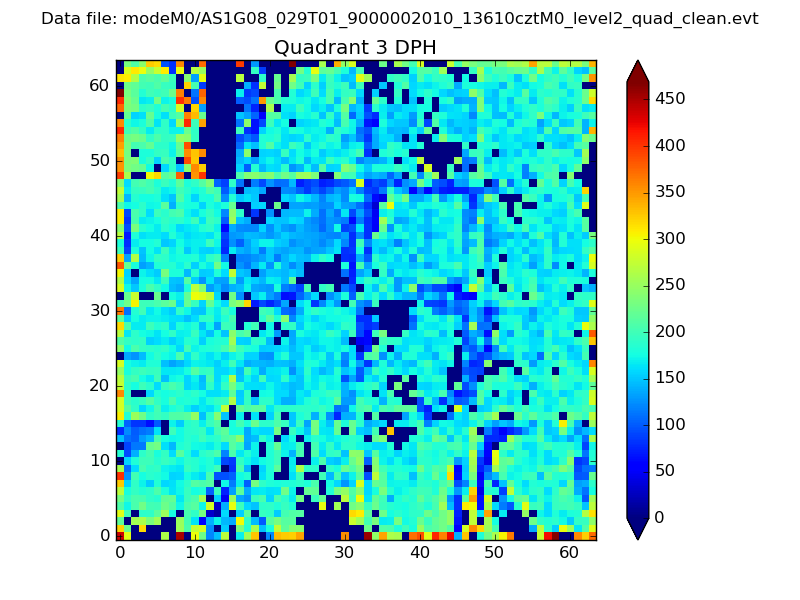 |
 |
Quadrant C |
| Plot type | Count rate plots | Images |
|---|---|---|
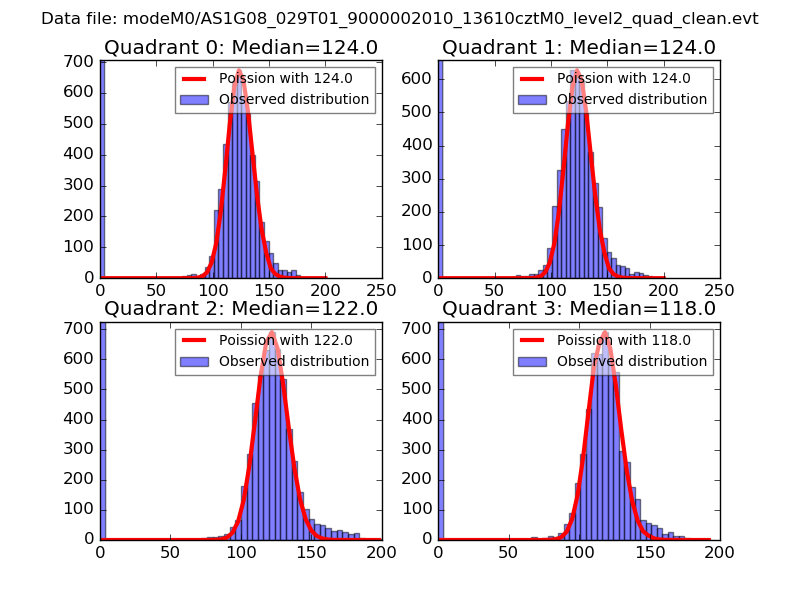
| Comparison with Poisson distribution Blue bars denote a histogram of data divided into 1 sec bins. Red curve is a Poisson curve with rate = median count rate of data. |
 |
 |
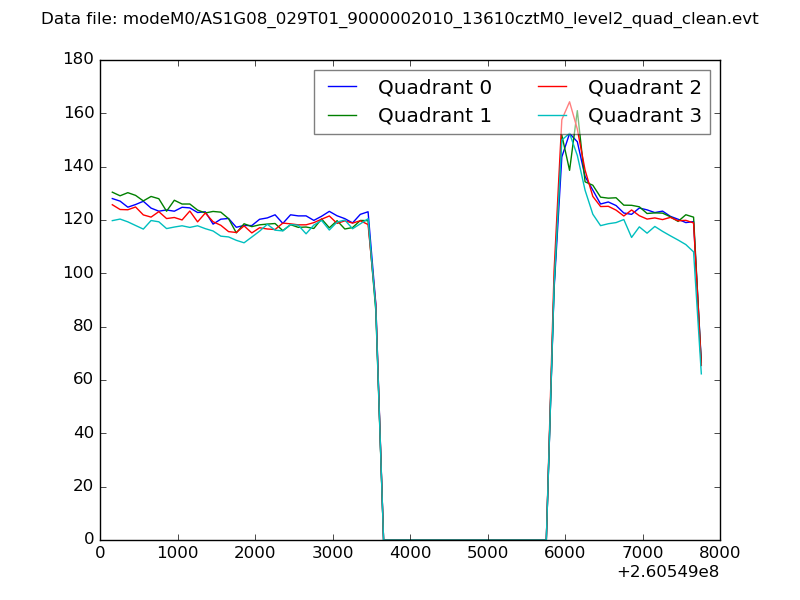
| Quadrant-wise count rates Data is divided into 100 sec bins |
 |
|
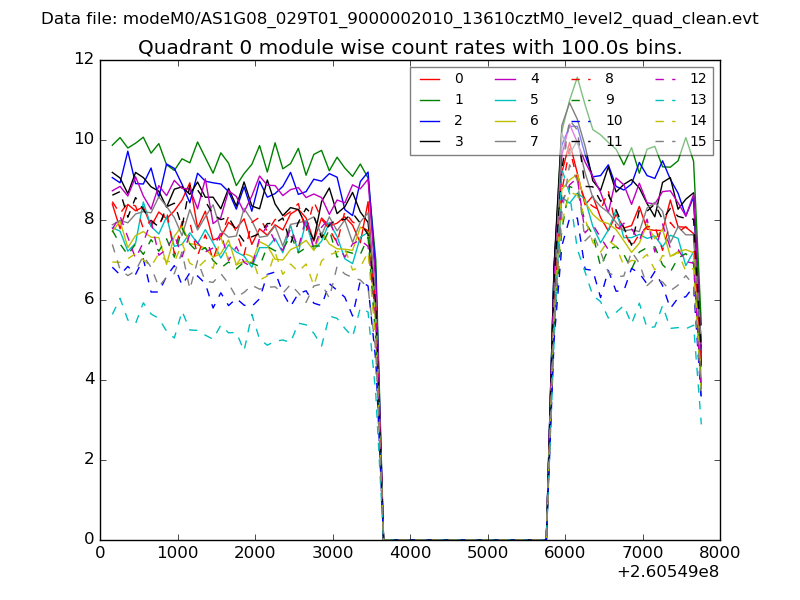
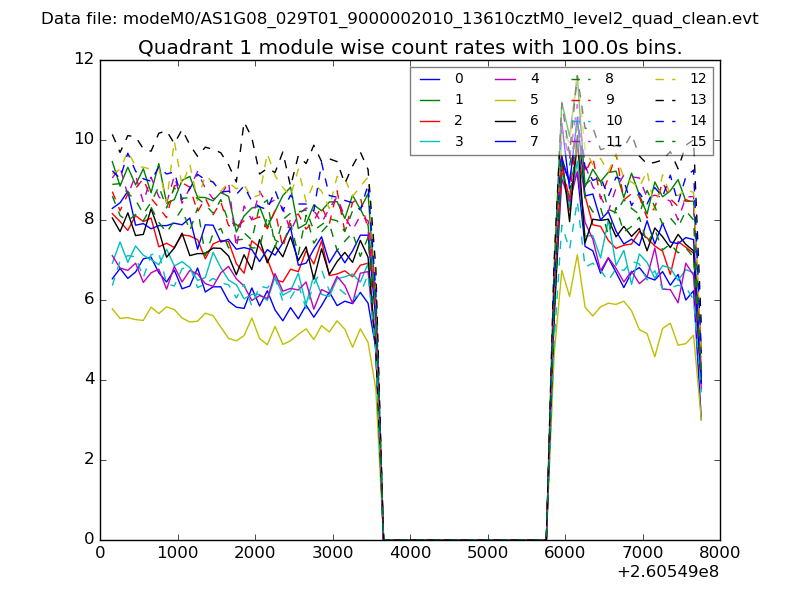
| Module-wise count rates for Quadrant A Data is divided into 100 sec bins |
 |
 |
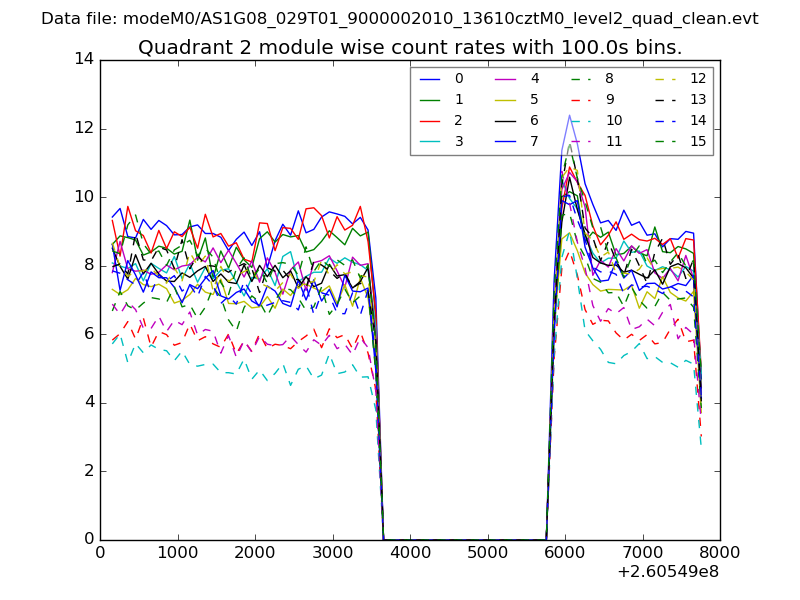
| Module-wise count rates for Quadrant B Data is divided into 100 sec bins |
 |
 |
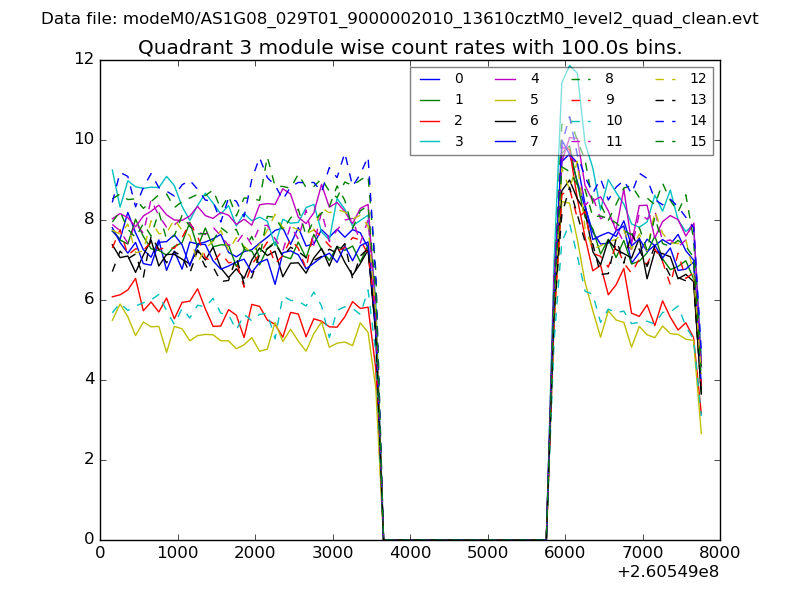
| Module-wise count rates for Quadrant C Data is divided into 100 sec bins |
 |
 |
| Module-wise count rates for Quadrant D Data is divided into 100 sec bins |
 |
 |
| Parameter | Plot |
|---|---|
| CZT HV Monitor | 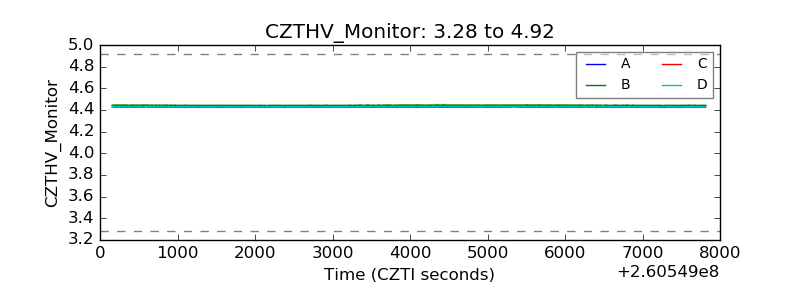 |
| D_VDD | 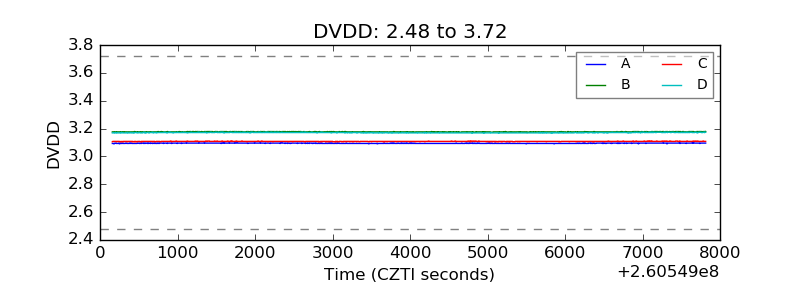 |
| Temperature 1 | 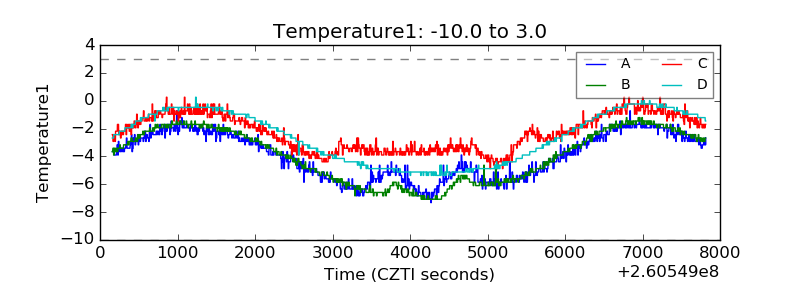 |
| Veto HV Monitor | 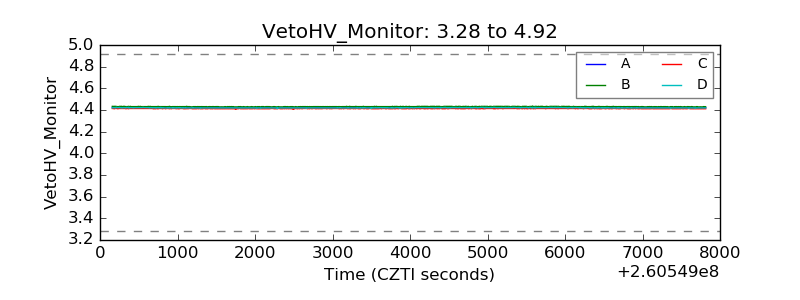 |
| Veto LLD | 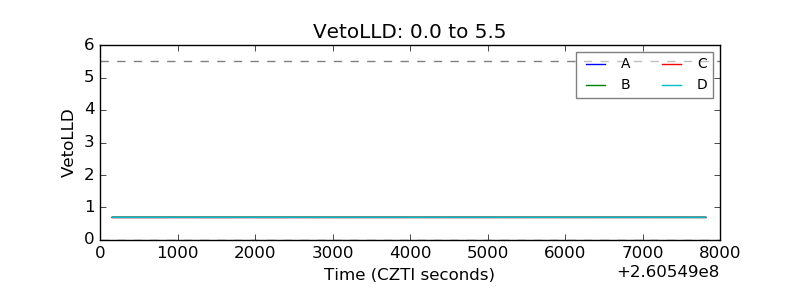 |
| Alpha Counter | 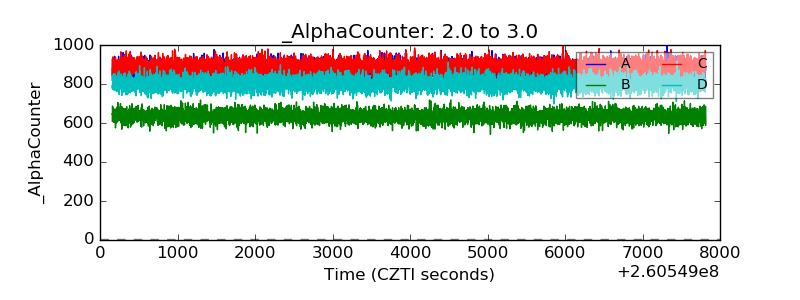 |
| _CPM_Rate | 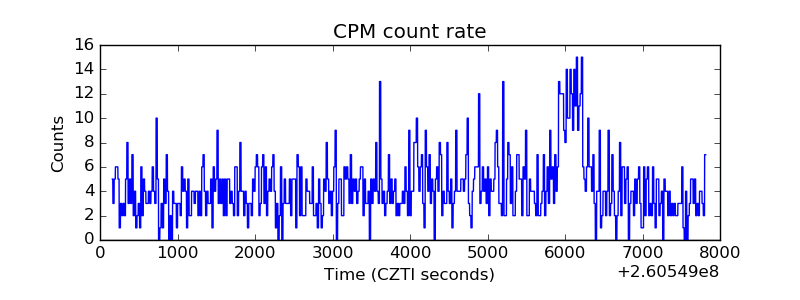 |
| CZT Counter |  |
| +2.5 Volts monitor |  |
| +5 Volts monitor | 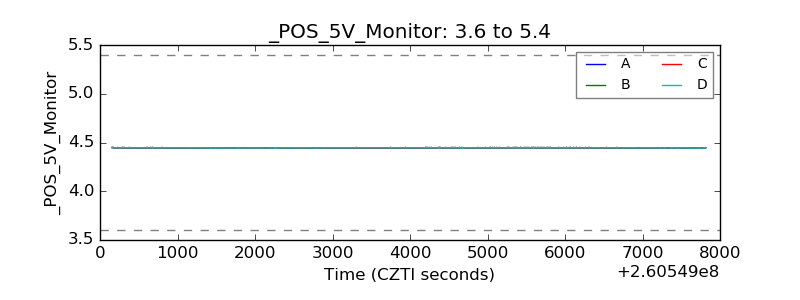 |
| _ROLL_ROT | 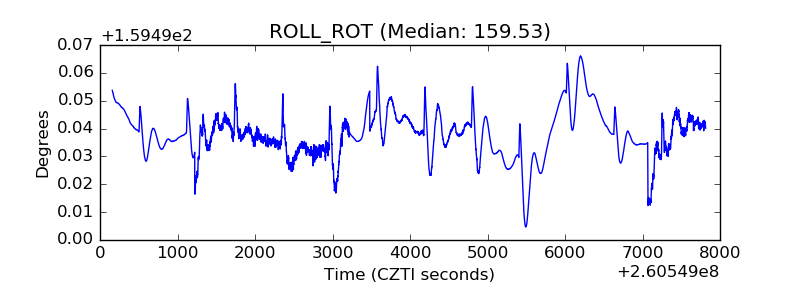 |
| _Roll_DEC | 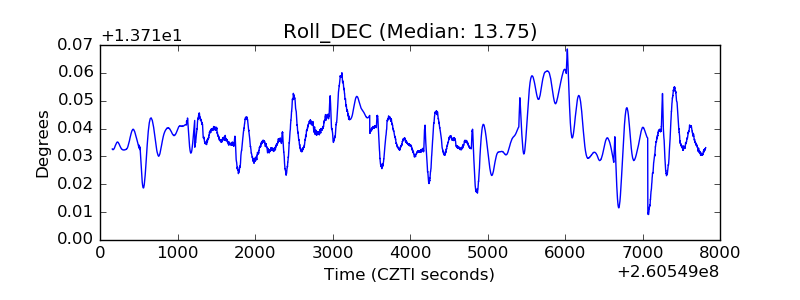 |
| _Roll_RA |  |
| Veto Counter | 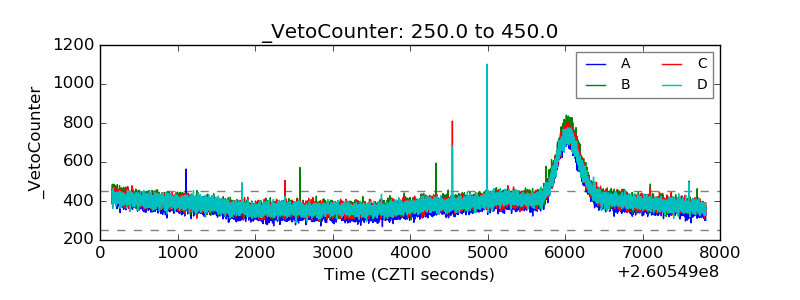 |