| Param | Original file | Final file |
|---|---|---|
| Filename | modeM0/AS1A04_212T03_9000002016cztM0_level2.fits | modeM0/AS1A04_212T03_9000002016cztM0_level2_quad_clean.evt |
| Size (bytes) | 125,406,720 | 96,016,320 |
| Size | 119.6 MB | 91.6 MB |
| Events in quadrant A | 783,230 | 544,677 |
| Events in quadrant B | 749,142 | 539,589 |
| Events in quadrant C | 760,024 | 510,818 |
| Events in quadrant D | 657,296 | 463,213 |
| Mode M0 | |||
|---|---|---|---|
| Quadrant | BADHDUFLAG | Total packets | Discarded packets |
| A | 0 | 26192 | 0 |
| B | 0 | 30306 | 0 |
| C | 0 | 25468 | 0 |
| D | 0 | 33116 | 0 |
| Mode SS | |||
|---|---|---|---|
| Quadrant | BADHDUFLAG | Total packets | Discarded packets |
| A | 0 | 252 | 0 |
| B | 0 | 252 | 0 |
| C | 0 | 252 | 0 |
| D | 0 | 252 | 0 |
| Mode M9 | |||
|---|---|---|---|
| Quadrant | BADHDUFLAG | Total packets | Discarded packets |
| A | 0 | 25 | 0 |
| B | 0 | 25 | 0 |
| C | 0 | 25 | 0 |
| D | 0 | 25 | 0 |
| Quadrant | Total seconds | Saturated seconds | Saturation percentage |
|---|---|---|---|
| A | 12263 | 220 | 1.794015% |
| B | 12263 | 360 | 2.935660% |
| C | 12263 | 97 | 0.790997% |
| D | 12263 | 422 | 3.441246% |
Noise dominated data is calculated using 1-second bins in cleaned event files. If a bin has >2000 counts, and if more than 50% of those come from <1% of pixels, then it is considered to be noise-dominated and hence unusable.
| Quadrant | # 1 sec bins | Bins with >0 counts | Bins with >2000 counts | High rate bins dominated by noise | Noise dominated (total time) | Noise dominated (detector-on time) | Marked lightcurve |
|---|---|---|---|---|---|---|---|
| A | 14878 | 12263 | 0 | 0 | 0.00% | 0.00% | 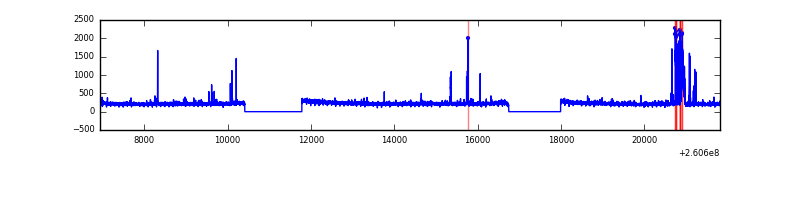 |
| B | 14878 | 12262 | 0 | 0 | 0.00% | 0.00% |  |
| C | 14878 | 12263 | 0 | 0 | 0.00% | 0.00% |  |
| D | 14878 | 12263 | 0 | 0 | 0.00% | 0.00% |  |
Top three noisy pixels from each quadrant. If the there are fewer than three noisy pixels in the level2.evt file, extra rows are filled as -1
| Pixel properties | Quadrant properties | ||||||
|---|---|---|---|---|---|---|---|
| Quadrant | DetID | PixID | Counts | Sigma | Mean | Median | Sigma |
| A | 0 | 29 | 703 | 9.91 | 204 | 193 | 51.5 |
| A | 7 | 110 | 644 | 8.76 | 204 | 193 | 51.5 |
| A | 9 | 19 | 600 | 7.91 | 204 | 193 | 51.5 |
| B | 2 | 9 | 656 | 11.37 | 198 | 190 | 41.0 |
| B | 2 | 8 | 508 | 7.76 | 198 | 190 | 41.0 |
| B | 5 | 128 | 502 | 7.61 | 198 | 190 | 41.0 |
| C | 1 | 81 | 595 | 7.7 | 200 | 189 | 52.7 |
| C | 1 | 80 | 567 | 7.17 | 200 | 189 | 52.7 |
| C | 12 | 241 | 535 | 6.57 | 200 | 189 | 52.7 |
| D | 6 | 231 | 557 | 7.74 | 187 | 171 | 49.9 |
| D | 10 | 189 | 485 | 6.3 | 187 | 171 | 49.9 |
| D | 6 | 83 | 482 | 6.24 | 187 | 171 | 49.9 |
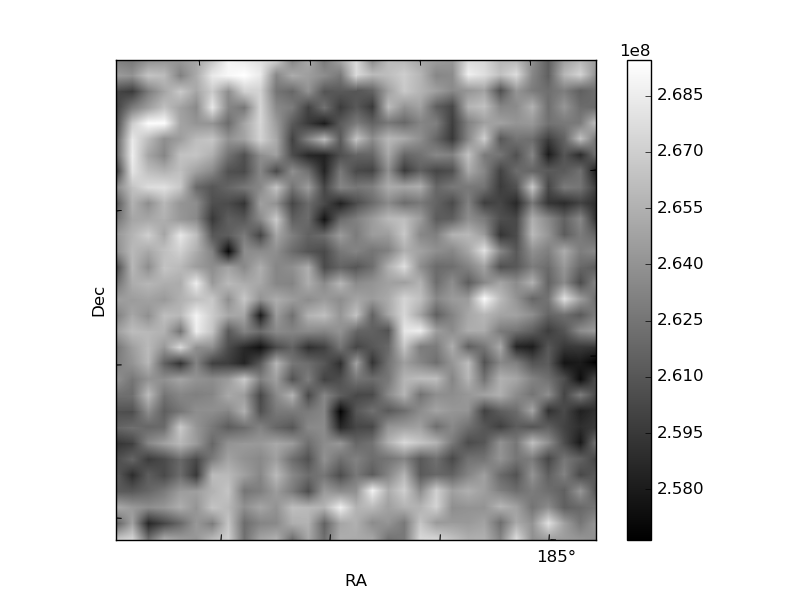
Histogram calculated using DETX and DETY for each event in the final _common_clean file
| Quadrant A | 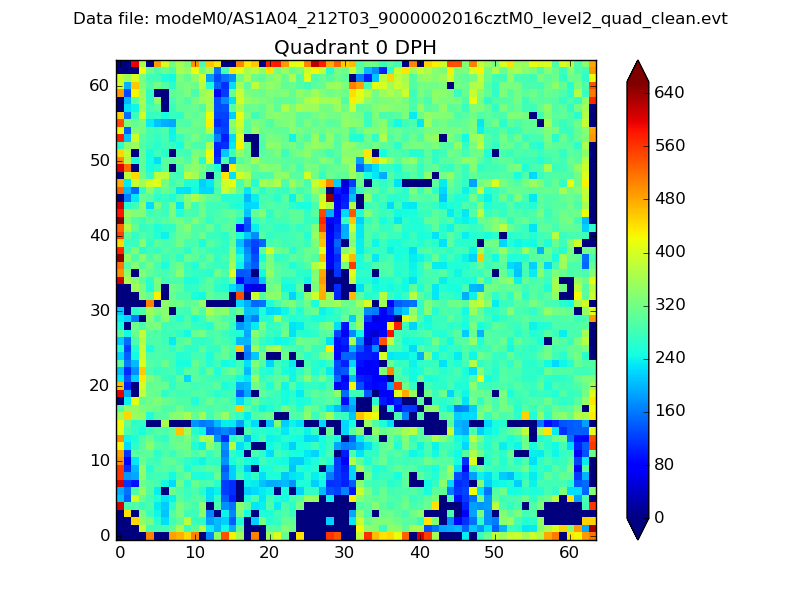 |
 |
Quadrant B |
|---|---|---|---|
| Quadrant D |  |
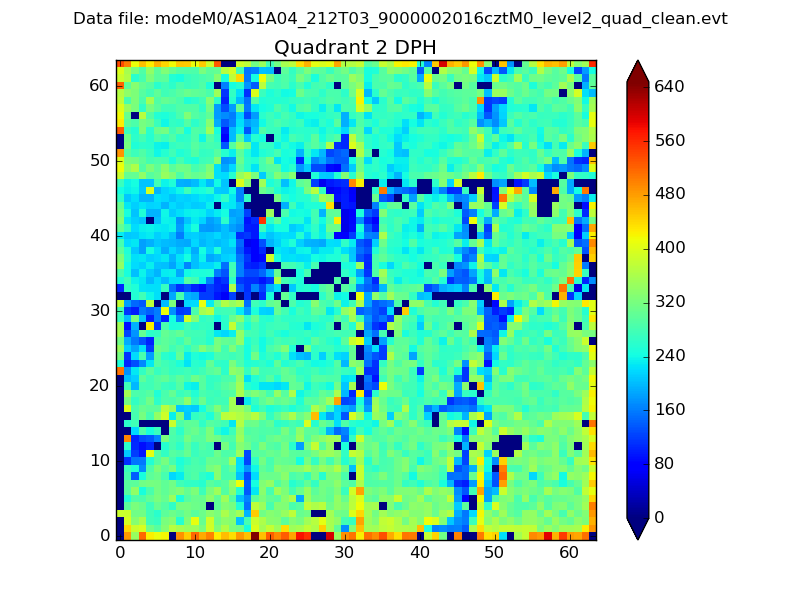 |
Quadrant C |
| Plot type | Count rate plots | Images |
|---|---|---|
| Comparison with Poisson distribution Blue bars denote a histogram of data divided into 1 sec bins. Red curve is a Poisson curve with rate = median count rate of data. |
 |
 |
| Quadrant-wise count rates Data is divided into 100 sec bins |
 |
|
| Module-wise count rates for Quadrant A Data is divided into 100 sec bins |
 |
 |
| Module-wise count rates for Quadrant B Data is divided into 100 sec bins |
 |
 |
| Module-wise count rates for Quadrant C Data is divided into 100 sec bins |
 |
 |
| Module-wise count rates for Quadrant D Data is divided into 100 sec bins |
 |
 |
| Parameter | Plot |
|---|---|
| CZT HV Monitor |  |
| D_VDD |  |
| Temperature 1 | 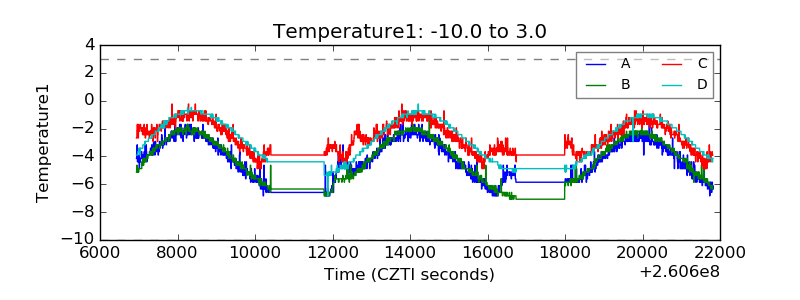 |
| Veto HV Monitor |  |
| Veto LLD |  |
| Alpha Counter |  |
| _CPM_Rate |  |
| CZT Counter |  |
| +2.5 Volts monitor | 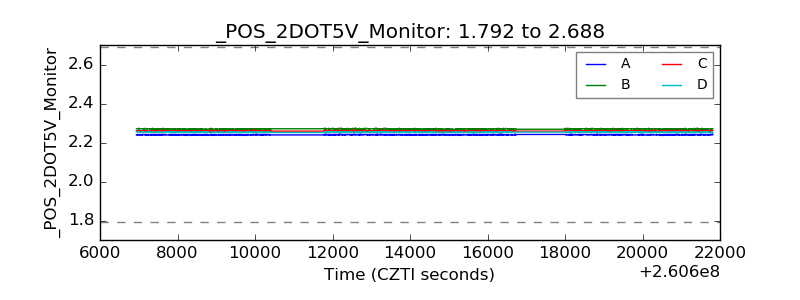 |
| +5 Volts monitor |  |
| _ROLL_ROT |  |
| _Roll_DEC |  |
| _Roll_RA |  |
| Veto Counter |  |