| Param | Original file | Final file |
|---|---|---|
| Filename | modeM0/AS1A04_212T03_9000002016_13620cztM0_level2.evt | modeM0/AS1A04_212T03_9000002016_13620cztM0_level2_quad_clean.evt |
| Size (bytes) | 374,330,880 | 61,637,760 |
| Size | 357.0 MB | 58.8 MB |
| Events in quadrant A | 2,353,950 | 389,725 |
| Events in quadrant B | 3,029,843 | 393,108 |
| Events in quadrant C | 2,402,390 | 383,535 |
| Events in quadrant D | 3,229,881 | 368,890 |
| Mode M0 | |||
|---|---|---|---|
| Quadrant | BADHDUFLAG | Total packets | Discarded packets |
| A | 0 | 9835 | 2 |
| B | 0 | 11921 | 1 |
| C | 0 | 9859 | 1 |
| D | 0 | 12781 | 1 |
| Mode SS | |||
|---|---|---|---|
| Quadrant | BADHDUFLAG | Total packets | Discarded packets |
| A | 0 | 98 | 0 |
| B | 0 | 98 | 0 |
| C | 0 | 98 | 0 |
| D | 0 | 98 | 0 |
| Mode M9 | |||
|---|---|---|---|
| Quadrant | BADHDUFLAG | Total packets | Discarded packets |
| A | 0 | 13 | 0 |
| B | 0 | 13 | 0 |
| C | 0 | 13 | 0 |
| D | 0 | 13 | 0 |
| Quadrant | Total seconds | Saturated seconds | Saturation percentage |
|---|---|---|---|
| A | 4707 | 48 | 1.019758% |
| B | 4707 | 113 | 2.400680% |
| C | 4707 | 21 | 0.446144% |
| D | 4707 | 108 | 2.294455% |
Noise dominated data is calculated using 1-second bins in cleaned event files. If a bin has >2000 counts, and if more than 50% of those come from <1% of pixels, then it is considered to be noise-dominated and hence unusable.
| Quadrant | # 1 sec bins | Bins with >0 counts | Bins with >2000 counts | High rate bins dominated by noise | Noise dominated (total time) | Noise dominated (detector-on time) | Marked lightcurve |
|---|---|---|---|---|---|---|---|
| A | 6078 | 4709 | 1 | 1 | 0.02% | 0.02% | 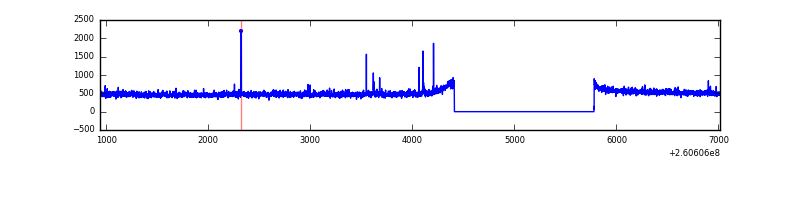 |
| B | 6078 | 4709 | 23 | 23 | 0.38% | 0.49% | 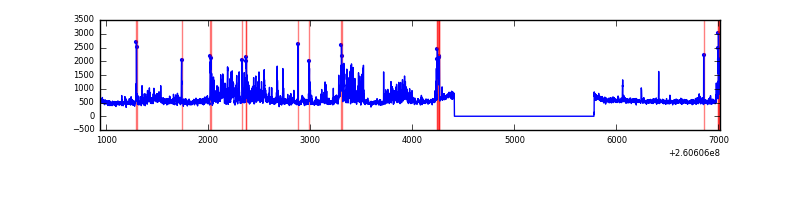 |
| C | 6078 | 4709 | 0 | 0 | 0.00% | 0.00% | 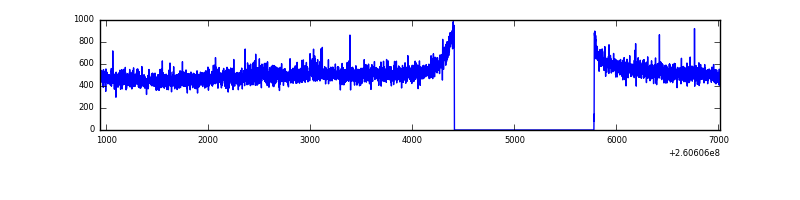 |
| D | 6078 | 4709 | 86 | 86 | 1.41% | 1.83% | 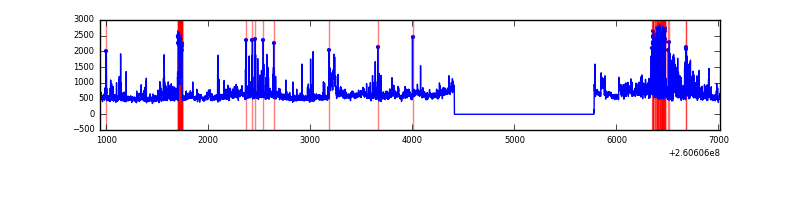 |
Top three noisy pixels from each quadrant. If the there are fewer than three noisy pixels in the level2.evt file, extra rows are filled as -1
| Pixel properties | Quadrant properties | ||||||
|---|---|---|---|---|---|---|---|
| Quadrant | DetID | PixID | Counts | Sigma | Mean | Median | Sigma |
| A | 15 | 69 | 19609 | 157.36 | 603 | 591 | 120.9 |
| A | 1 | 162 | 10569 | 82.56 | 603 | 591 | 120.9 |
| A | 0 | 226 | 5390 | 39.71 | 603 | 591 | 120.9 |
| B | 0 | 219 | 411878 | 3704.77 | 599 | 585 | 111.0 |
| B | 3 | 64 | 84180 | 752.99 | 599 | 585 | 111.0 |
| B | 0 | 214 | 62213 | 555.12 | 599 | 585 | 111.0 |
| C | 3 | 233 | 134676 | 1011.28 | 580 | 584 | 132.6 |
| C | 13 | 61 | 4294 | 27.98 | 580 | 584 | 132.6 |
| C | 8 | 222 | 2022 | 10.84 | 580 | 584 | 132.6 |
| D | 5 | 222 | 450252 | 3237.92 | 580 | 564 | 138.9 |
| D | 8 | 195 | 331834 | 2385.27 | 580 | 564 | 138.9 |
| D | 13 | 122 | 134196 | 962.2 | 580 | 564 | 138.9 |
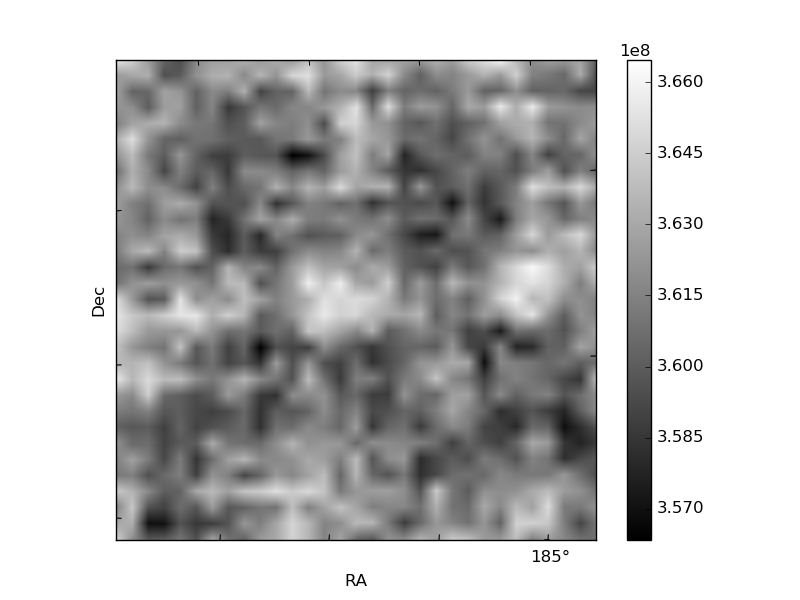
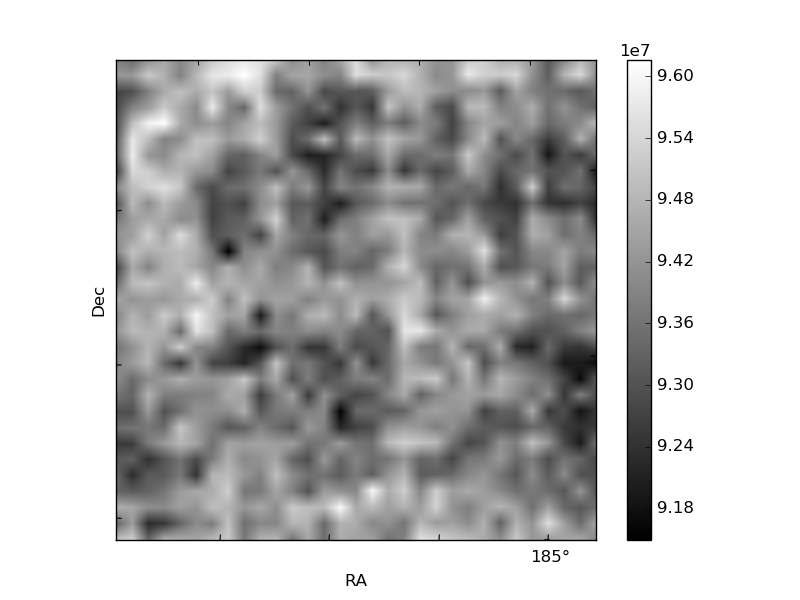
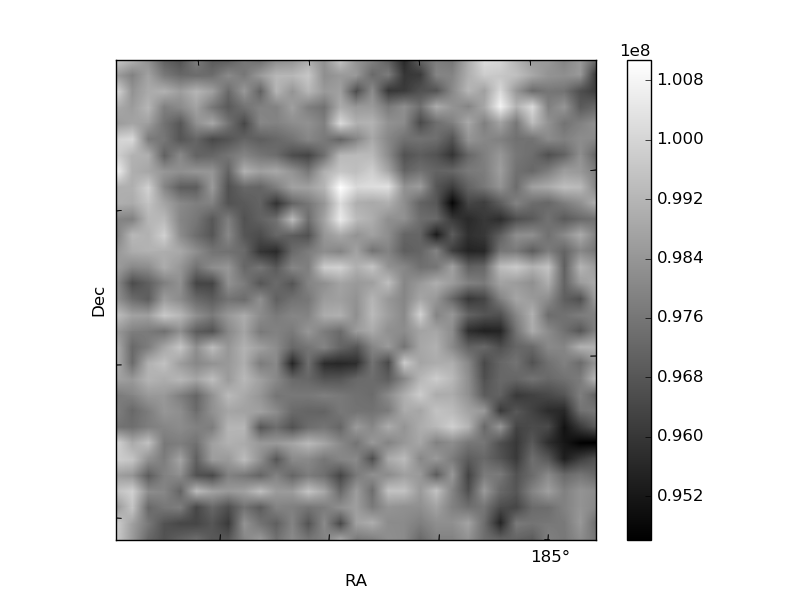
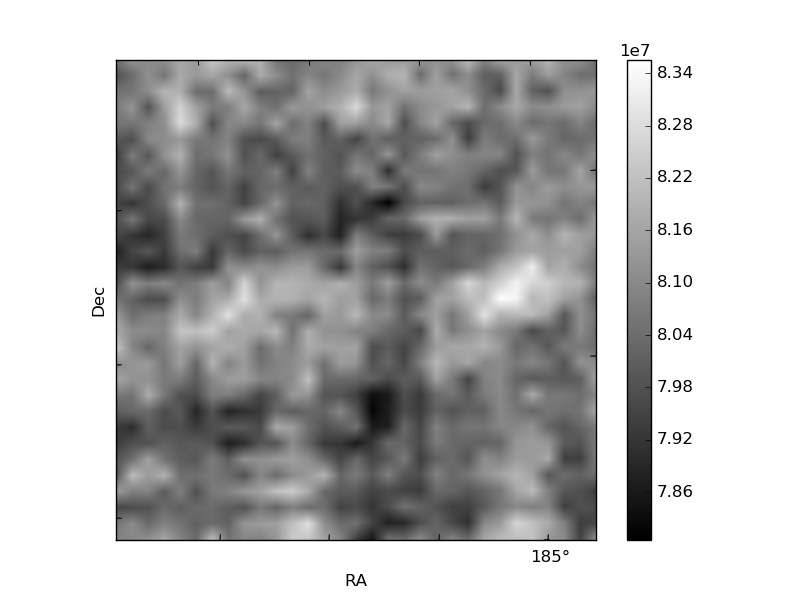
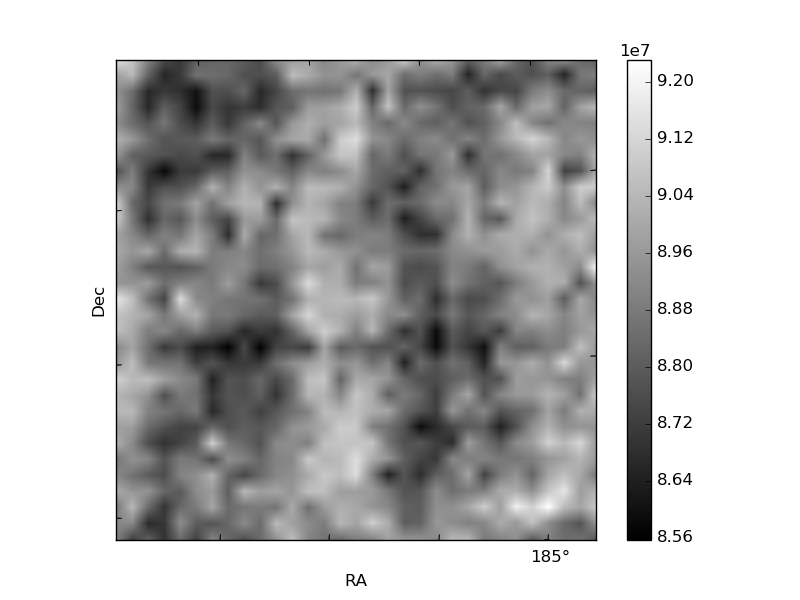
Histogram calculated using DETX and DETY for each event in the final _common_clean file
| Quadrant A | 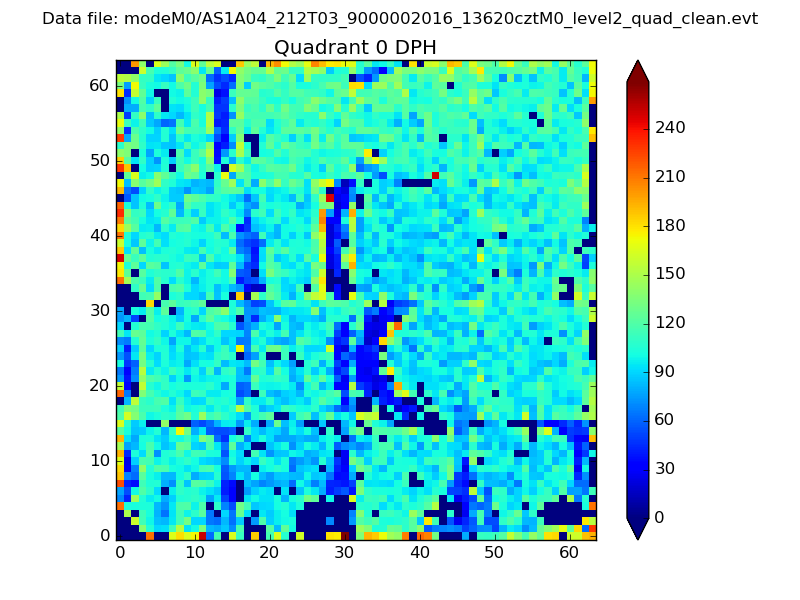 |
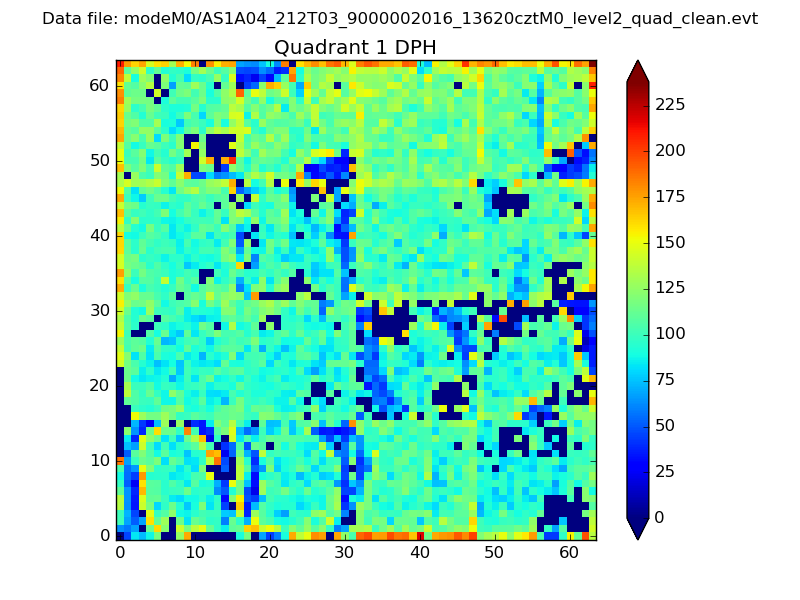 |
Quadrant B |
|---|---|---|---|
| Quadrant D | 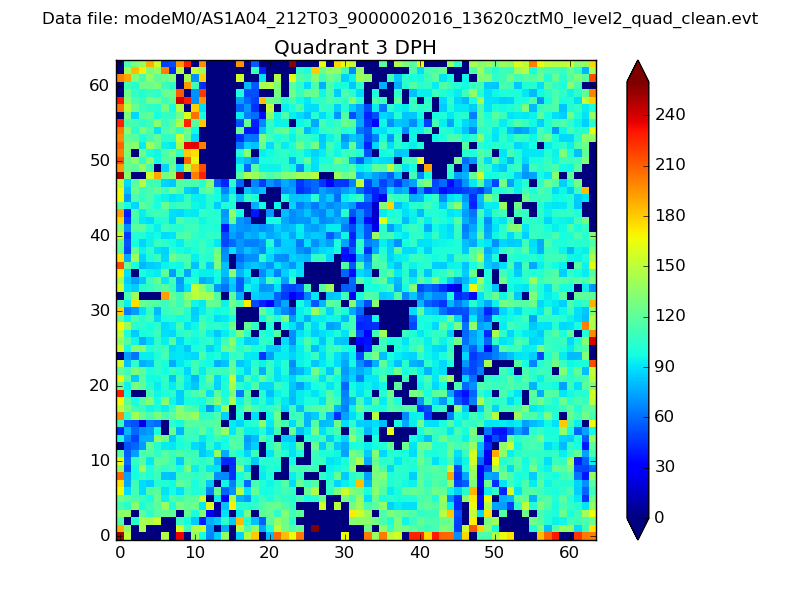 |
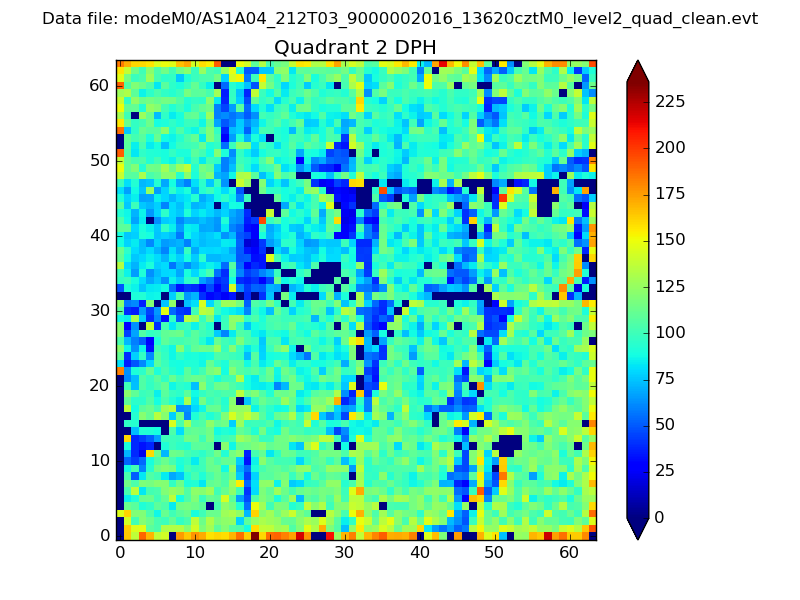 |
Quadrant C |
| Plot type | Count rate plots | Images |
|---|---|---|
| Comparison with Poisson distribution Blue bars denote a histogram of data divided into 1 sec bins. Red curve is a Poisson curve with rate = median count rate of data. |
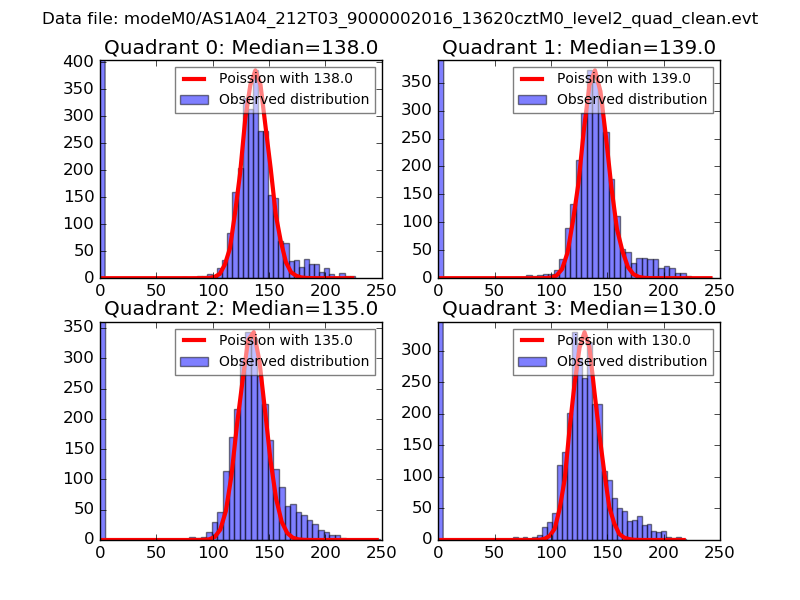 |
 |
| Quadrant-wise count rates Data is divided into 100 sec bins |
 |
|
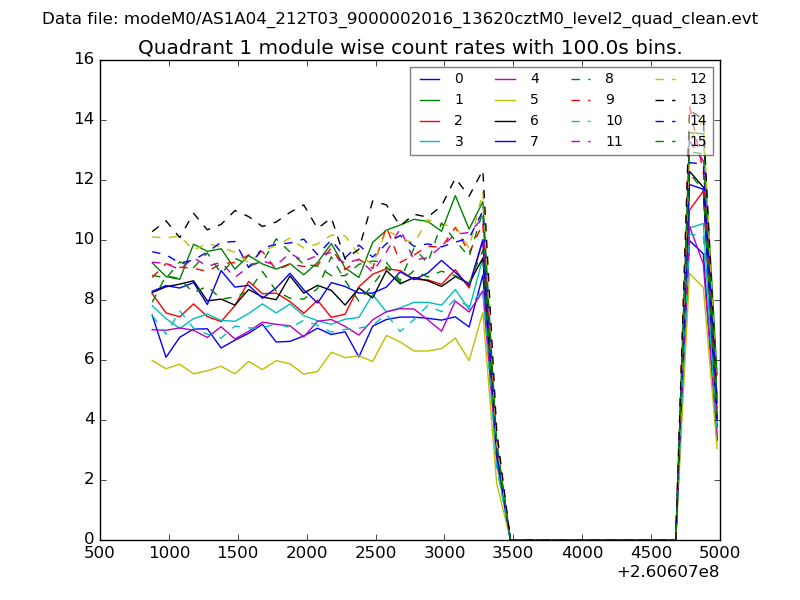
| Module-wise count rates for Quadrant A Data is divided into 100 sec bins |
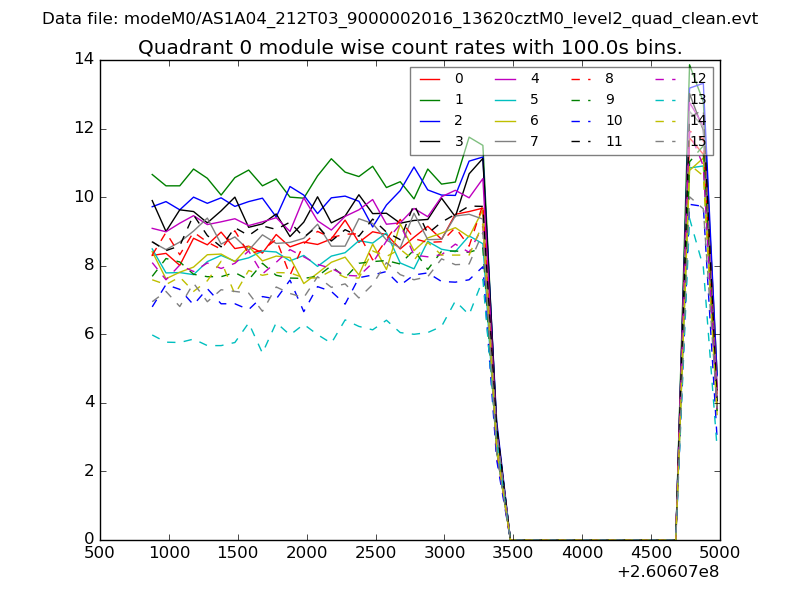 |
 |
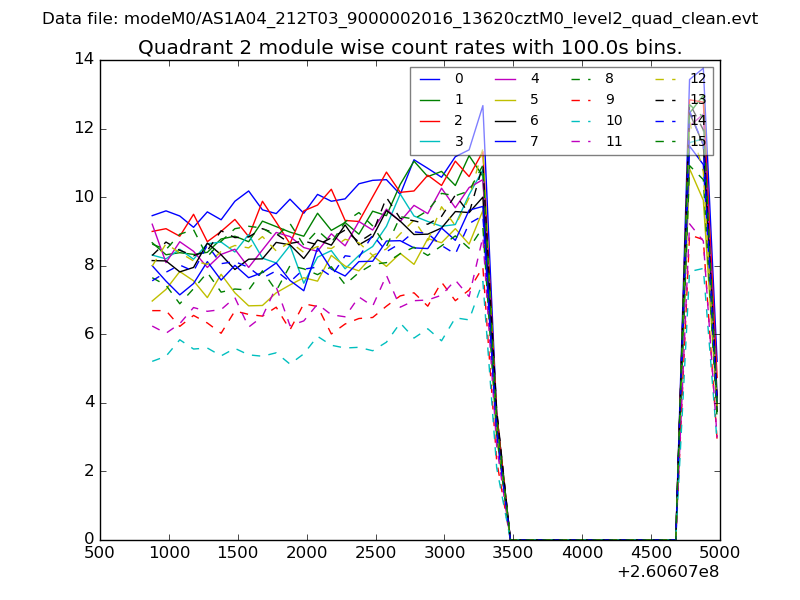
| Module-wise count rates for Quadrant B Data is divided into 100 sec bins |
 |
 |
| Module-wise count rates for Quadrant C Data is divided into 100 sec bins |
 |
 |
| Module-wise count rates for Quadrant D Data is divided into 100 sec bins |
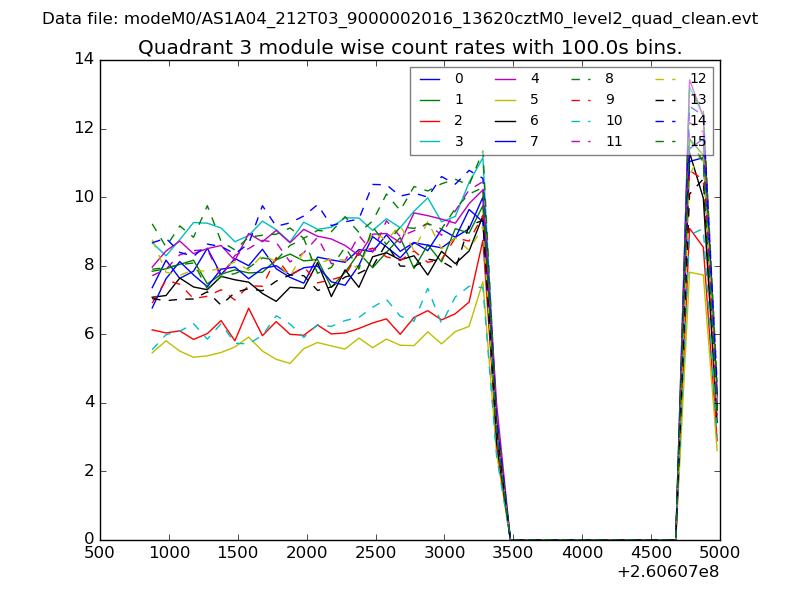 |
 |
| Parameter | Plot |
|---|---|
| CZT HV Monitor | 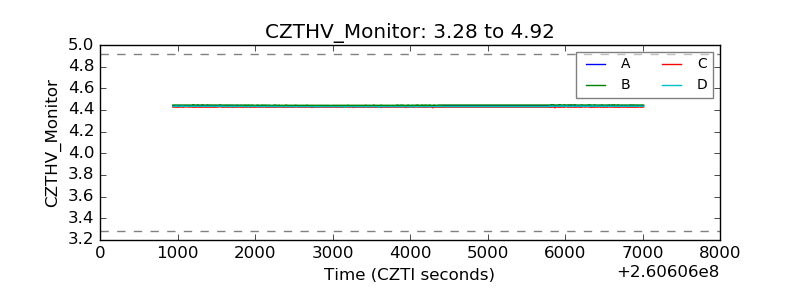 |
| D_VDD | 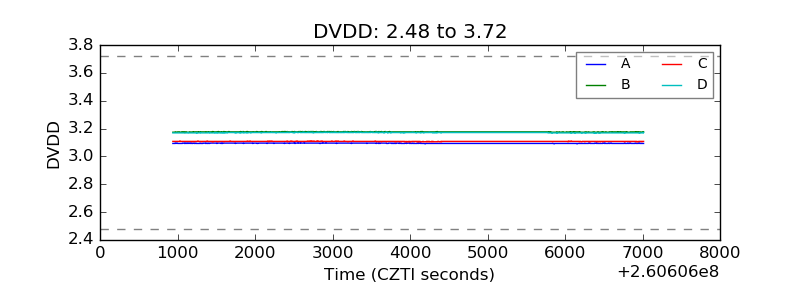 |
| Temperature 1 | 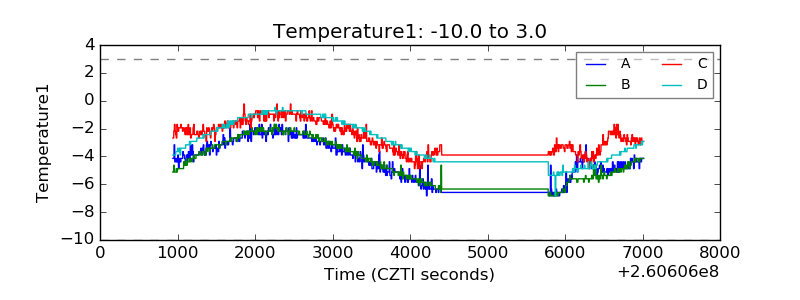 |
| Veto HV Monitor | 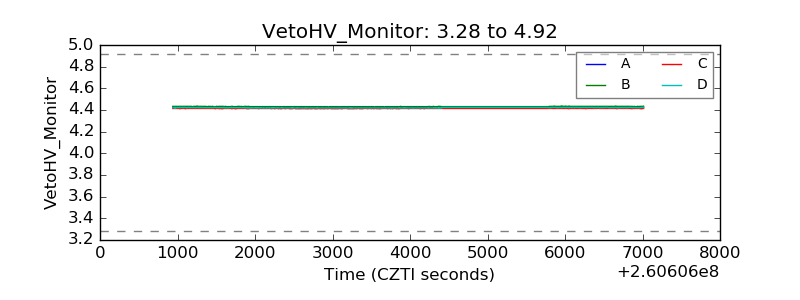 |
| Veto LLD | 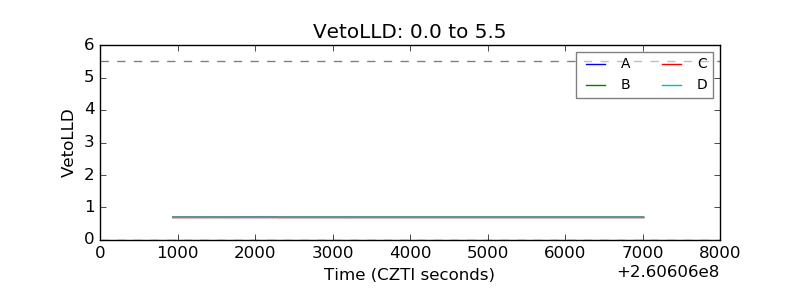 |
| Alpha Counter |  |
| _CPM_Rate | 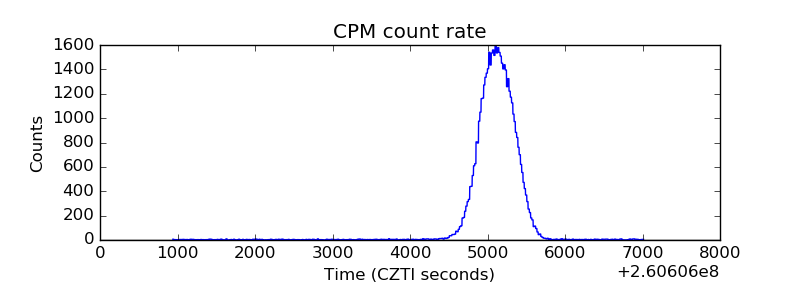 |
| CZT Counter | 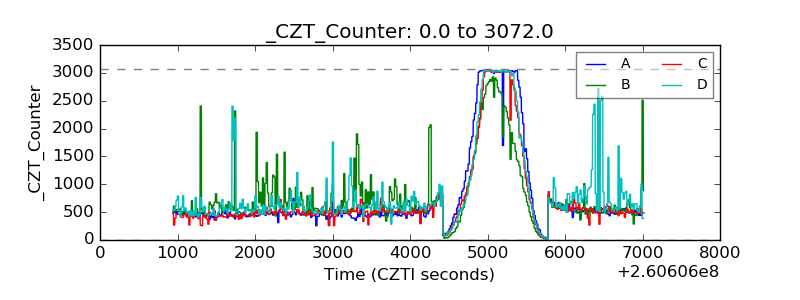 |
| +2.5 Volts monitor |  |
| +5 Volts monitor |  |
| _ROLL_ROT | 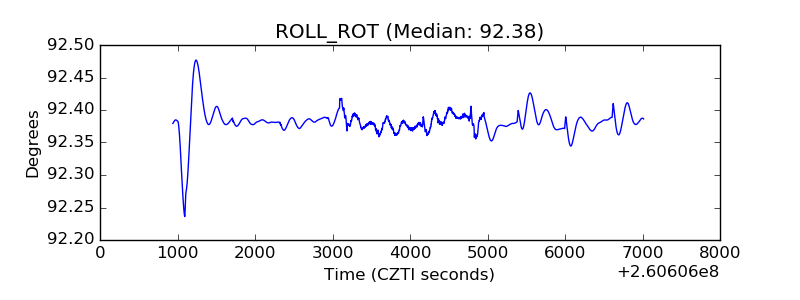 |
| _Roll_DEC | 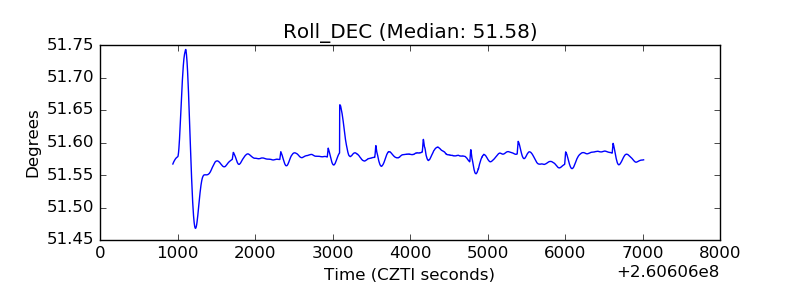 |
| _Roll_RA | 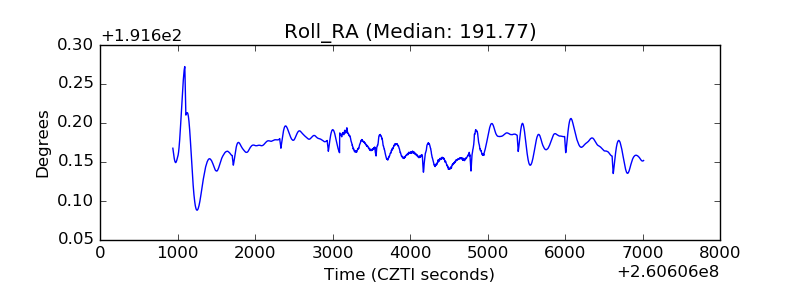 |
| Veto Counter | 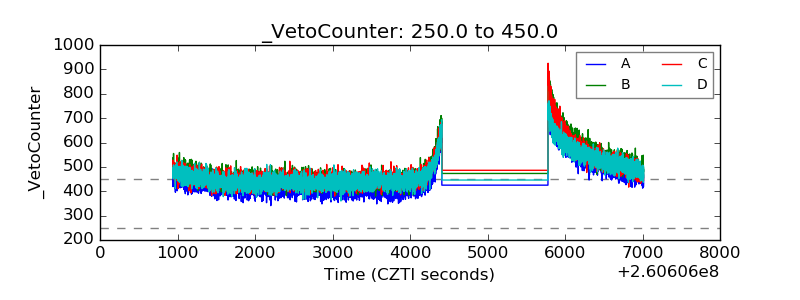 |