| Param | Original file | Final file |
|---|---|---|
| Filename | modeM0/AS1A04_212T03_9000002016_13622cztM0_level2.evt | modeM0/AS1A04_212T03_9000002016_13622cztM0_level2_quad_clean.evt |
| Size (bytes) | 282,553,920 | 46,883,520 |
| Size | 269.5 MB | 44.7 MB |
| Events in quadrant A | 2,078,298 | 291,067 |
| Events in quadrant B | 2,181,996 | 295,083 |
| Events in quadrant C | 1,870,269 | 285,254 |
| Events in quadrant D | 2,164,941 | 277,257 |
| Mode M0 | |||
|---|---|---|---|
| Quadrant | BADHDUFLAG | Total packets | Discarded packets |
| A | 0 | 8541 | 1 |
| B | 0 | 8806 | 1 |
| C | 0 | 7827 | 1 |
| D | 0 | 8678 | 1 |
| Mode SS | |||
|---|---|---|---|
| Quadrant | BADHDUFLAG | Total packets | Discarded packets |
| A | 0 | 78 | 0 |
| B | 0 | 78 | 0 |
| C | 0 | 78 | 0 |
| D | 0 | 78 | 0 |
| Mode M9 | |||
|---|---|---|---|
| Quadrant | BADHDUFLAG | Total packets | Discarded packets |
| A | 0 | 3 | 0 |
| B | 0 | 3 | 0 |
| C | 0 | 3 | 0 |
| D | 0 | 4 | 0 |
| Quadrant | Total seconds | Saturated seconds | Saturation percentage |
|---|---|---|---|
| A | 3825 | 70 | 1.830065% |
| B | 3825 | 32 | 0.836601% |
| C | 3825 | 7 | 0.183007% |
| D | 3825 | 78 | 2.039216% |
Noise dominated data is calculated using 1-second bins in cleaned event files. If a bin has >2000 counts, and if more than 50% of those come from <1% of pixels, then it is considered to be noise-dominated and hence unusable.
| Quadrant | # 1 sec bins | Bins with >0 counts | Bins with >2000 counts | High rate bins dominated by noise | Noise dominated (total time) | Noise dominated (detector-on time) | Marked lightcurve |
|---|---|---|---|---|---|---|---|
| A | 3826 | 3826 | 43 | 43 | 1.12% | 1.12% | 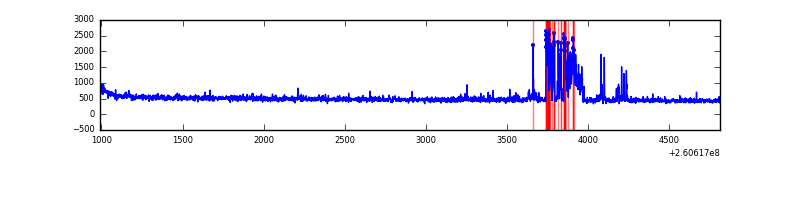 |
| B | 3826 | 3826 | 2 | 2 | 0.05% | 0.05% | 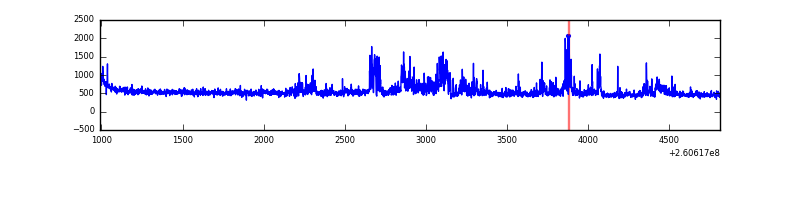 |
| C | 3826 | 3826 | 0 | 0 | 0.00% | 0.00% | 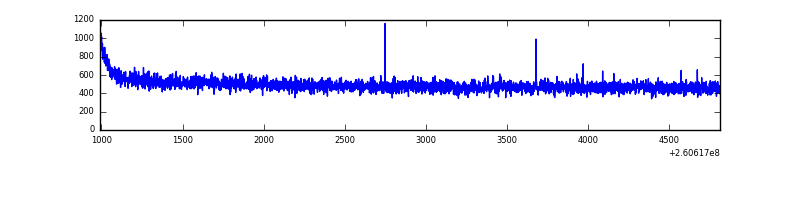 |
| D | 3826 | 3826 | 60 | 60 | 1.57% | 1.57% | 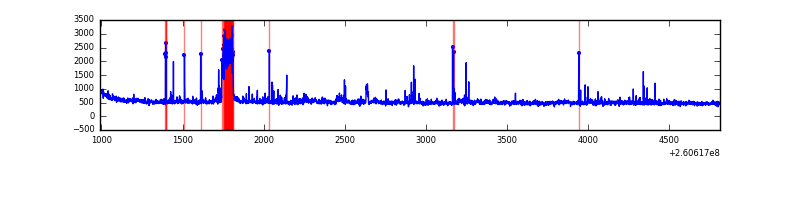 |
Top three noisy pixels from each quadrant. If the there are fewer than three noisy pixels in the level2.evt file, extra rows are filled as -1
| Pixel properties | Quadrant properties | ||||||
|---|---|---|---|---|---|---|---|
| Quadrant | DetID | PixID | Counts | Sigma | Mean | Median | Sigma |
| A | 15 | 69 | 244880 | 2580.12 | 469 | 460 | 94.7 |
| A | 1 | 162 | 14026 | 143.2 | 469 | 460 | 94.7 |
| A | 1 | 178 | 4795 | 45.76 | 469 | 460 | 94.7 |
| B | 0 | 219 | 212699 | 2400.96 | 467 | 457 | 88.4 |
| B | 0 | 85 | 98501 | 1109.11 | 467 | 457 | 88.4 |
| B | 4 | 142 | 23002 | 255.04 | 467 | 457 | 88.4 |
| C | 3 | 233 | 112061 | 1080.67 | 450 | 452 | 103.3 |
| C | 13 | 61 | 3269 | 27.28 | 450 | 452 | 103.3 |
| C | 14 | 234 | 2154 | 16.48 | 450 | 452 | 103.3 |
| D | 8 | 195 | 203504 | 1887.57 | 448 | 436 | 107.6 |
| D | 5 | 222 | 142116 | 1316.95 | 448 | 436 | 107.6 |
| D | 13 | 122 | 82728 | 764.93 | 448 | 436 | 107.6 |
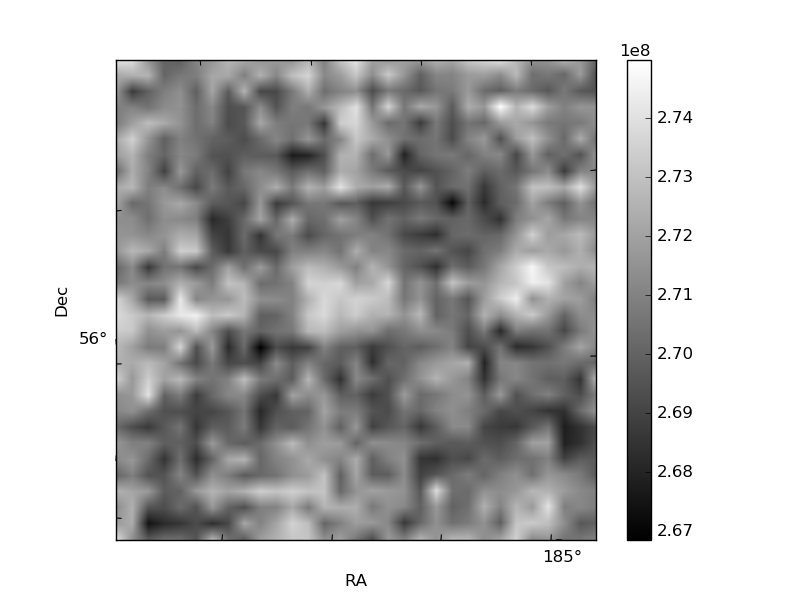
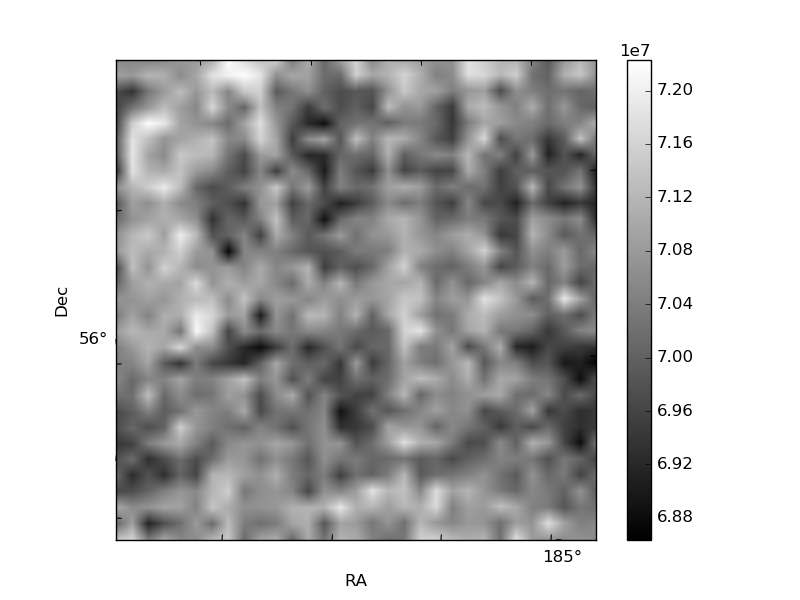
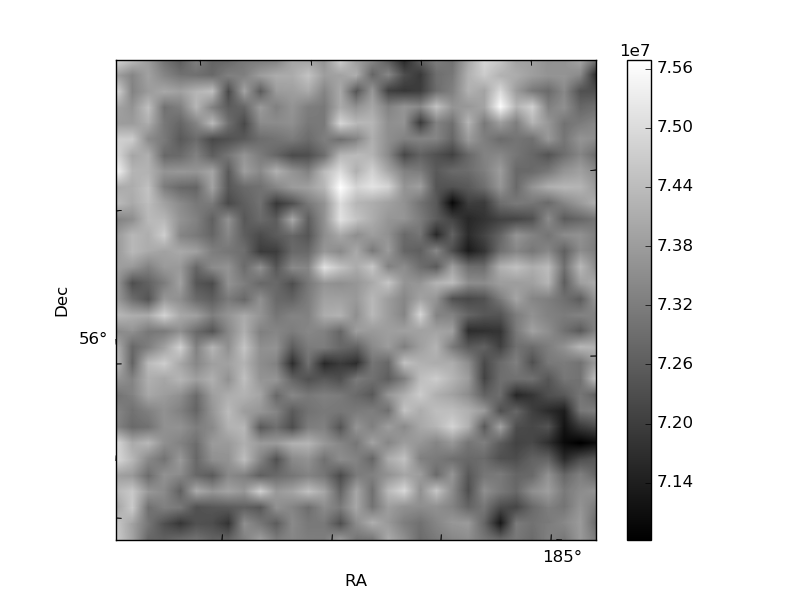
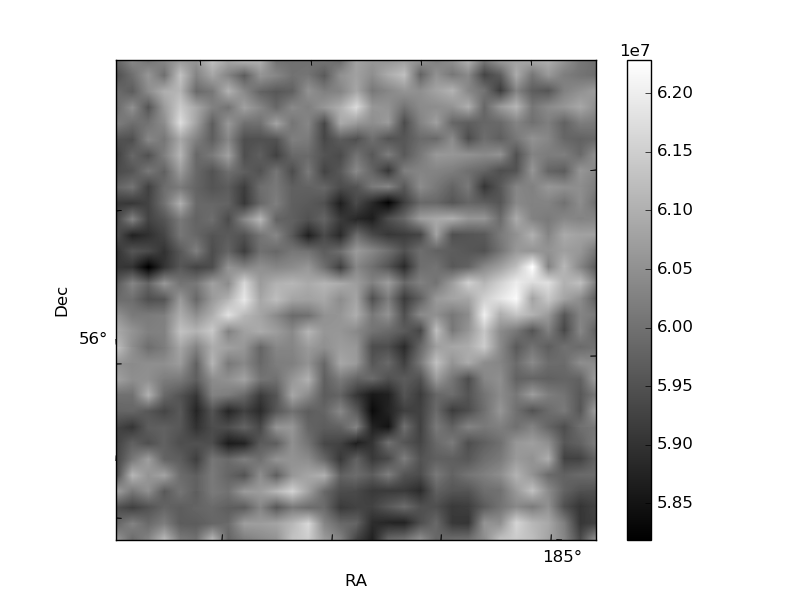
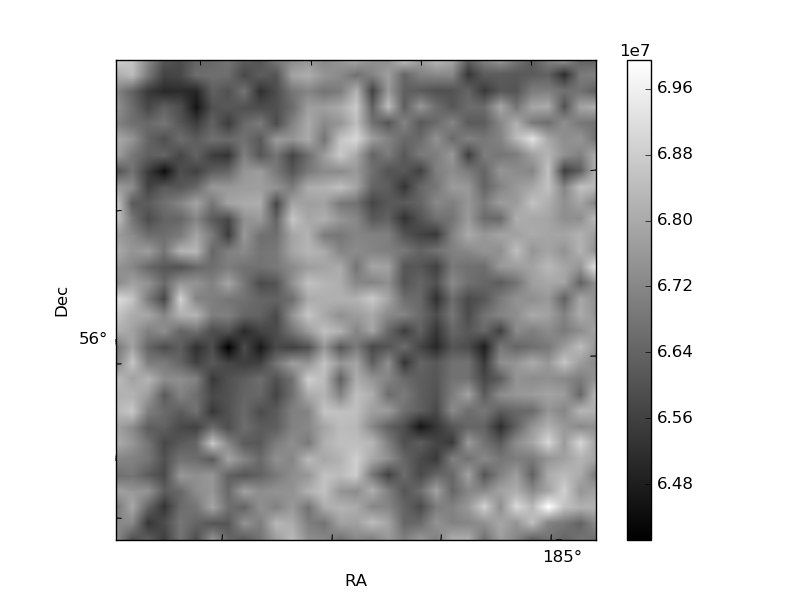
Histogram calculated using DETX and DETY for each event in the final _common_clean file
| Quadrant A | 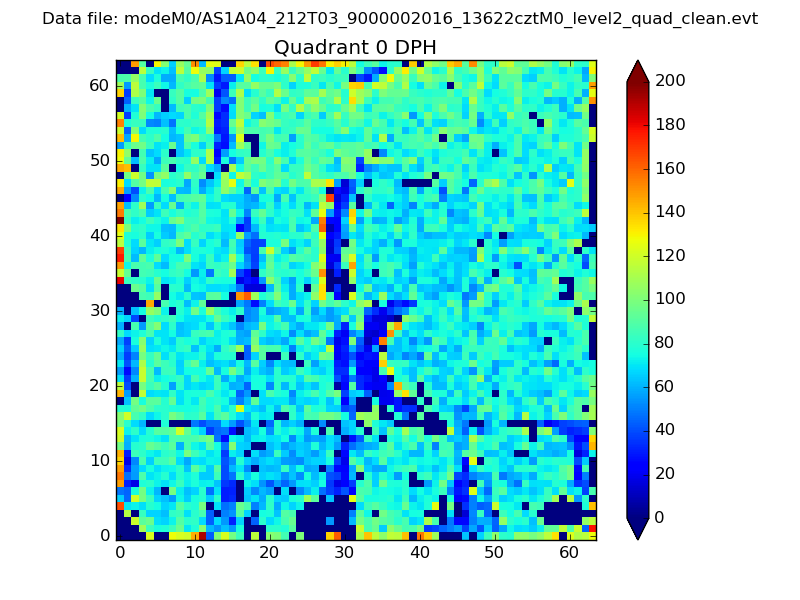 |
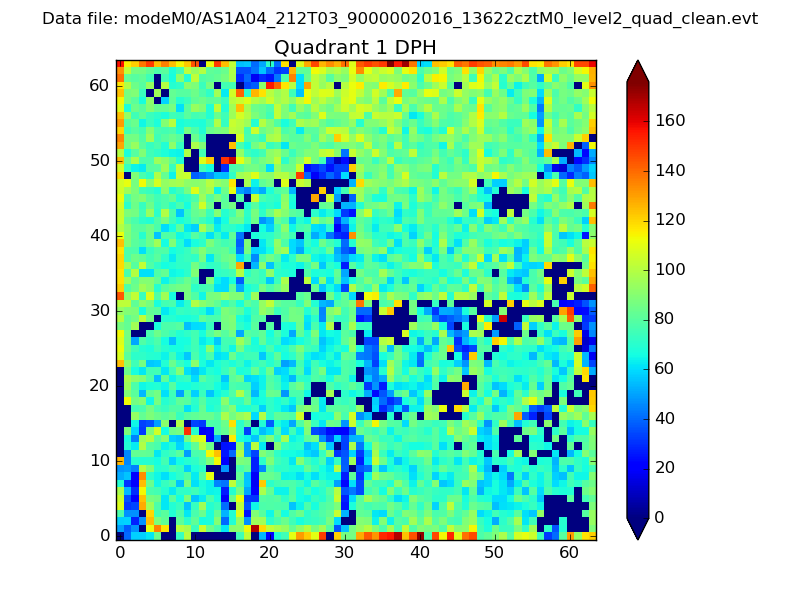 |
Quadrant B |
|---|---|---|---|
| Quadrant D |  |
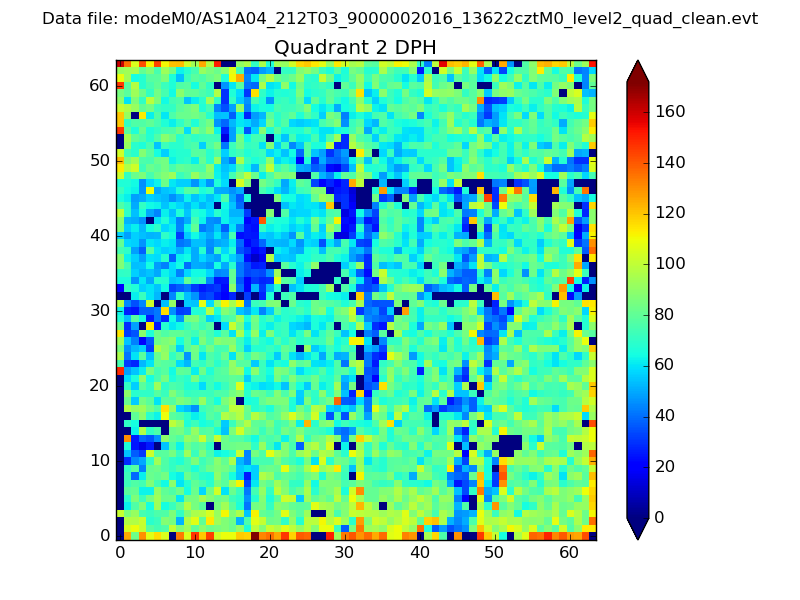 |
Quadrant C |
| Plot type | Count rate plots | Images |
|---|---|---|
| Comparison with Poisson distribution Blue bars denote a histogram of data divided into 1 sec bins. Red curve is a Poisson curve with rate = median count rate of data. |
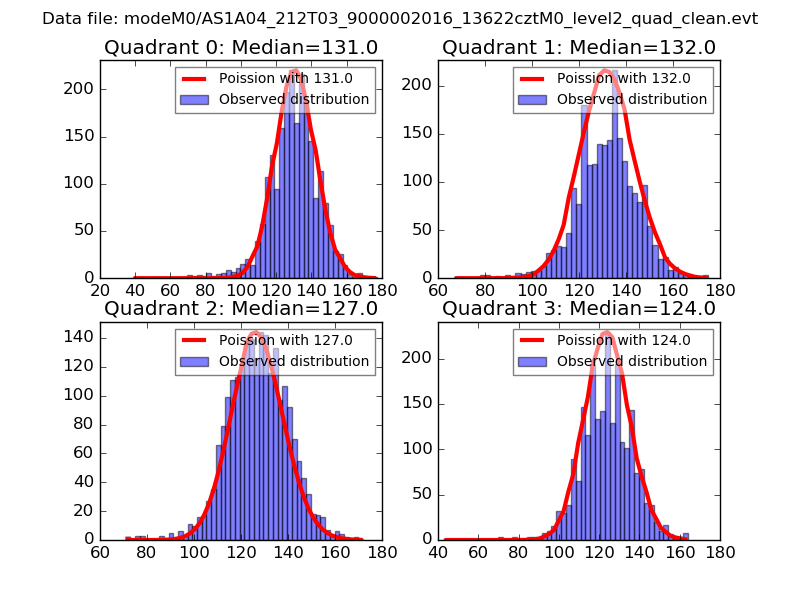 |
 |
| Quadrant-wise count rates Data is divided into 100 sec bins |
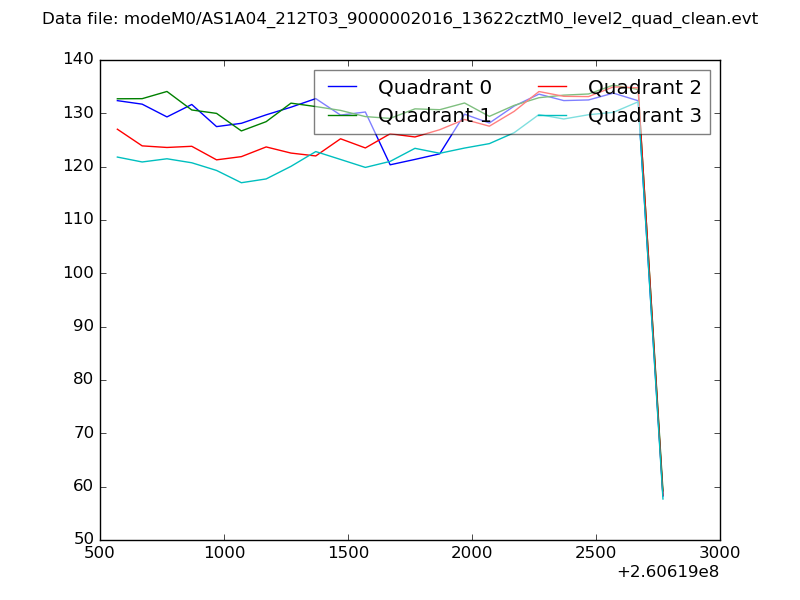 |
|
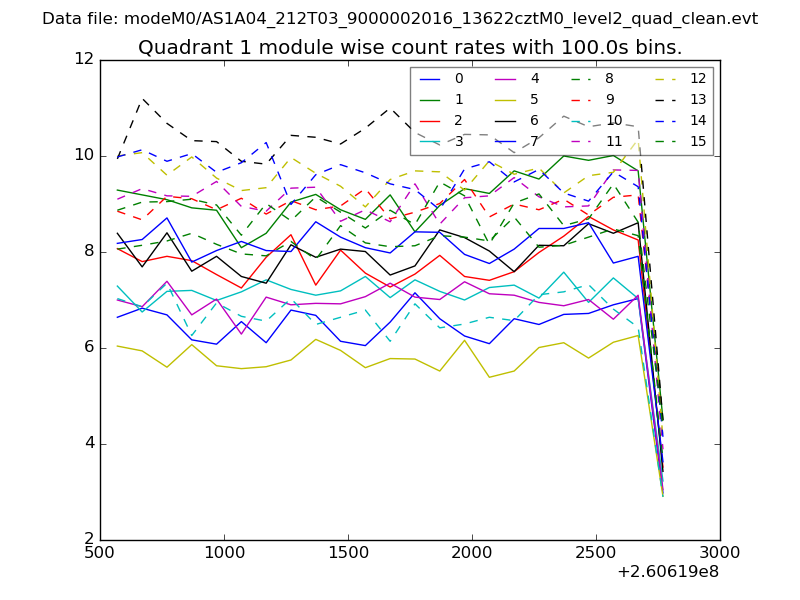
| Module-wise count rates for Quadrant A Data is divided into 100 sec bins |
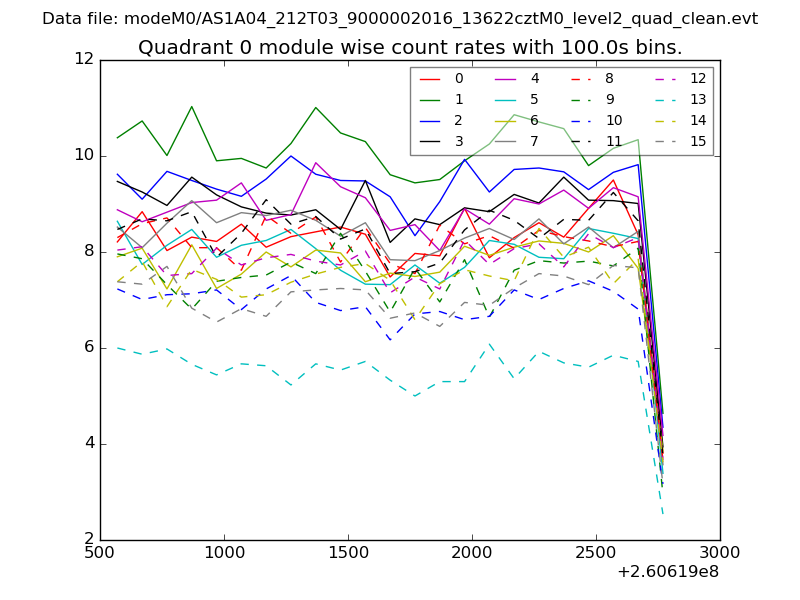 |
 |
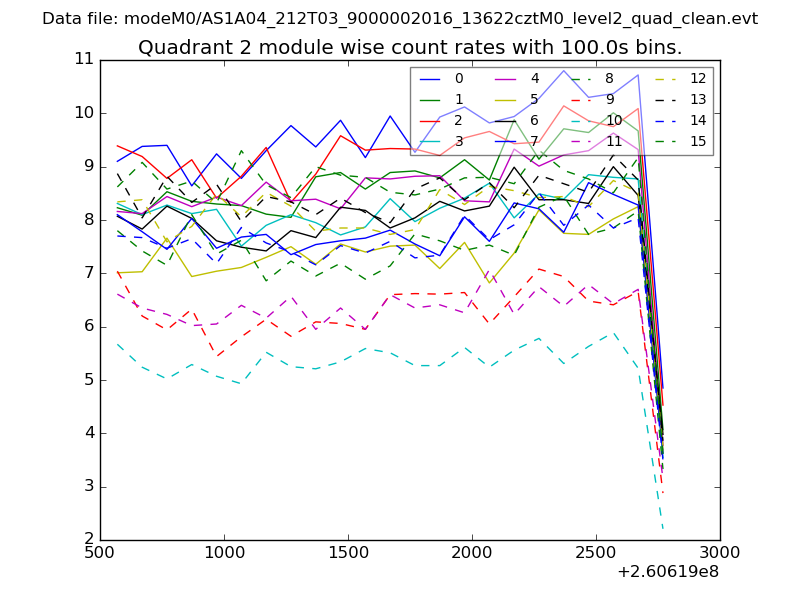
| Module-wise count rates for Quadrant B Data is divided into 100 sec bins |
 |
 |
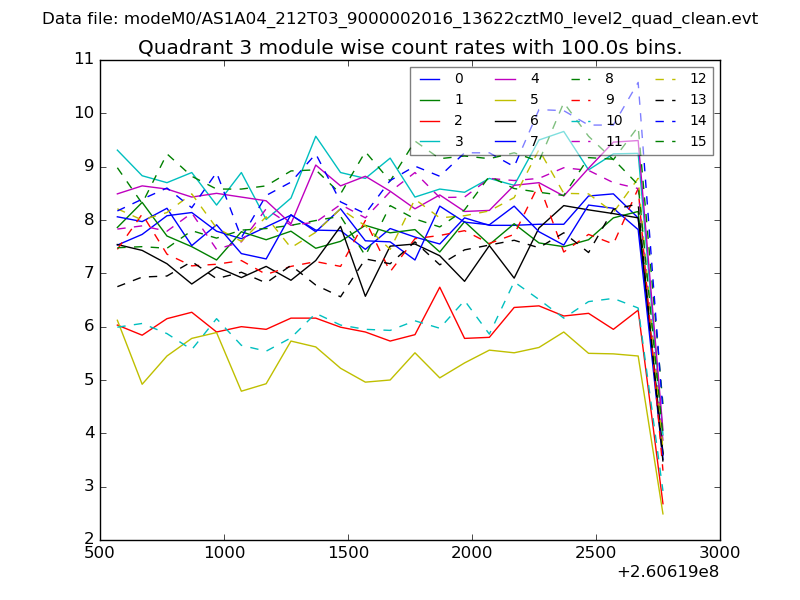
| Module-wise count rates for Quadrant C Data is divided into 100 sec bins |
 |
 |
| Module-wise count rates for Quadrant D Data is divided into 100 sec bins |
 |
 |
| Parameter | Plot |
|---|---|
| CZT HV Monitor | 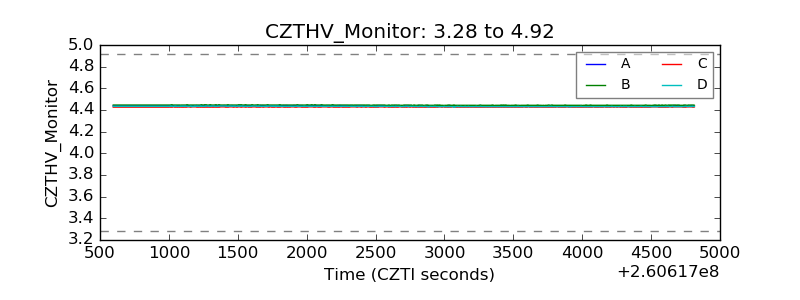 |
| D_VDD | 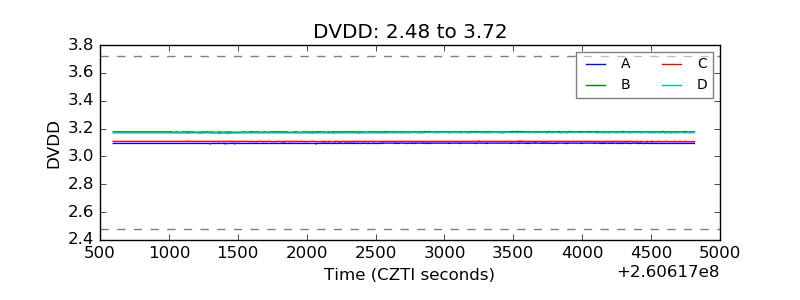 |
| Temperature 1 | 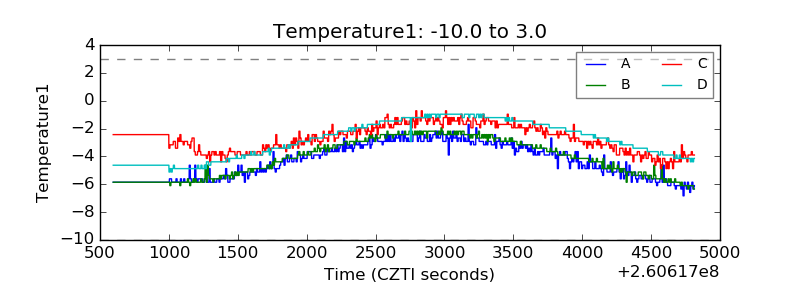 |
| Veto HV Monitor |  |
| Veto LLD | 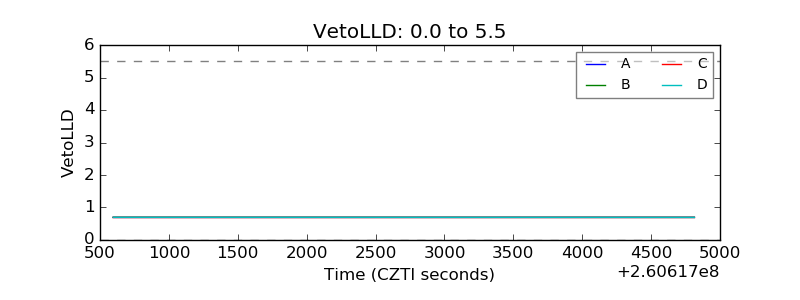 |
| Alpha Counter | 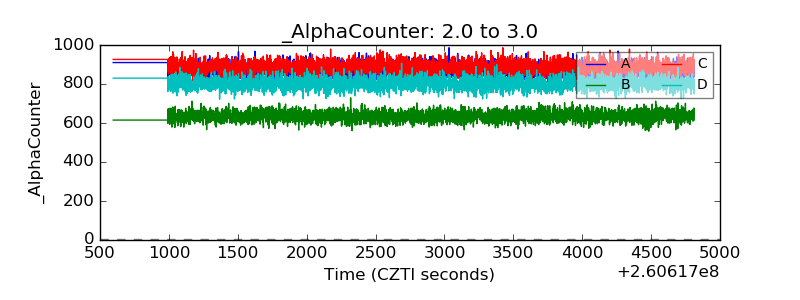 |
| _CPM_Rate | 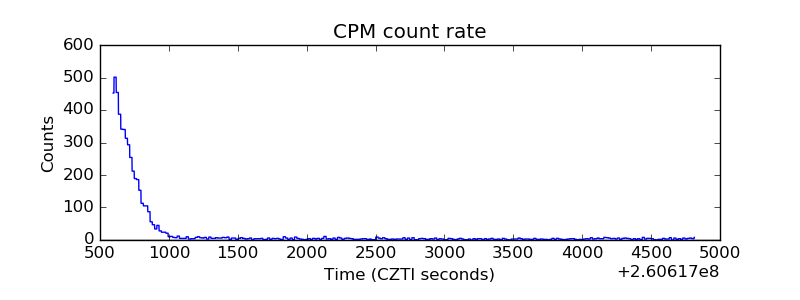 |
| CZT Counter |  |
| +2.5 Volts monitor | 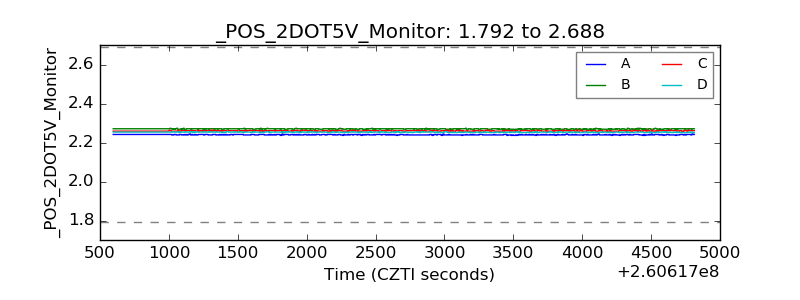 |
| +5 Volts monitor |  |
| _ROLL_ROT | 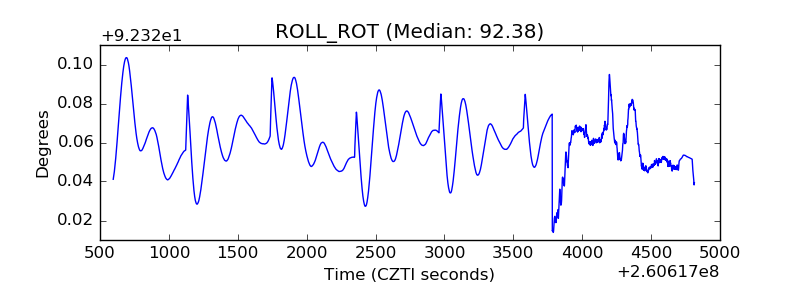 |
| _Roll_DEC | 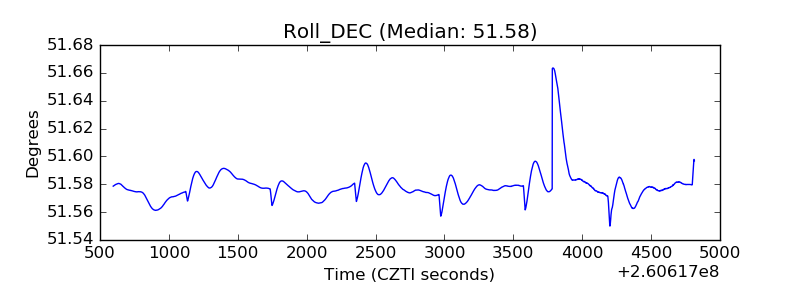 |
| _Roll_RA | 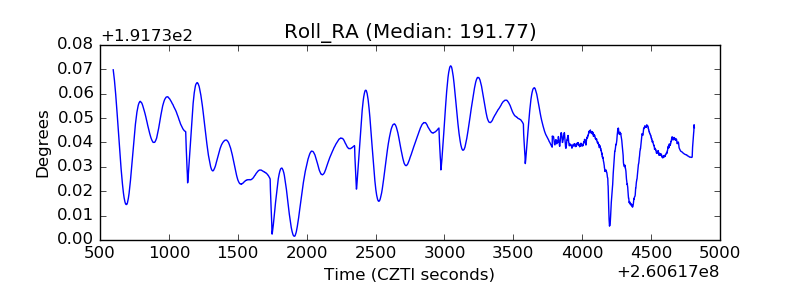 |
| Veto Counter | 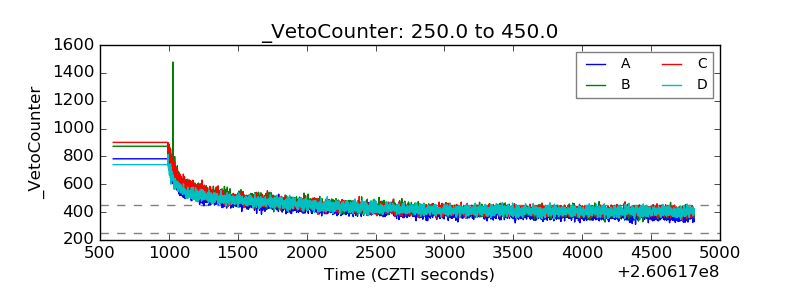 |