| Param | Original file | Final file |
|---|---|---|
| Filename | modeM0/AS1G08_038T01_9000002018cztM0_level2.fits | modeM0/AS1G08_038T01_9000002018cztM0_level2_quad_clean.evt |
| Size (bytes) | 601,871,040 | 485,832,960 |
| Size | 574.0 MB | 463.3 MB |
| Events in quadrant A | 3,699,286 | 2,548,384 |
| Events in quadrant B | 3,542,986 | 2,600,257 |
| Events in quadrant C | 3,689,946 | 2,794,300 |
| Events in quadrant D | 2,999,868 | 2,475,067 |
| Mode M0 | |||
|---|---|---|---|
| Quadrant | BADHDUFLAG | Total packets | Discarded packets |
| A | 0 | 129428 | 0 |
| B | 0 | 138740 | 0 |
| C | 0 | 129935 | 0 |
| D | 0 | 208649 | 0 |
| Mode SS | |||
|---|---|---|---|
| Quadrant | BADHDUFLAG | Total packets | Discarded packets |
| A | 0 | 1280 | 0 |
| B | 0 | 1280 | 0 |
| C | 0 | 1276 | 0 |
| D | 0 | 1278 | 0 |
| Mode M9 | |||
|---|---|---|---|
| Quadrant | BADHDUFLAG | Total packets | Discarded packets |
| A | 0 | 110 | 0 |
| B | 0 | 110 | 0 |
| C | 0 | 110 | 0 |
| D | 0 | 110 | 0 |
| Quadrant | Total seconds | Saturated seconds | Saturation percentage |
|---|---|---|---|
| A | 62600 | 479 | 0.765176% |
| B | 62603 | 982 | 1.568615% |
| C | 62598 | 362 | 0.578293% |
| D | 62576 | 5298 | 8.466505% |
Noise dominated data is calculated using 1-second bins in cleaned event files. If a bin has >2000 counts, and if more than 50% of those come from <1% of pixels, then it is considered to be noise-dominated and hence unusable.
| Quadrant | # 1 sec bins | Bins with >0 counts | Bins with >2000 counts | High rate bins dominated by noise | Noise dominated (total time) | Noise dominated (detector-on time) | Marked lightcurve |
|---|---|---|---|---|---|---|---|
| A | 73835 | 62648 | 0 | 0 | 0.00% | 0.00% |  |
| B | 73835 | 62635 | 0 | 0 | 0.00% | 0.00% |  |
| C | 73835 | 62640 | 0 | 0 | 0.00% | 0.00% |  |
| D | 73835 | 62507 | 0 | 0 | 0.00% | 0.00% |  |
Top three noisy pixels from each quadrant. If the there are fewer than three noisy pixels in the level2.evt file, extra rows are filled as -1
| Pixel properties | Quadrant properties | ||||||
|---|---|---|---|---|---|---|---|
| Quadrant | DetID | PixID | Counts | Sigma | Mean | Median | Sigma |
| A | 0 | 29 | 3638 | 11.48 | 961 | 901 | 238.5 |
| A | 7 | 110 | 2966 | 8.66 | 961 | 901 | 238.5 |
| A | 0 | 30 | 2772 | 7.85 | 961 | 901 | 238.5 |
| B | 2 | 9 | 3037 | 11.42 | 937 | 895 | 187.6 |
| B | 14 | 254 | 2383 | 7.93 | 937 | 895 | 187.6 |
| B | 3 | 17 | 2346 | 7.74 | 937 | 895 | 187.6 |
| C | 1 | 81 | 2908 | 7.88 | 973 | 909 | 253.7 |
| C | 1 | 80 | 2893 | 7.82 | 973 | 909 | 253.7 |
| C | 1 | 65 | 2587 | 6.61 | 973 | 909 | 253.7 |
| D | 3 | 14 | 2248 | 6.3 | 859 | 782 | 232.9 |
| D | 6 | 67 | 2180 | 6.0 | 859 | 782 | 232.9 |
| D | 6 | 231 | 2172 | 5.97 | 859 | 782 | 232.9 |
Histogram calculated using DETX and DETY for each event in the final _common_clean file
| Quadrant A | 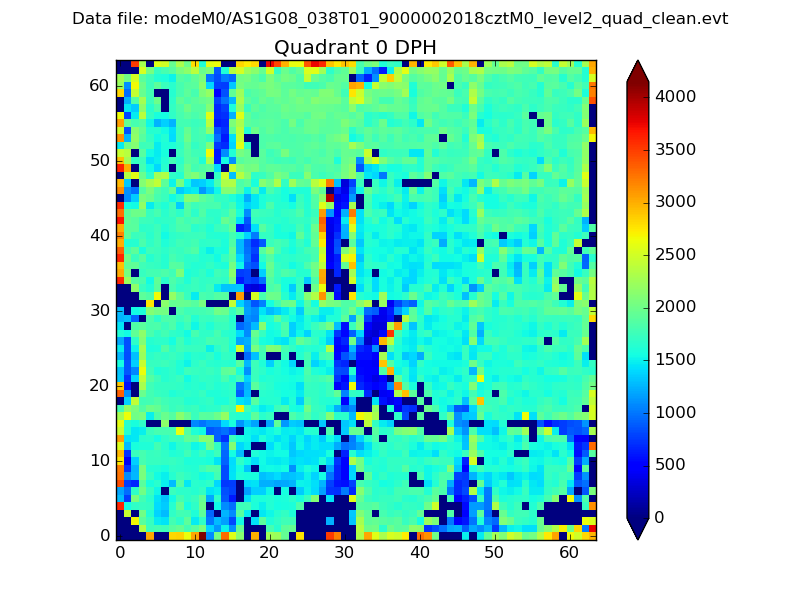 |
 |
Quadrant B |
|---|---|---|---|
| Quadrant D | 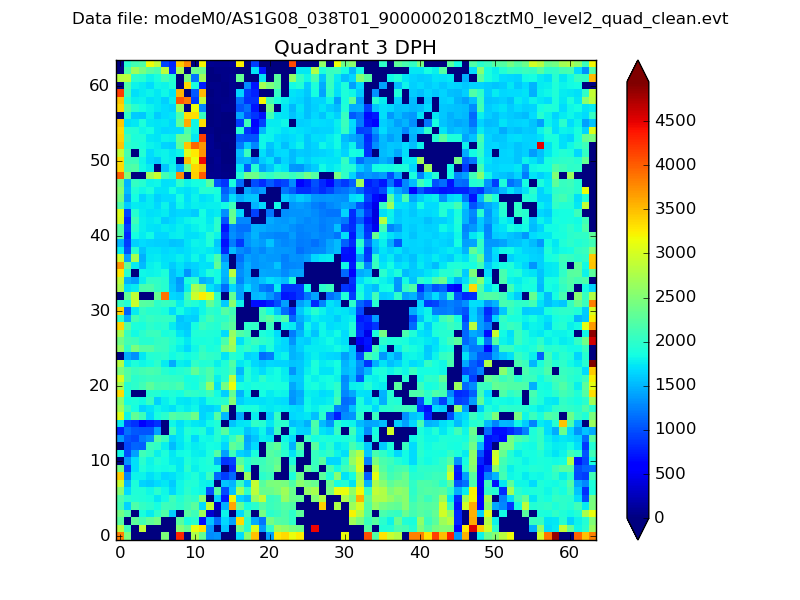 |
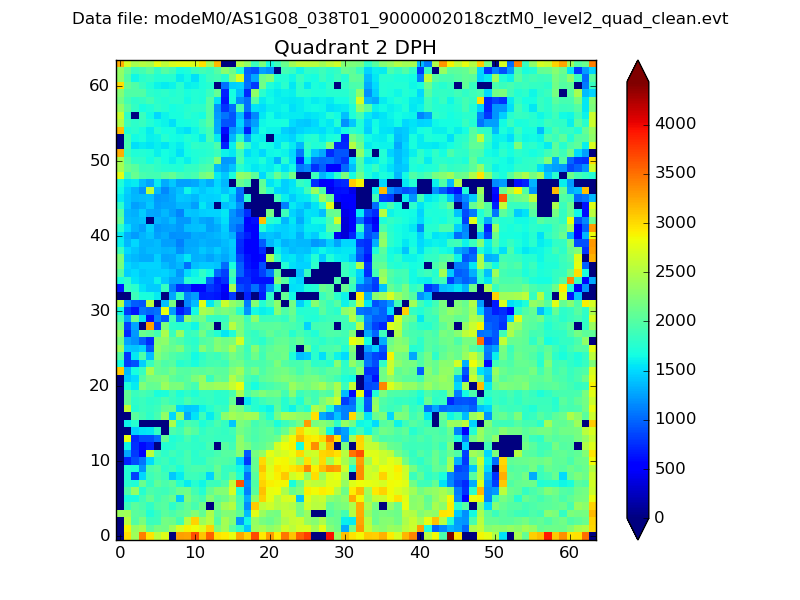 |
Quadrant C |
| Plot type | Count rate plots | Images |
|---|---|---|
| Comparison with Poisson distribution Blue bars denote a histogram of data divided into 1 sec bins. Red curve is a Poisson curve with rate = median count rate of data. |
 |
 |
| Quadrant-wise count rates Data is divided into 100 sec bins |
 |
|
| Module-wise count rates for Quadrant A Data is divided into 100 sec bins |
 |
 |
| Module-wise count rates for Quadrant B Data is divided into 100 sec bins |
 |
 |
| Module-wise count rates for Quadrant C Data is divided into 100 sec bins |
 |
 |
| Module-wise count rates for Quadrant D Data is divided into 100 sec bins |
 |
 |
| Parameter | Plot |
|---|---|
| CZT HV Monitor |  |
| D_VDD |  |
| Temperature 1 |  |
| Veto HV Monitor |  |
| Veto LLD |  |
| Alpha Counter |  |
| _CPM_Rate |  |
| CZT Counter |  |
| +2.5 Volts monitor |  |
| +5 Volts monitor |  |
| _ROLL_ROT |  |
| _Roll_DEC |  |
| _Roll_RA |  |
| Veto Counter |  |