| Param | Original file | Final file |
|---|---|---|
| Filename | modeM0/AS1G08_038T01_9000002018_13622cztM0_level2.evt | modeM0/AS1G08_038T01_9000002018_13622cztM0_level2_quad_clean.evt |
| Size (bytes) | 207,014,400 | 27,737,280 |
| Size | 197.4 MB | 26.5 MB |
| Events in quadrant A | 1,228,852 | 159,108 |
| Events in quadrant B | 1,473,606 | 165,003 |
| Events in quadrant C | 1,253,798 | 178,805 |
| Events in quadrant D | 2,151,655 | 167,177 |
| Mode M0 | |||
|---|---|---|---|
| Quadrant | BADHDUFLAG | Total packets | Discarded packets |
| A | 0 | 5045 | 2 |
| B | 0 | 5793 | 1 |
| C | 0 | 5089 | 1 |
| D | 0 | 8045 | 1 |
| Mode SS | |||
|---|---|---|---|
| Quadrant | BADHDUFLAG | Total packets | Discarded packets |
| A | 0 | 48 | 0 |
| B | 0 | 48 | 0 |
| C | 0 | 48 | 0 |
| D | 0 | 48 | 0 |
| Mode M9 | |||
|---|---|---|---|
| Quadrant | BADHDUFLAG | Total packets | Discarded packets |
| A | 0 | 10 | 0 |
| B | 0 | 10 | 0 |
| C | 0 | 10 | 0 |
| D | 0 | 10 | 0 |
| Quadrant | Total seconds | Saturated seconds | Saturation percentage |
|---|---|---|---|
| A | 2352 | 112 | 4.761905% |
| B | 2352 | 145 | 6.164966% |
| C | 2352 | 92 | 3.911565% |
| D | 2352 | 203 | 8.630952% |
Noise dominated data is calculated using 1-second bins in cleaned event files. If a bin has >2000 counts, and if more than 50% of those come from <1% of pixels, then it is considered to be noise-dominated and hence unusable.
| Quadrant | # 1 sec bins | Bins with >0 counts | Bins with >2000 counts | High rate bins dominated by noise | Noise dominated (total time) | Noise dominated (detector-on time) | Marked lightcurve |
|---|---|---|---|---|---|---|---|
| A | 3353 | 2354 | 0 | 0 | 0.00% | 0.00% |  |
| B | 3353 | 2354 | 10 | 10 | 0.30% | 0.42% | 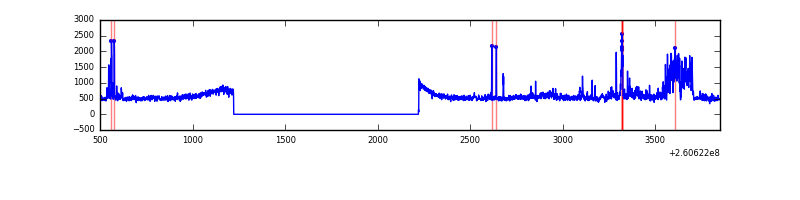 |
| C | 3353 | 2354 | 1 | 1 | 0.03% | 0.04% | 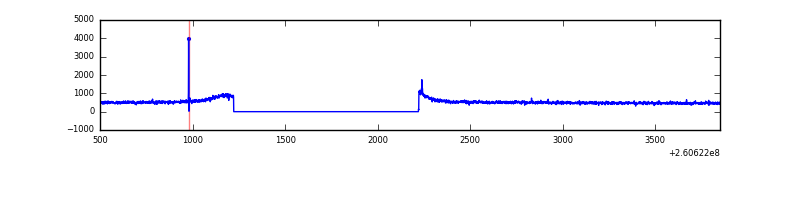 |
| D | 3353 | 2354 | 95 | 95 | 2.83% | 4.04% | 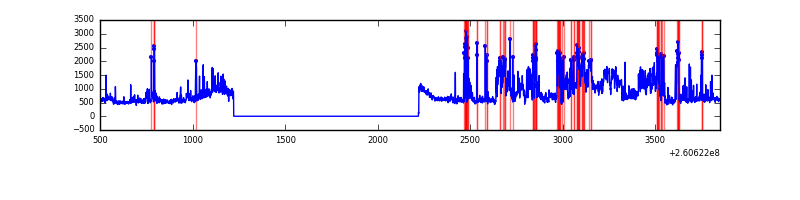 |
Top three noisy pixels from each quadrant. If the there are fewer than three noisy pixels in the level2.evt file, extra rows are filled as -1
| Pixel properties | Quadrant properties | ||||||
|---|---|---|---|---|---|---|---|
| Quadrant | DetID | PixID | Counts | Sigma | Mean | Median | Sigma |
| A | 1 | 162 | 11523 | 171.19 | 314 | 306 | 65.5 |
| A | 1 | 178 | 3963 | 55.81 | 314 | 306 | 65.5 |
| A | 1 | 161 | 3607 | 50.38 | 314 | 306 | 65.5 |
| B | 0 | 219 | 206007 | 3316.02 | 310 | 301 | 62.0 |
| B | 3 | 64 | 19360 | 307.23 | 310 | 301 | 62.0 |
| B | 0 | 214 | 14223 | 224.43 | 310 | 301 | 62.0 |
| C | 3 | 233 | 49779 | 690.07 | 306 | 308 | 71.7 |
| C | 14 | 234 | 6347 | 84.24 | 306 | 308 | 71.7 |
| C | 12 | 4 | 3742 | 47.9 | 306 | 308 | 71.7 |
| D | 5 | 222 | 628502 | 8559.9 | 303 | 293 | 73.4 |
| D | 13 | 122 | 198962 | 2707.04 | 303 | 293 | 73.4 |
| D | 8 | 195 | 134889 | 1833.99 | 303 | 293 | 73.4 |
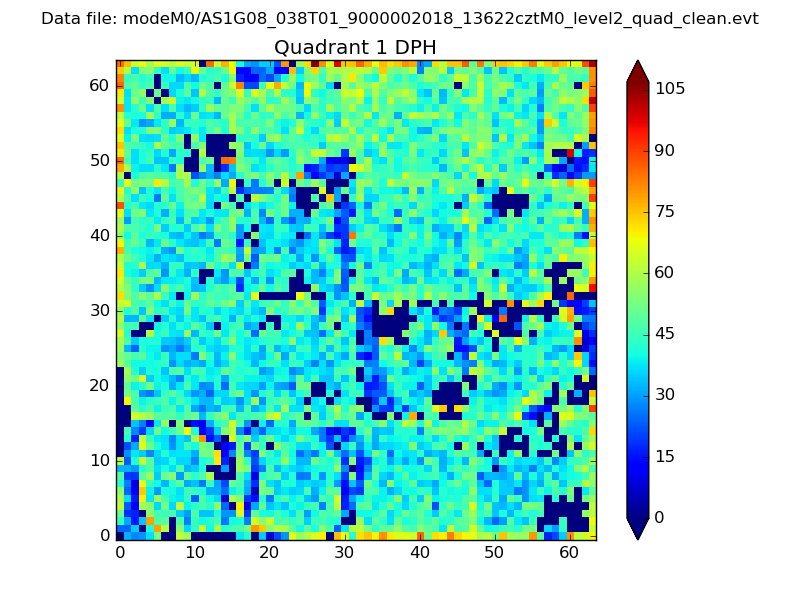
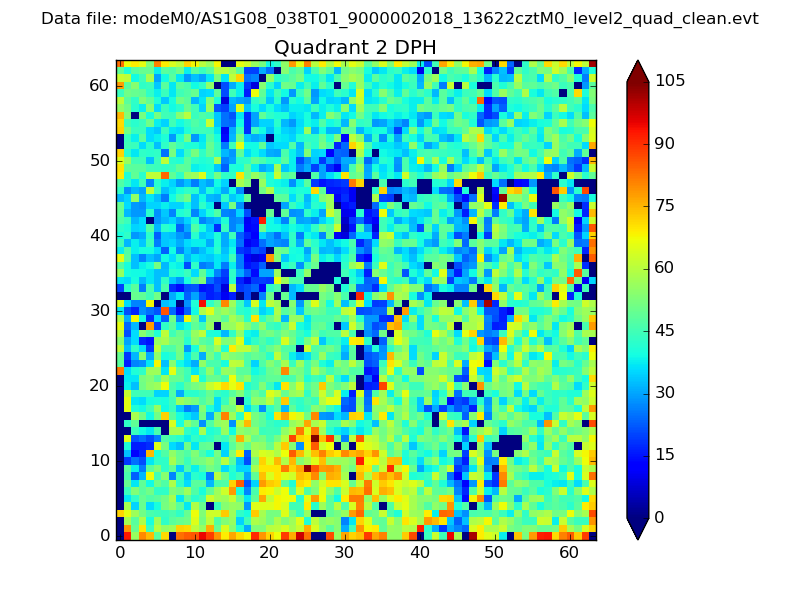
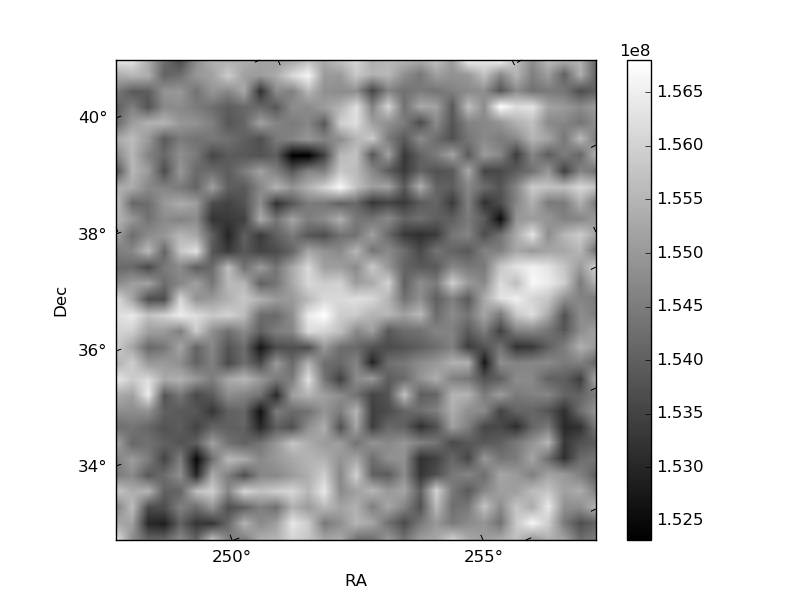
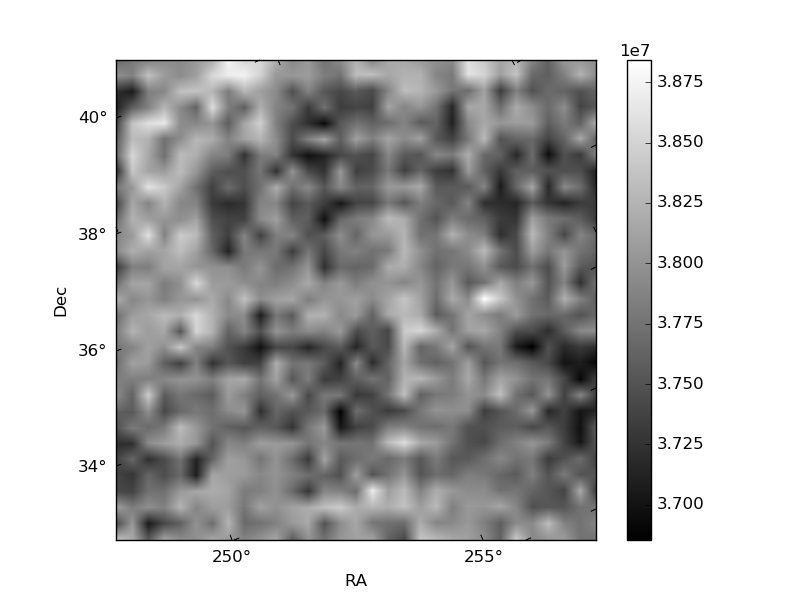
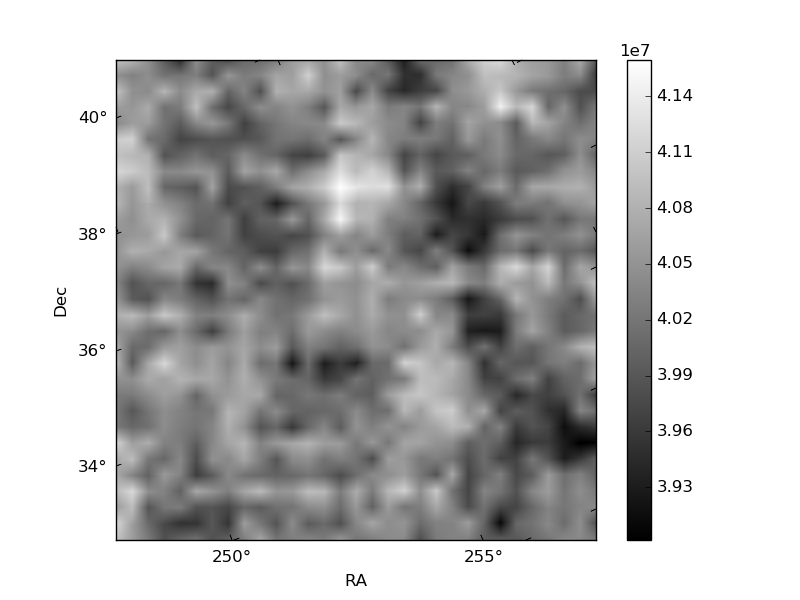
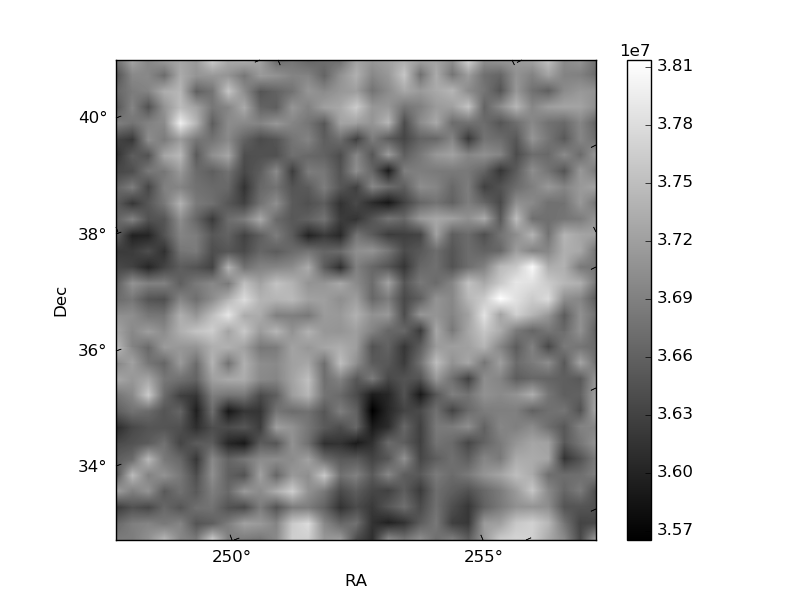
Histogram calculated using DETX and DETY for each event in the final _common_clean file
| Quadrant A | 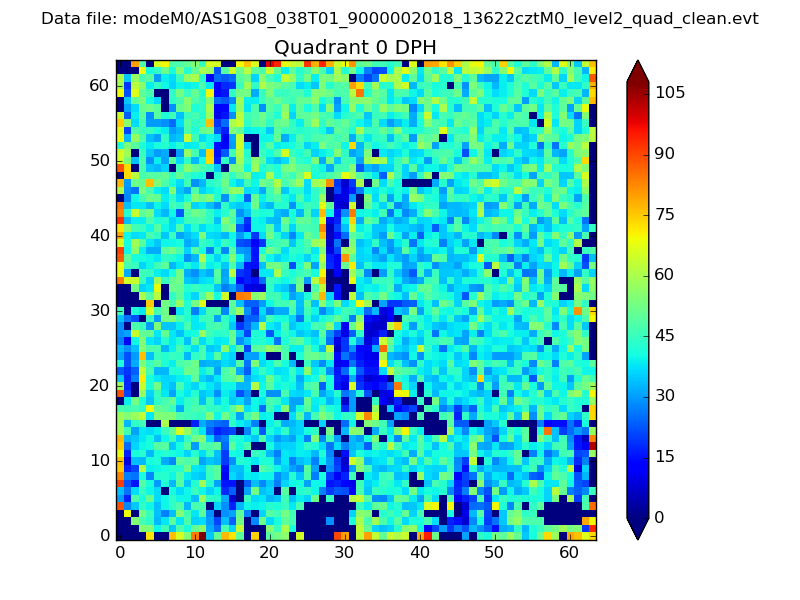 |
 |
Quadrant B |
|---|---|---|---|
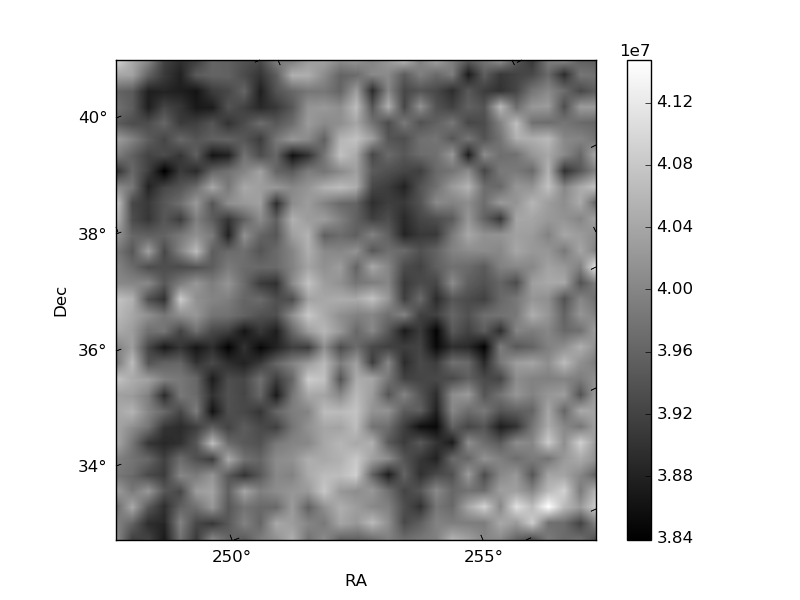
| Quadrant D | 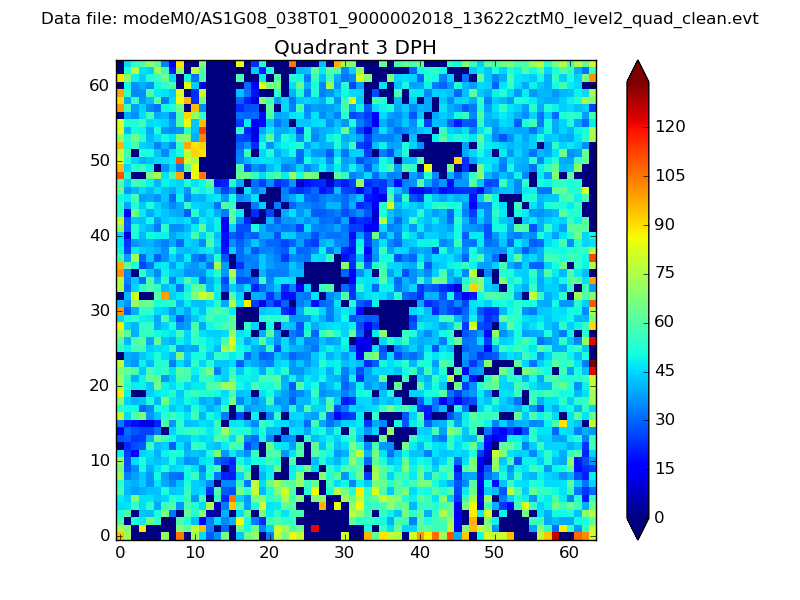 |
 |
Quadrant C |
| Plot type | Count rate plots | Images |
|---|---|---|
| Comparison with Poisson distribution Blue bars denote a histogram of data divided into 1 sec bins. Red curve is a Poisson curve with rate = median count rate of data. |
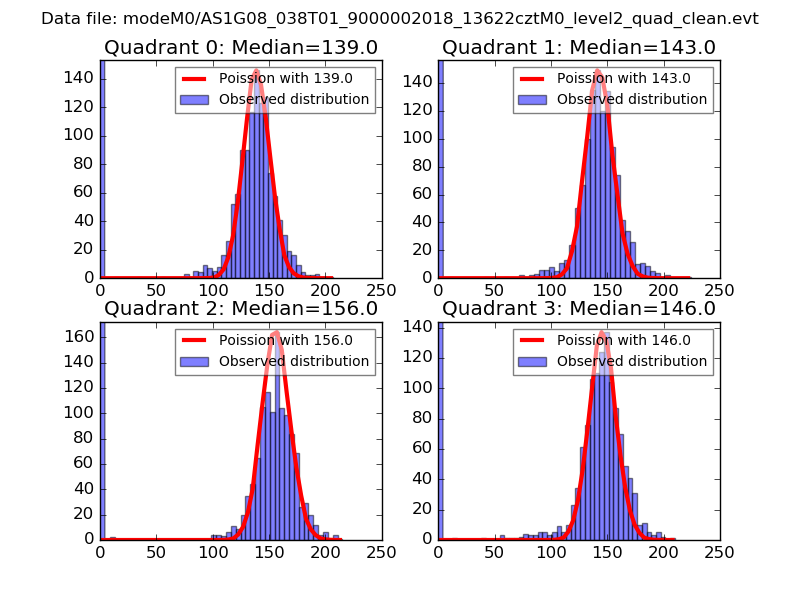 |
 |
| Quadrant-wise count rates Data is divided into 100 sec bins |
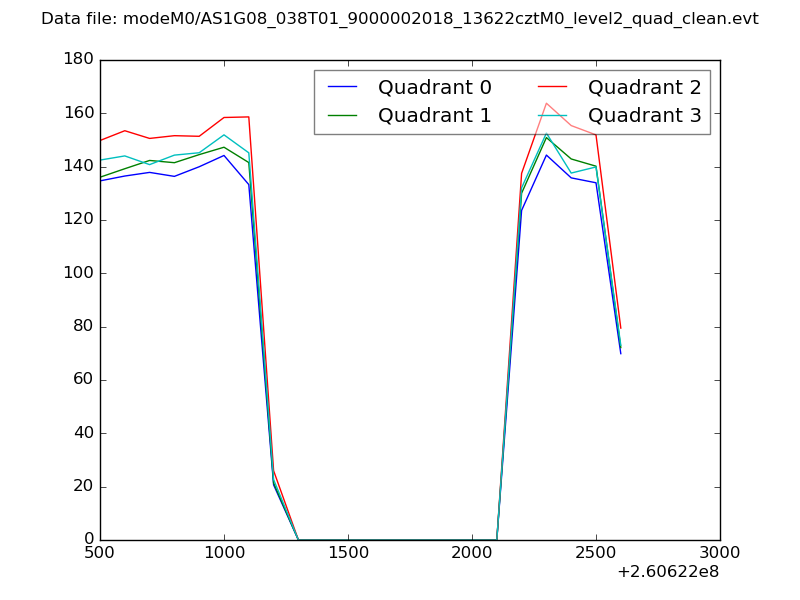 |
|
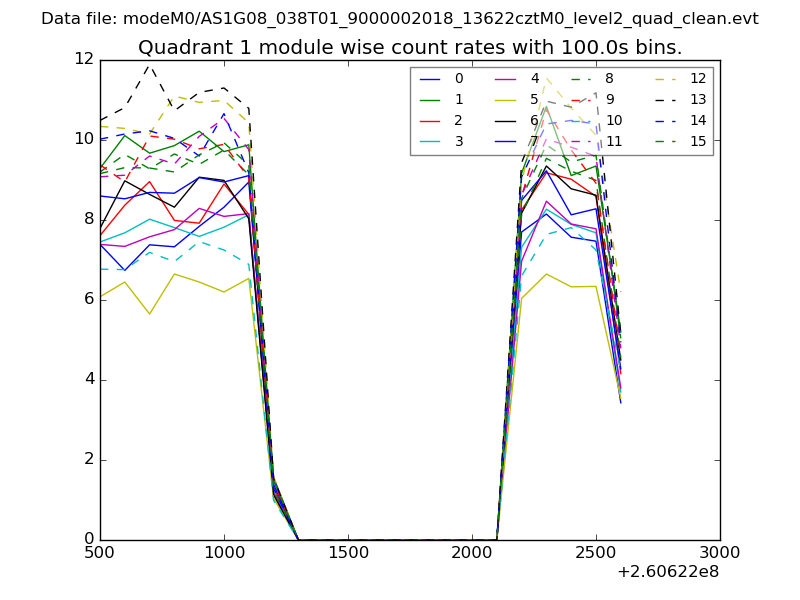
| Module-wise count rates for Quadrant A Data is divided into 100 sec bins |
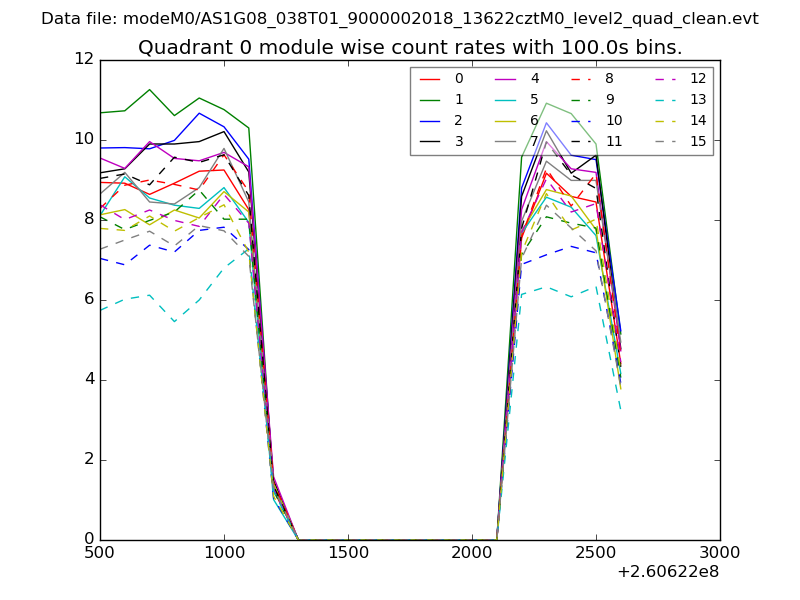 |
 |
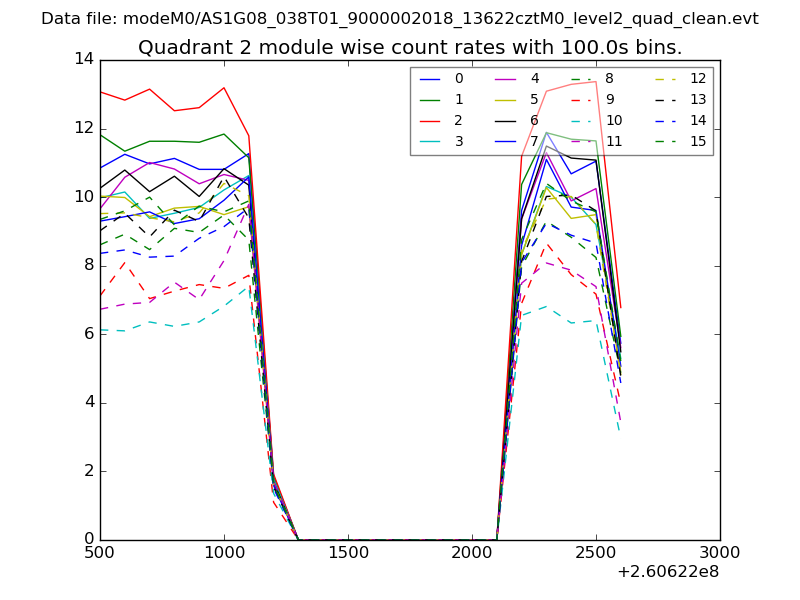
| Module-wise count rates for Quadrant B Data is divided into 100 sec bins |
 |
 |
| Module-wise count rates for Quadrant C Data is divided into 100 sec bins |
 |
 |
| Module-wise count rates for Quadrant D Data is divided into 100 sec bins |
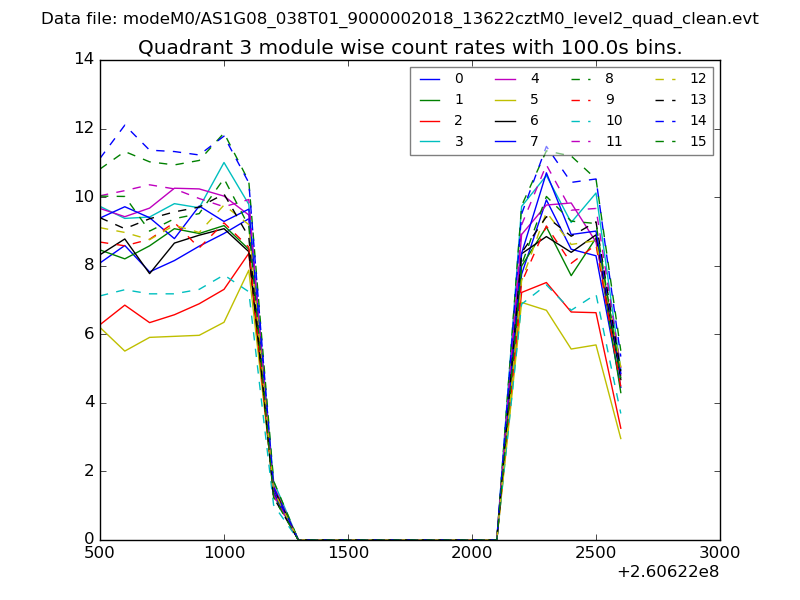 |
 |
| Parameter | Plot |
|---|---|
| CZT HV Monitor | 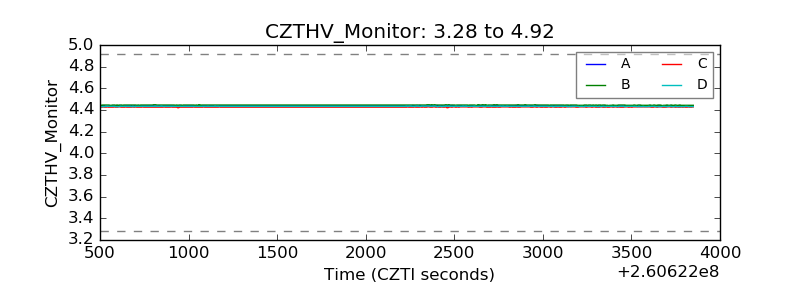 |
| D_VDD | 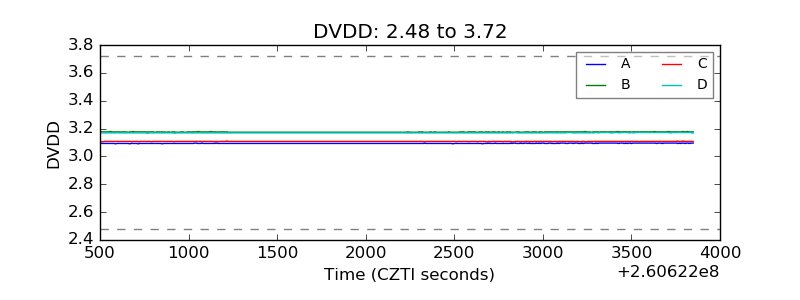 |
| Temperature 1 | 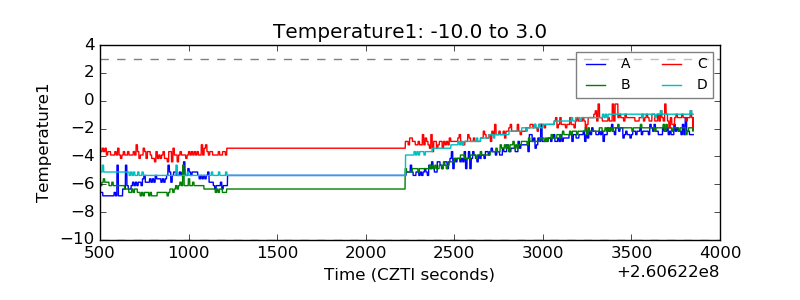 |
| Veto HV Monitor | 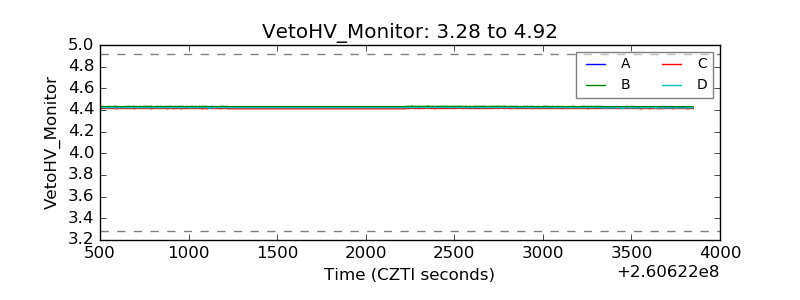 |
| Veto LLD | 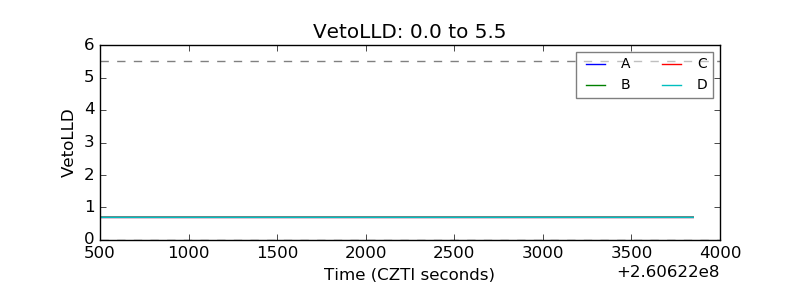 |
| Alpha Counter | 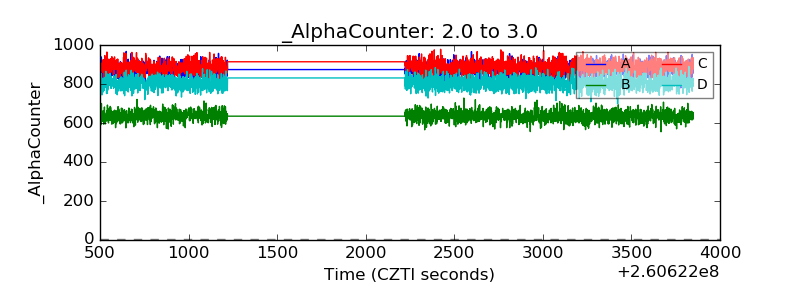 |
| _CPM_Rate | 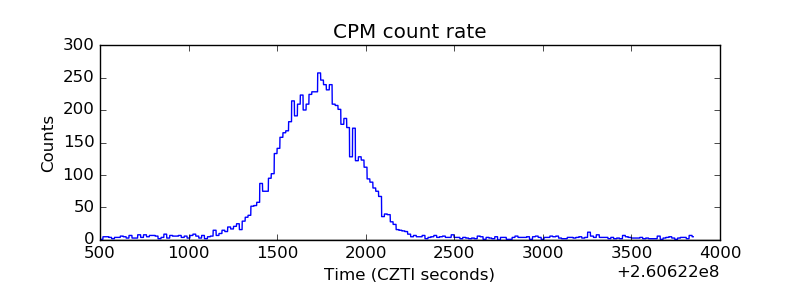 |
| CZT Counter | 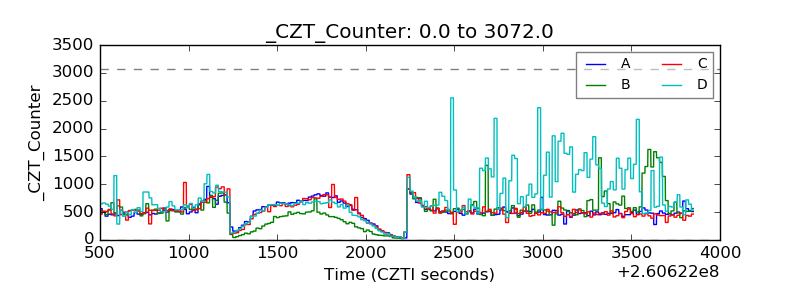 |
| +2.5 Volts monitor |  |
| +5 Volts monitor |  |
| _ROLL_ROT | 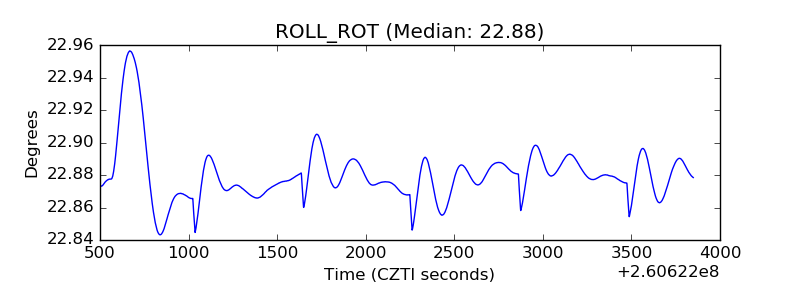 |
| _Roll_DEC | 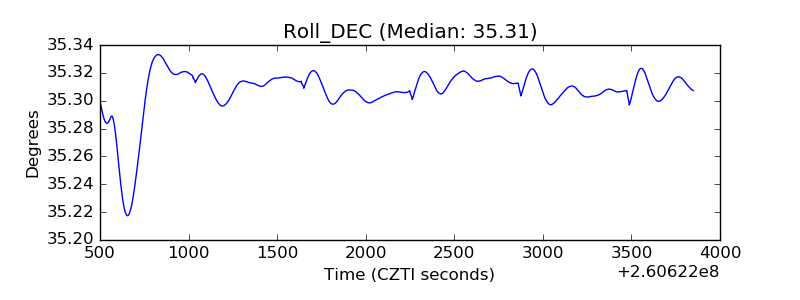 |
| _Roll_RA | 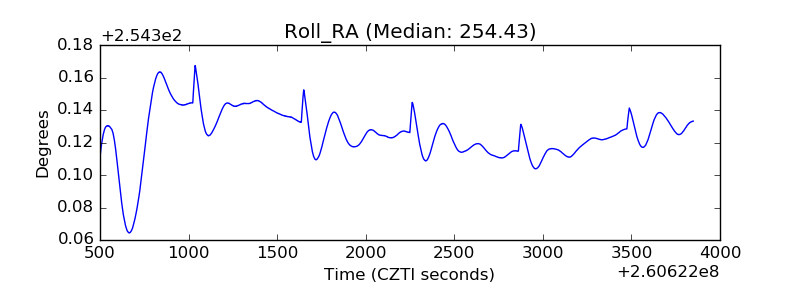 |
| Veto Counter | 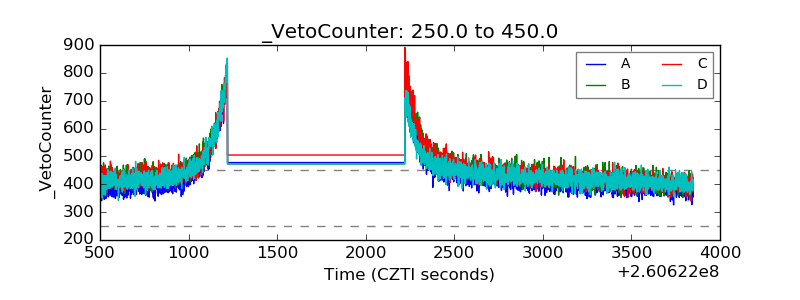 |