| Param | Original file | Final file |
|---|---|---|
| Filename | modeM0/AS1G08_038T01_9000002018_13623cztM0_level2.evt | modeM0/AS1G08_038T01_9000002018_13623cztM0_level2_quad_clean.evt |
| Size (bytes) | 579,882,240 | 80,308,800 |
| Size | 553.0 MB | 76.6 MB |
| Events in quadrant A | 3,454,700 | 462,798 |
| Events in quadrant B | 4,148,432 | 474,816 |
| Events in quadrant C | 3,565,858 | 514,382 |
| Events in quadrant D | 5,906,055 | 479,735 |
| Mode M0 | |||
|---|---|---|---|
| Quadrant | BADHDUFLAG | Total packets | Discarded packets |
| A | 0 | 14870 | 3 |
| B | 0 | 16835 | 2 |
| C | 0 | 14931 | 2 |
| D | 0 | 22344 | 2 |
| Mode SS | |||
|---|---|---|---|
| Quadrant | BADHDUFLAG | Total packets | Discarded packets |
| A | 0 | 144 | 0 |
| B | 0 | 144 | 0 |
| C | 0 | 144 | 0 |
| D | 0 | 144 | 0 |
| Mode M9 | |||
|---|---|---|---|
| Quadrant | BADHDUFLAG | Total packets | Discarded packets |
| A | 0 | 7 | 0 |
| B | 0 | 7 | 0 |
| C | 0 | 7 | 0 |
| D | 0 | 8 | 0 |
| Quadrant | Total seconds | Saturated seconds | Saturation percentage |
|---|---|---|---|
| A | 7188 | 124 | 1.725097% |
| B | 7188 | 184 | 2.559822% |
| C | 7188 | 95 | 1.321647% |
| D | 7188 | 355 | 4.938787% |
Noise dominated data is calculated using 1-second bins in cleaned event files. If a bin has >2000 counts, and if more than 50% of those come from <1% of pixels, then it is considered to be noise-dominated and hence unusable.
| Quadrant | # 1 sec bins | Bins with >0 counts | Bins with >2000 counts | High rate bins dominated by noise | Noise dominated (total time) | Noise dominated (detector-on time) | Marked lightcurve |
|---|---|---|---|---|---|---|---|
| A | 7834 | 7190 | 0 | 0 | 0.00% | 0.00% | 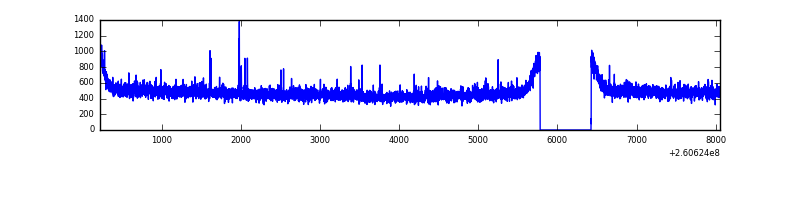 |
| B | 7834 | 7190 | 16 | 16 | 0.20% | 0.22% | 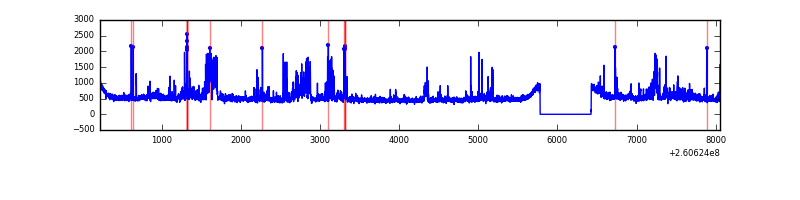 |
| C | 7834 | 7190 | 1 | 1 | 0.01% | 0.01% | 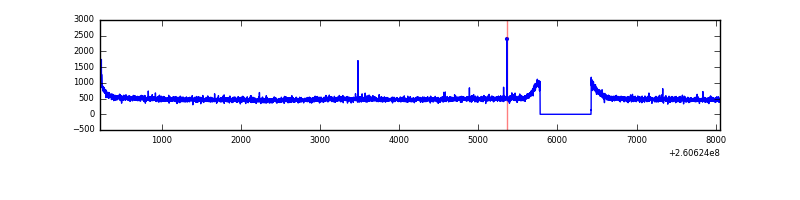 |
| D | 7834 | 7190 | 242 | 242 | 3.09% | 3.37% | 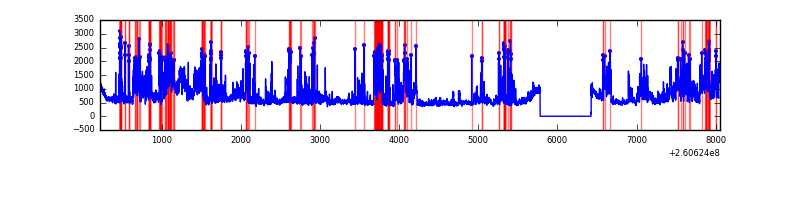 |
Top three noisy pixels from each quadrant. If the there are fewer than three noisy pixels in the level2.evt file, extra rows are filled as -1
| Pixel properties | Quadrant properties | ||||||
|---|---|---|---|---|---|---|---|
| Quadrant | DetID | PixID | Counts | Sigma | Mean | Median | Sigma |
| A | 1 | 162 | 19544 | 103.52 | 887 | 867 | 180.4 |
| A | 15 | 69 | 12543 | 64.71 | 887 | 867 | 180.4 |
| A | 0 | 226 | 8023 | 39.66 | 887 | 867 | 180.4 |
| B | 0 | 219 | 510967 | 3027.88 | 881 | 858 | 168.5 |
| B | 3 | 64 | 74517 | 437.22 | 881 | 858 | 168.5 |
| B | 0 | 214 | 34195 | 197.88 | 881 | 858 | 168.5 |
| C | 3 | 233 | 168716 | 846.0 | 869 | 876 | 198.4 |
| C | 13 | 61 | 6252 | 27.1 | 869 | 876 | 198.4 |
| C | 14 | 234 | 5587 | 23.75 | 869 | 876 | 198.4 |
| D | 5 | 222 | 1228303 | 5929.66 | 861 | 837 | 207.0 |
| D | 13 | 122 | 768685 | 3709.33 | 861 | 837 | 207.0 |
| D | 8 | 195 | 437508 | 2109.48 | 861 | 837 | 207.0 |
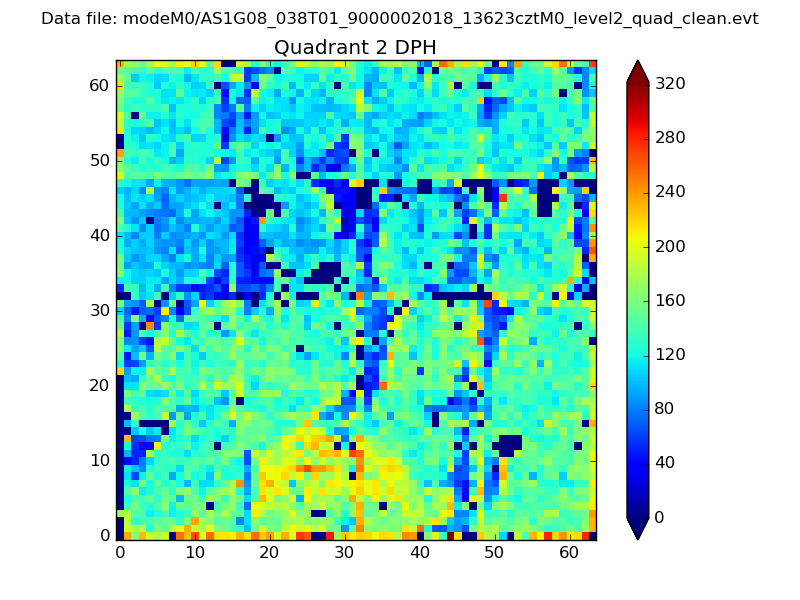
Histogram calculated using DETX and DETY for each event in the final _common_clean file
| Quadrant A | 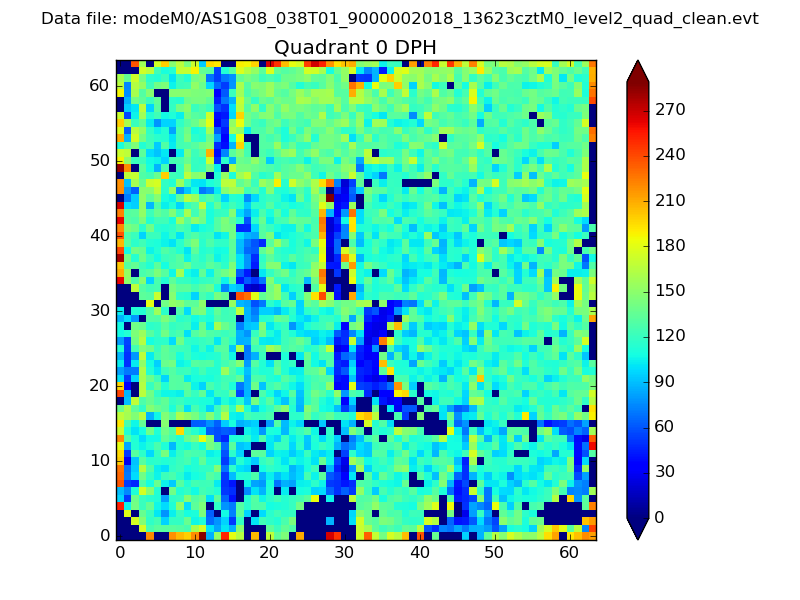 |
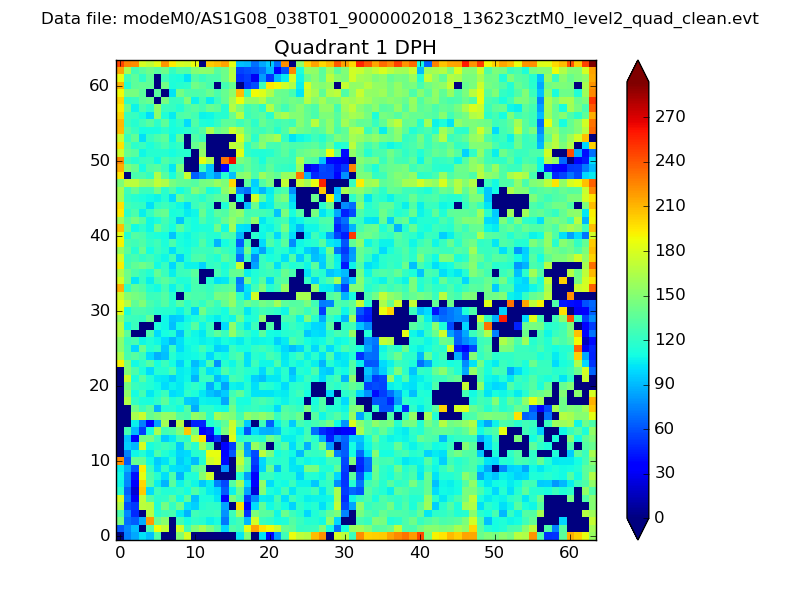 |
Quadrant B |
|---|---|---|---|
| Quadrant D | 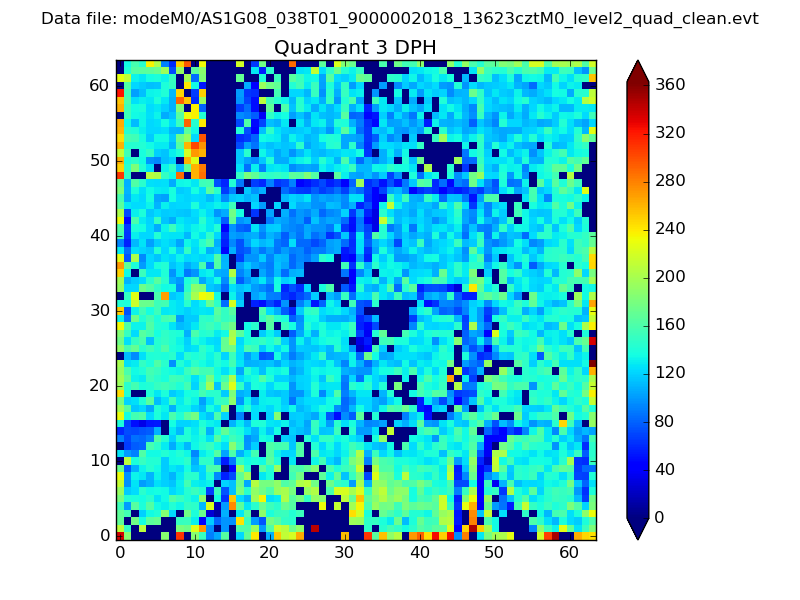 |
 |
Quadrant C |
| Plot type | Count rate plots | Images |
|---|---|---|
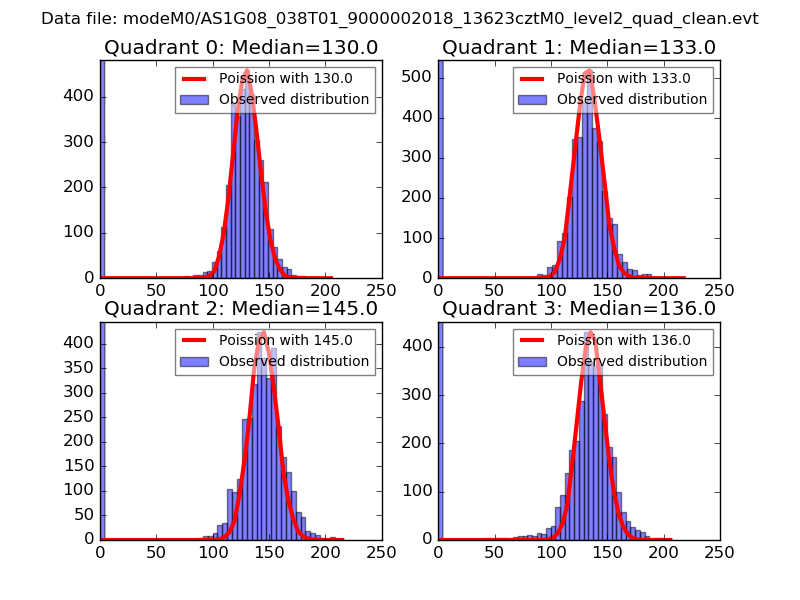
| Comparison with Poisson distribution Blue bars denote a histogram of data divided into 1 sec bins. Red curve is a Poisson curve with rate = median count rate of data. |
 |
 |
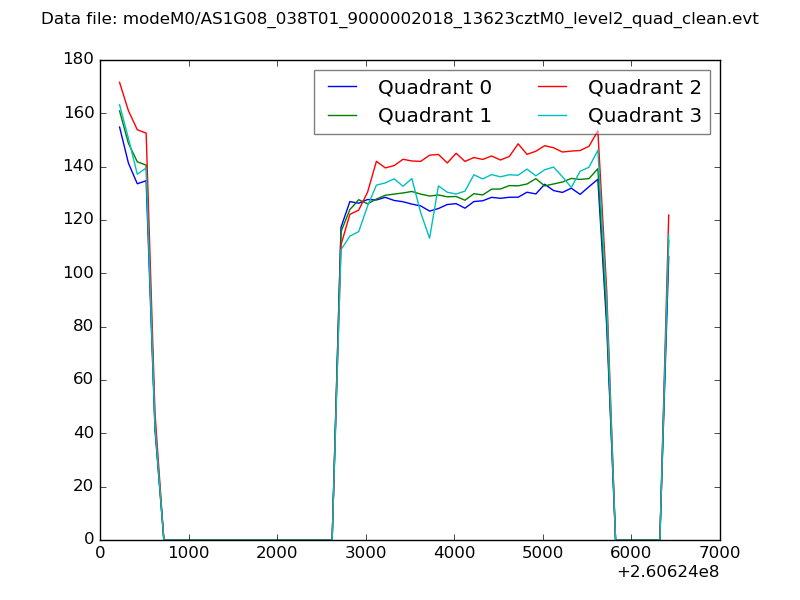
| Quadrant-wise count rates Data is divided into 100 sec bins |
 |
|
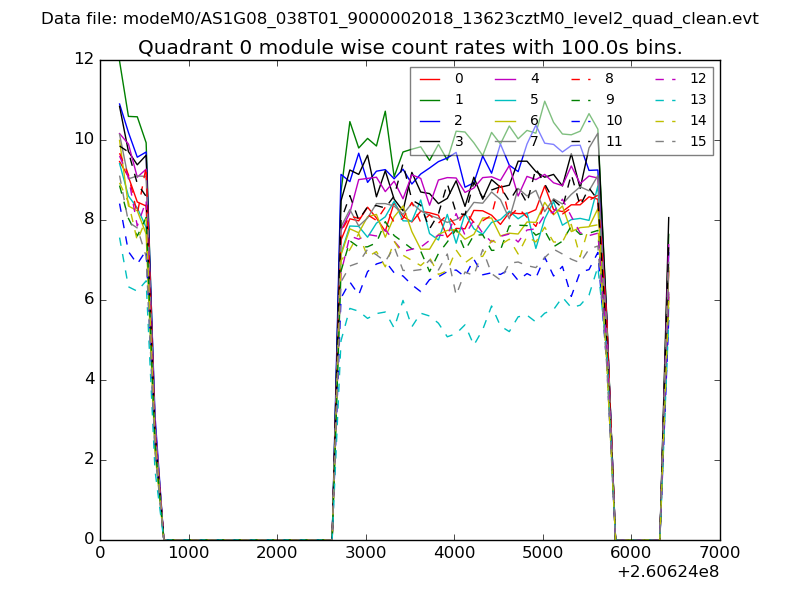
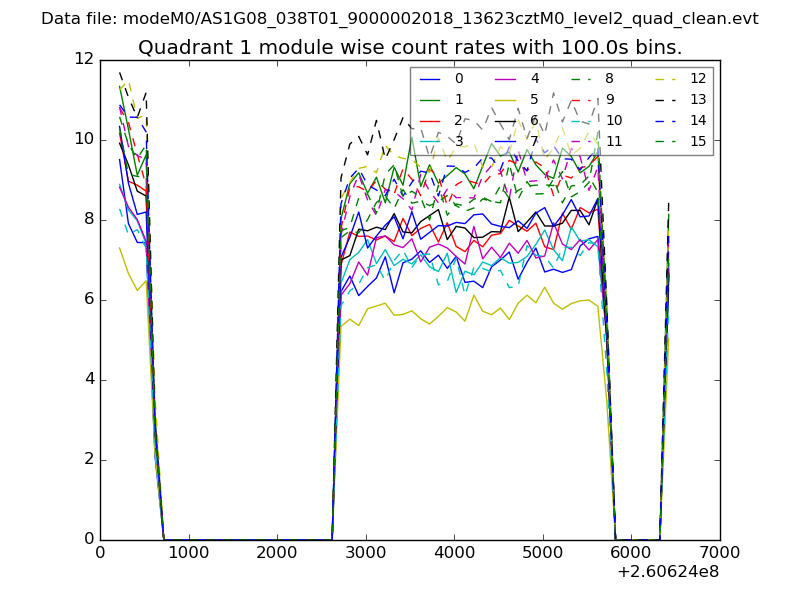
| Module-wise count rates for Quadrant A Data is divided into 100 sec bins |
 |
 |
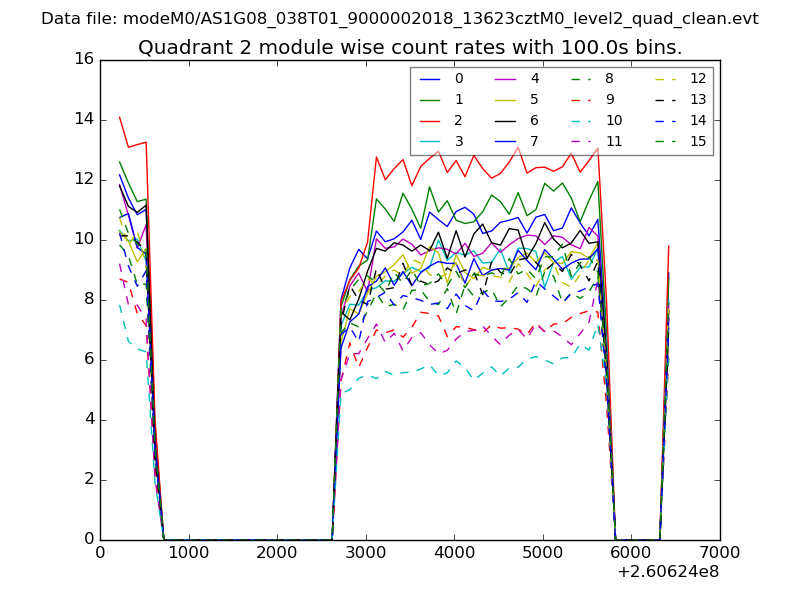
| Module-wise count rates for Quadrant B Data is divided into 100 sec bins |
 |
 |
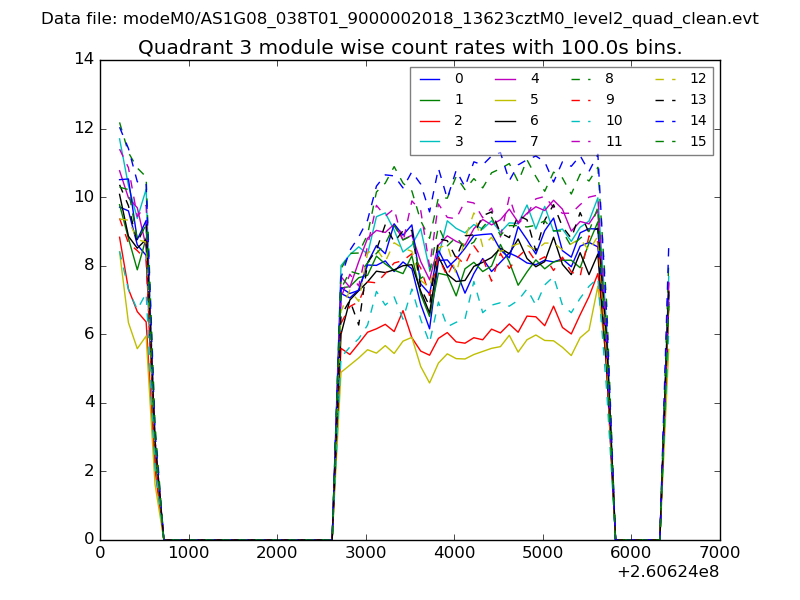
| Module-wise count rates for Quadrant C Data is divided into 100 sec bins |
 |
 |
| Module-wise count rates for Quadrant D Data is divided into 100 sec bins |
 |
 |
| Parameter | Plot |
|---|---|
| CZT HV Monitor | 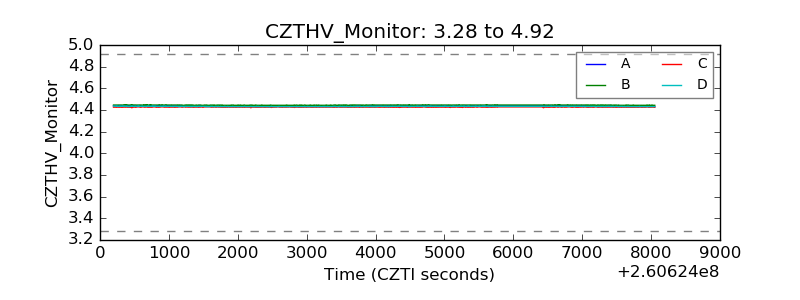 |
| D_VDD | 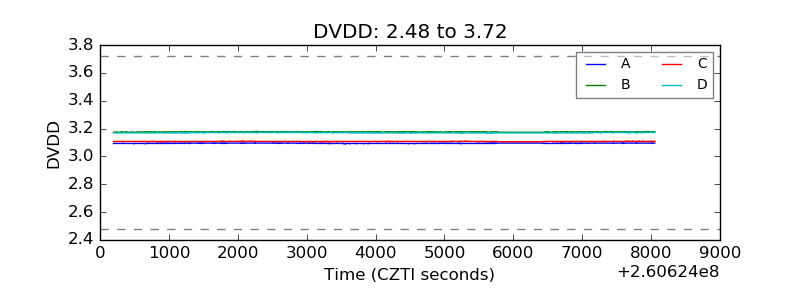 |
| Temperature 1 | 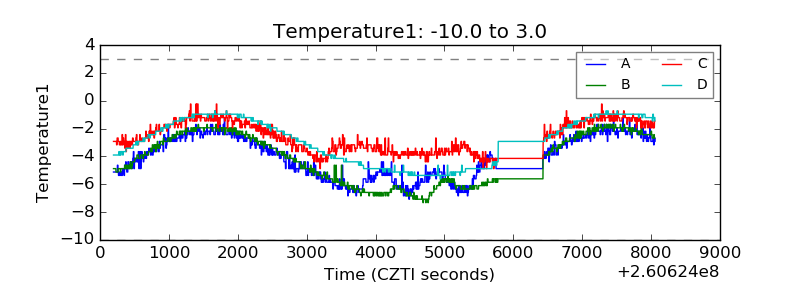 |
| Veto HV Monitor | 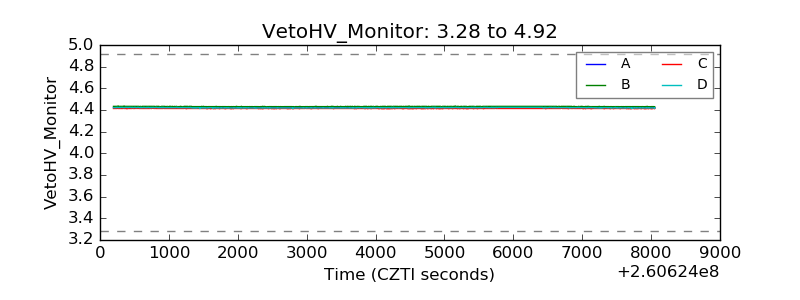 |
| Veto LLD | 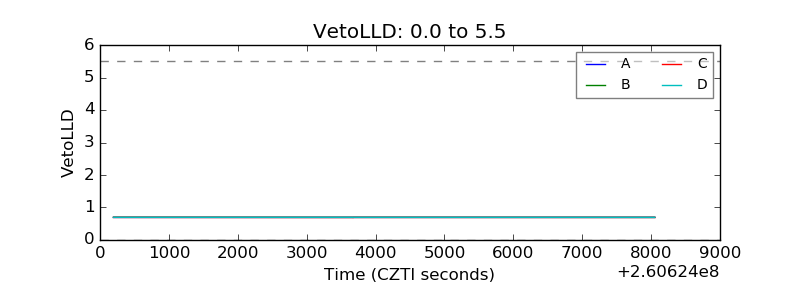 |
| Alpha Counter | 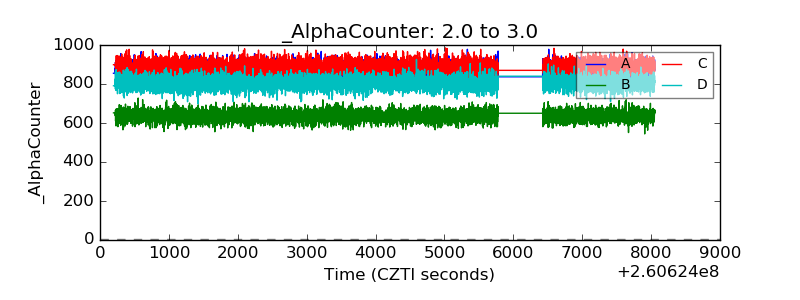 |
| _CPM_Rate | 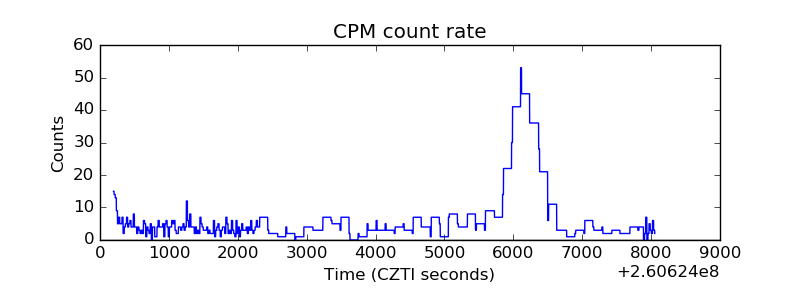 |
| CZT Counter | 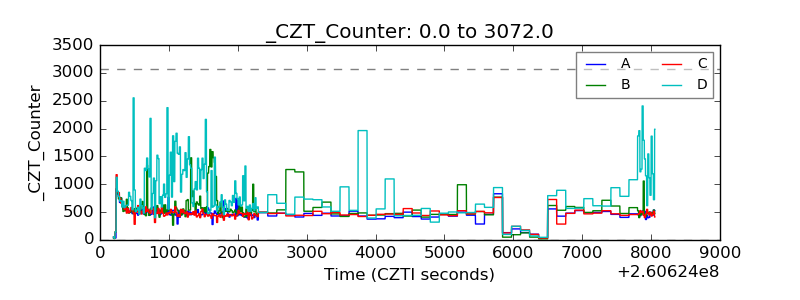 |
| +2.5 Volts monitor |  |
| +5 Volts monitor |  |
| _ROLL_ROT | 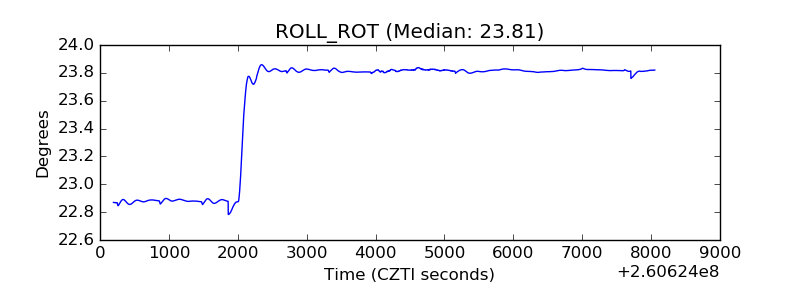 |
| _Roll_DEC | 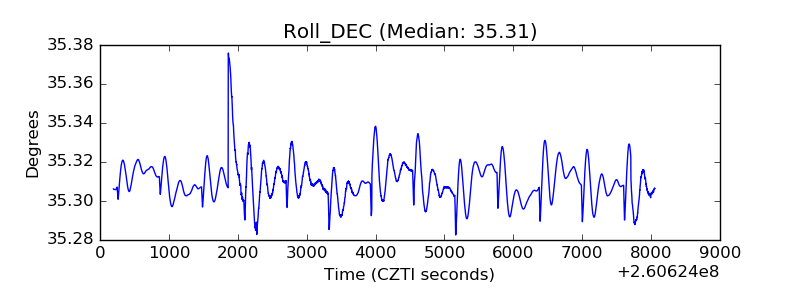 |
| _Roll_RA | 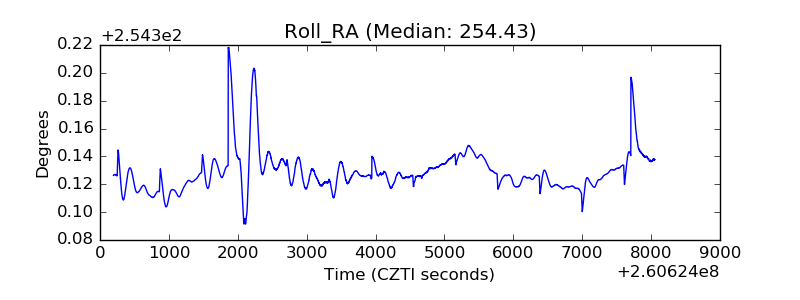 |
| Veto Counter | 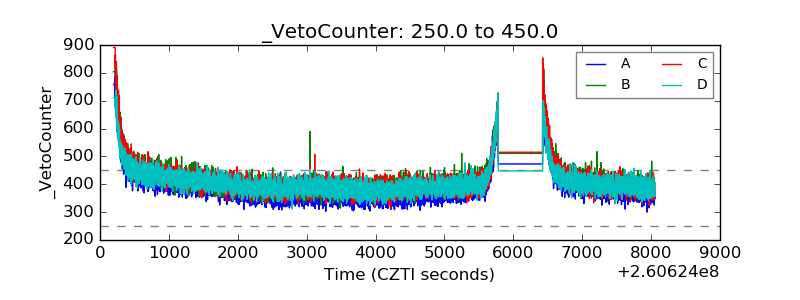 |