| Param | Original file | Final file |
|---|---|---|
| Filename | modeM0/AS1G08_038T01_9000002018_13624cztM0_level2.evt | modeM0/AS1G08_038T01_9000002018_13624cztM0_level2_quad_clean.evt |
| Size (bytes) | 616,901,760 | 83,666,880 |
| Size | 588.3 MB | 79.8 MB |
| Events in quadrant A | 3,616,412 | 480,687 |
| Events in quadrant B | 4,217,115 | 494,485 |
| Events in quadrant C | 3,756,297 | 536,936 |
| Events in quadrant D | 6,584,856 | 499,393 |
| Mode M0 | |||
|---|---|---|---|
| Quadrant | BADHDUFLAG | Total packets | Discarded packets |
| A | 0 | 15685 | 3 |
| B | 0 | 17391 | 2 |
| C | 0 | 15807 | 2 |
| D | 0 | 24654 | 2 |
| Mode SS | |||
|---|---|---|---|
| Quadrant | BADHDUFLAG | Total packets | Discarded packets |
| A | 0 | 154 | 0 |
| B | 0 | 154 | 0 |
| C | 0 | 154 | 0 |
| D | 0 | 154 | 0 |
| Mode M9 | |||
|---|---|---|---|
| Quadrant | BADHDUFLAG | Total packets | Discarded packets |
| A | 0 | 2 | 0 |
| B | 0 | 2 | 0 |
| C | 0 | 2 | 0 |
| D | 0 | 3 | 0 |
| Quadrant | Total seconds | Saturated seconds | Saturation percentage |
|---|---|---|---|
| A | 7501 | 220 | 2.932942% |
| B | 7501 | 279 | 3.719504% |
| C | 7501 | 180 | 2.399680% |
| D | 7501 | 632 | 8.425543% |
Noise dominated data is calculated using 1-second bins in cleaned event files. If a bin has >2000 counts, and if more than 50% of those come from <1% of pixels, then it is considered to be noise-dominated and hence unusable.
| Quadrant | # 1 sec bins | Bins with >0 counts | Bins with >2000 counts | High rate bins dominated by noise | Noise dominated (total time) | Noise dominated (detector-on time) | Marked lightcurve |
|---|---|---|---|---|---|---|---|
| A | 7702 | 7504 | 8 | 8 | 0.10% | 0.11% | 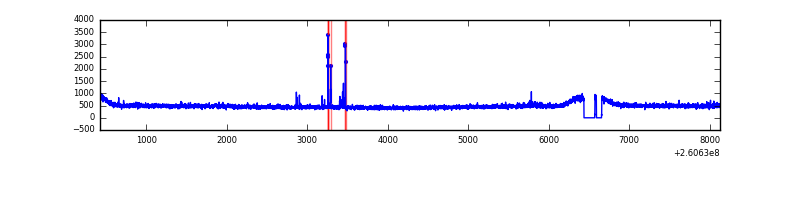 |
| B | 7702 | 7504 | 16 | 16 | 0.21% | 0.21% | 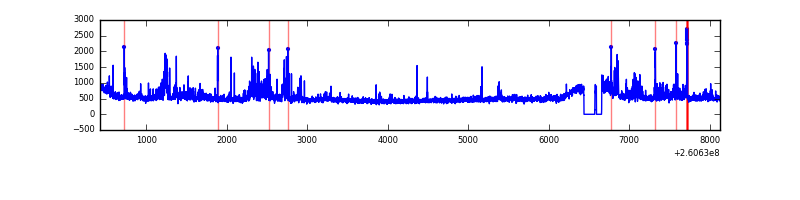 |
| C | 7702 | 7504 | 0 | 0 | 0.00% | 0.00% | 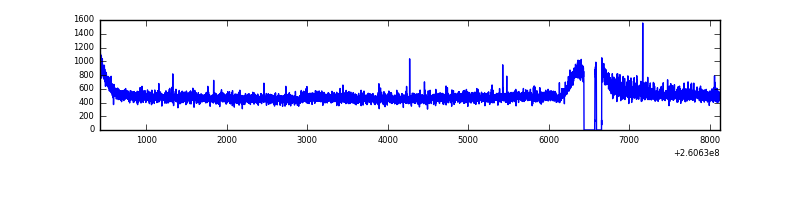 |
| D | 7702 | 7504 | 377 | 377 | 4.89% | 5.02% | 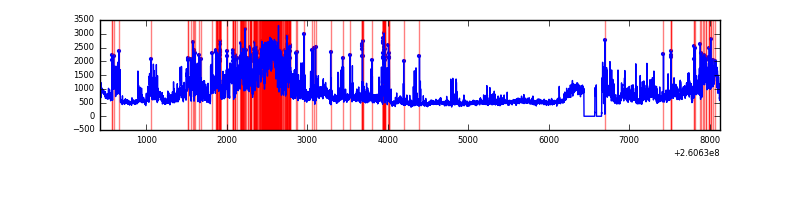 |
Top three noisy pixels from each quadrant. If the there are fewer than three noisy pixels in the level2.evt file, extra rows are filled as -1
| Pixel properties | Quadrant properties | ||||||
|---|---|---|---|---|---|---|---|
| Quadrant | DetID | PixID | Counts | Sigma | Mean | Median | Sigma |
| A | 15 | 69 | 48351 | 251.51 | 921 | 900 | 188.7 |
| A | 1 | 162 | 15003 | 74.75 | 921 | 900 | 188.7 |
| A | 0 | 226 | 8355 | 39.51 | 921 | 900 | 188.7 |
| B | 0 | 219 | 494132 | 2793.9 | 918 | 893 | 176.5 |
| B | 3 | 64 | 48445 | 269.35 | 918 | 893 | 176.5 |
| B | 0 | 214 | 28426 | 155.96 | 918 | 893 | 176.5 |
| C | 3 | 233 | 221322 | 1057.79 | 906 | 912 | 208.4 |
| C | 13 | 61 | 6527 | 26.95 | 906 | 912 | 208.4 |
| C | 8 | 222 | 3620 | 13.0 | 906 | 912 | 208.4 |
| D | 5 | 222 | 1316132 | 6206.41 | 888 | 862 | 211.9 |
| D | 8 | 195 | 690104 | 3252.35 | 888 | 862 | 211.9 |
| D | 13 | 122 | 554576 | 2612.83 | 888 | 862 | 211.9 |
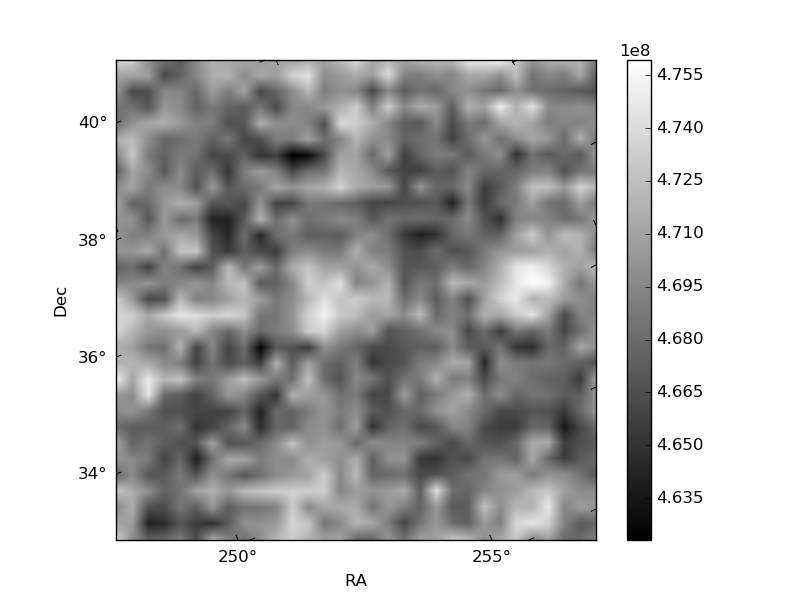
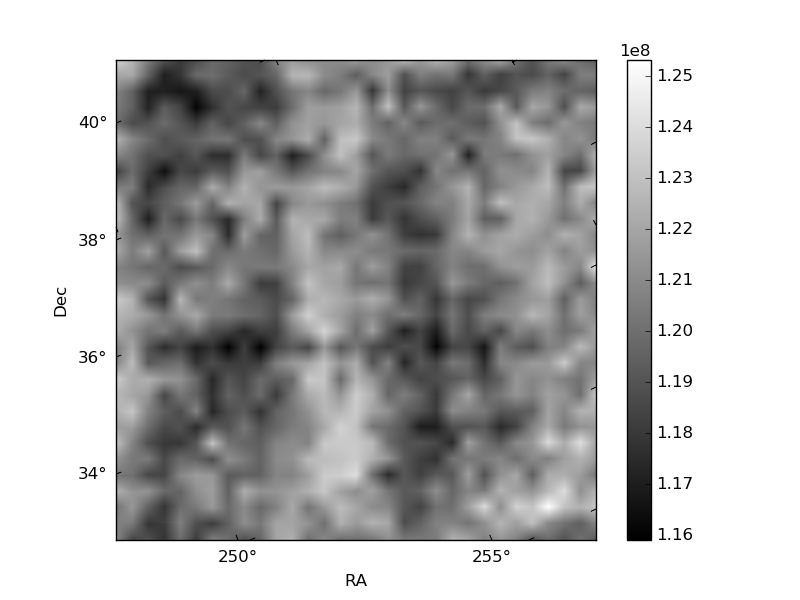
Histogram calculated using DETX and DETY for each event in the final _common_clean file
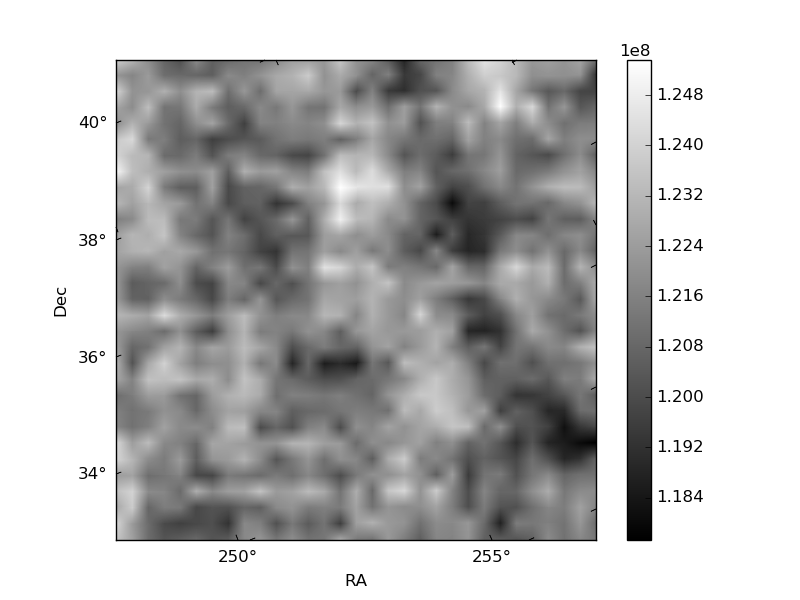
| Quadrant A | 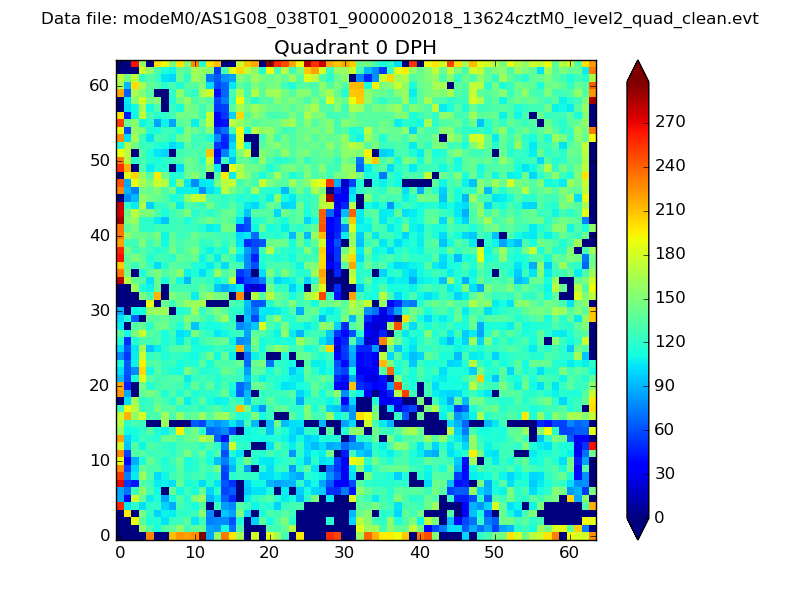 |
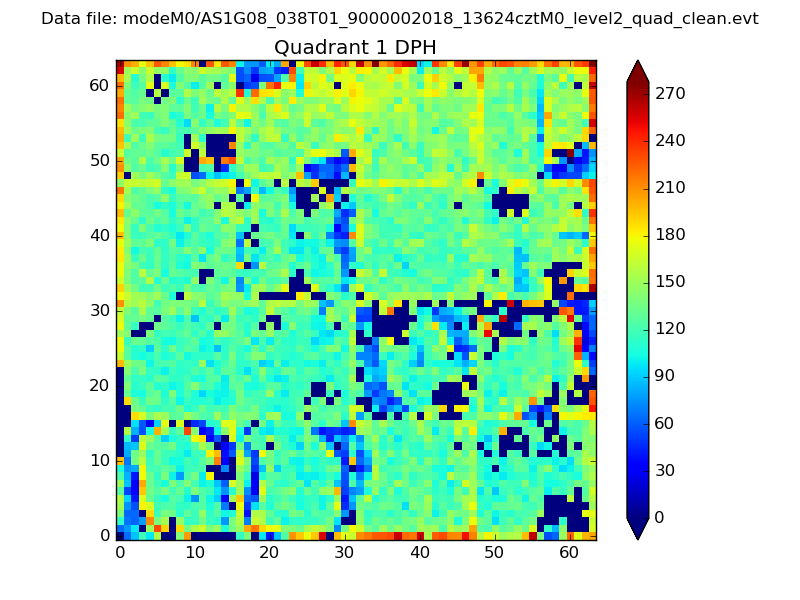 |
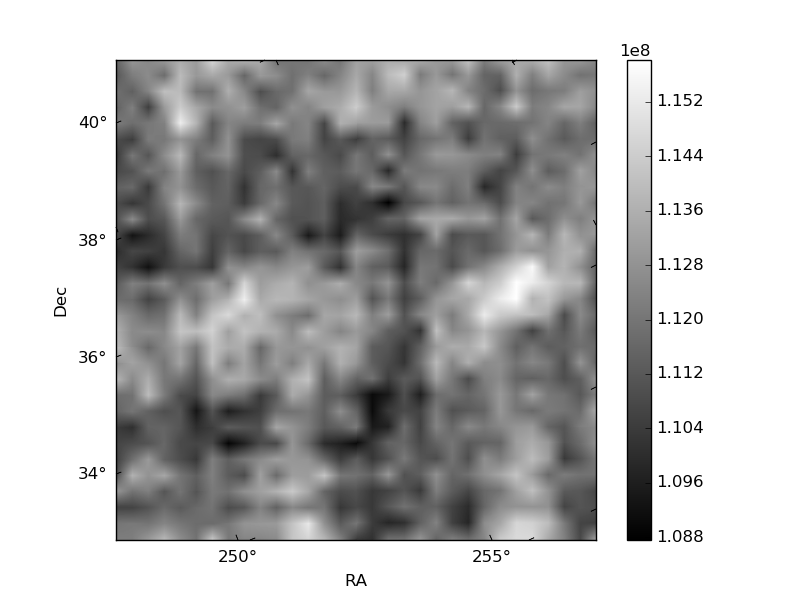
Quadrant B |
|---|---|---|---|
| Quadrant D | 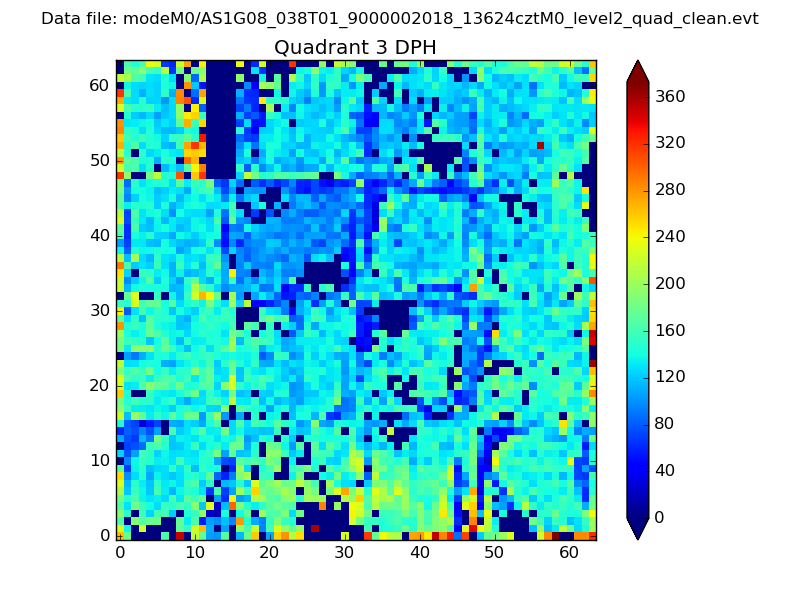 |
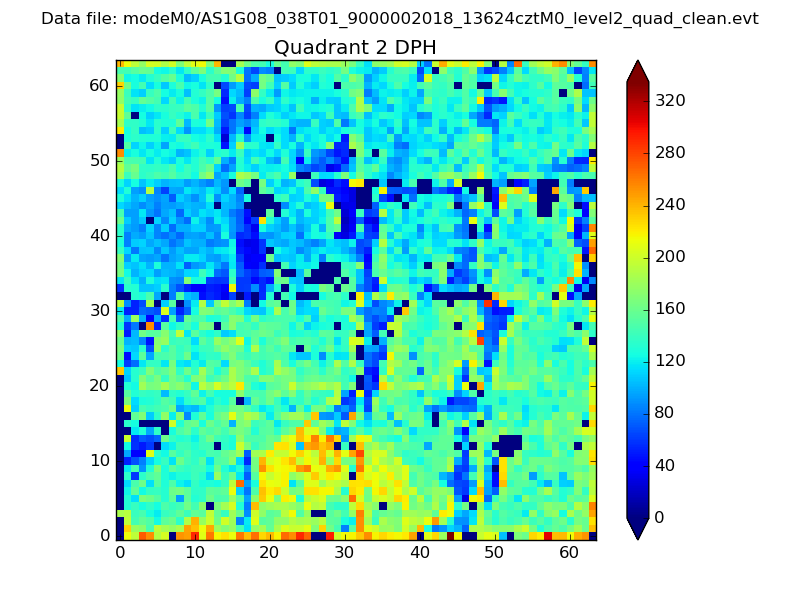 |
Quadrant C |
| Plot type | Count rate plots | Images |
|---|---|---|
| Comparison with Poisson distribution Blue bars denote a histogram of data divided into 1 sec bins. Red curve is a Poisson curve with rate = median count rate of data. |
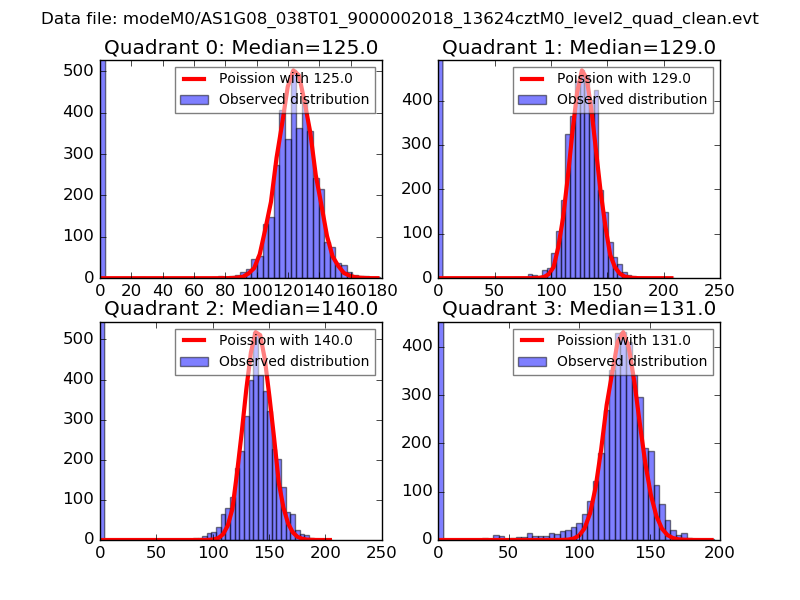 |
 |
| Quadrant-wise count rates Data is divided into 100 sec bins |
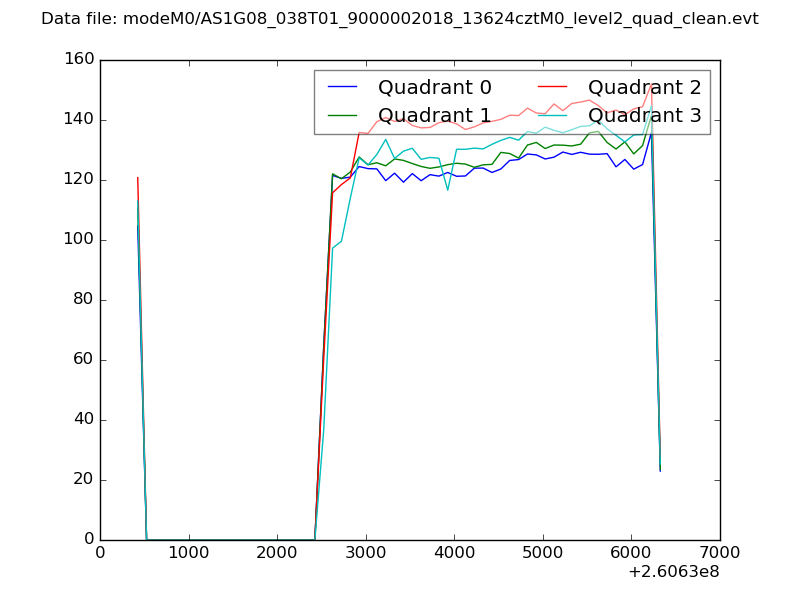 |
|
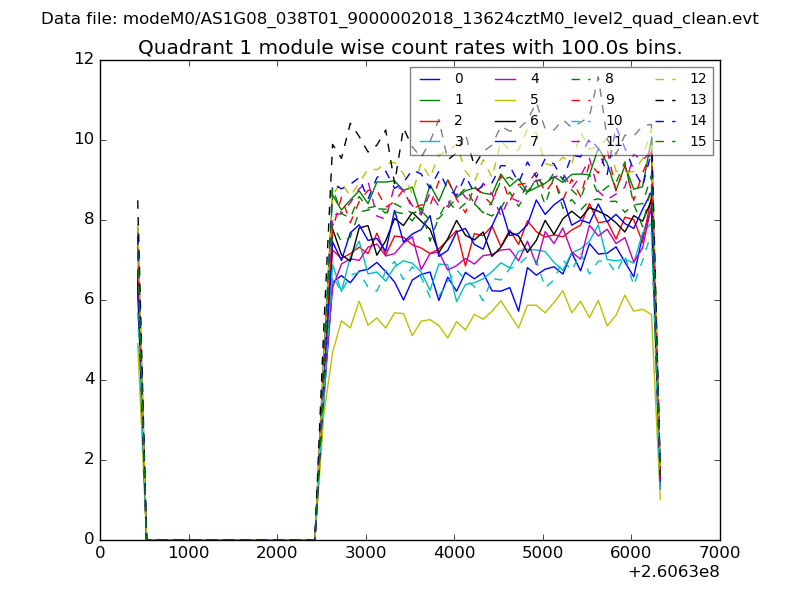
| Module-wise count rates for Quadrant A Data is divided into 100 sec bins |
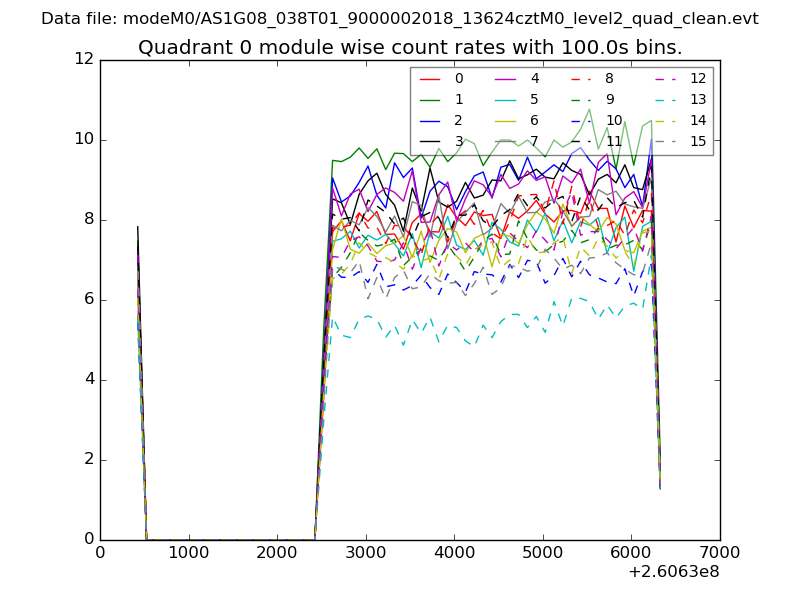 |
 |
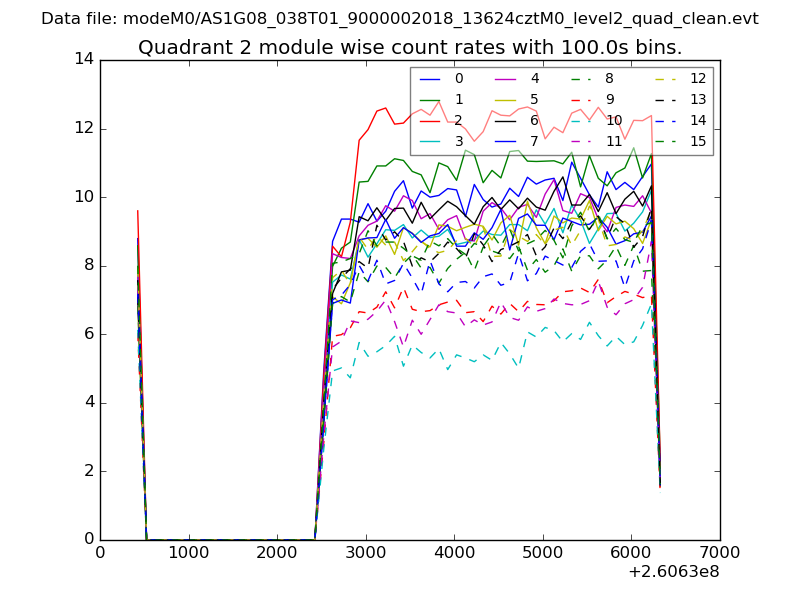
| Module-wise count rates for Quadrant B Data is divided into 100 sec bins |
 |
 |
| Module-wise count rates for Quadrant C Data is divided into 100 sec bins |
 |
 |
| Module-wise count rates for Quadrant D Data is divided into 100 sec bins |
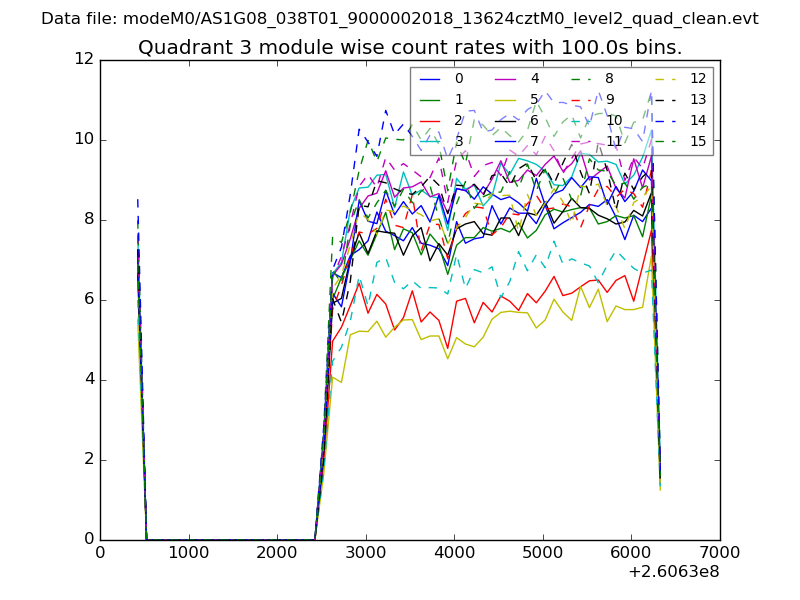 |
 |
| Parameter | Plot |
|---|---|
| CZT HV Monitor | 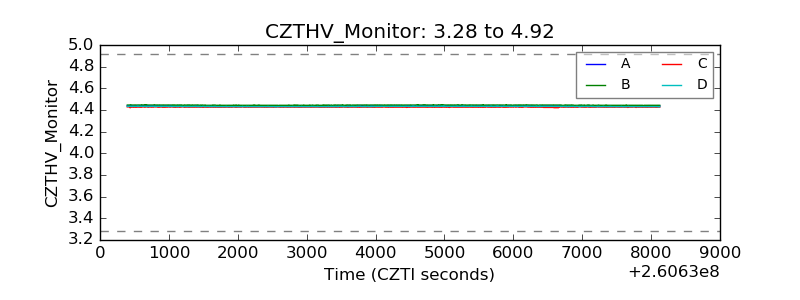 |
| D_VDD |  |
| Temperature 1 | 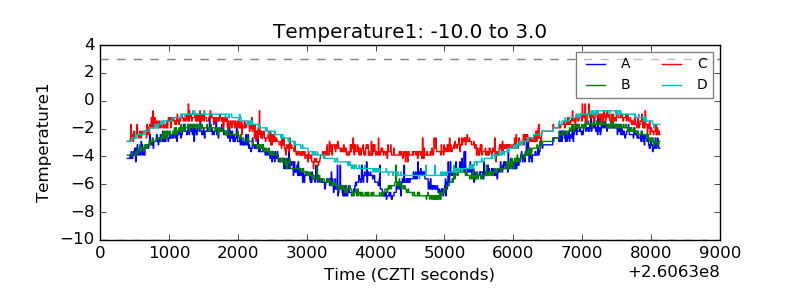 |
| Veto HV Monitor | 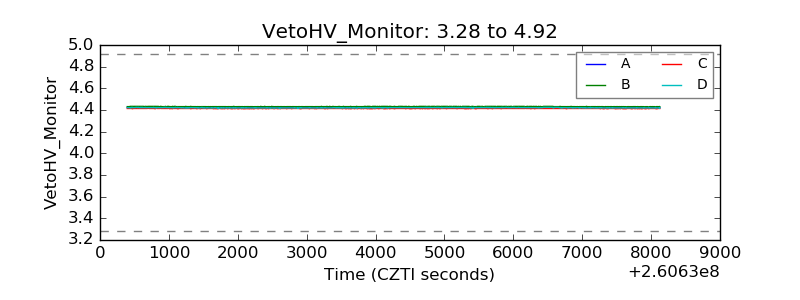 |
| Veto LLD | 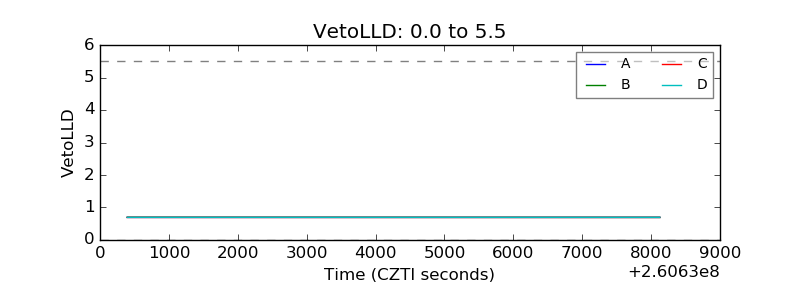 |
| Alpha Counter | 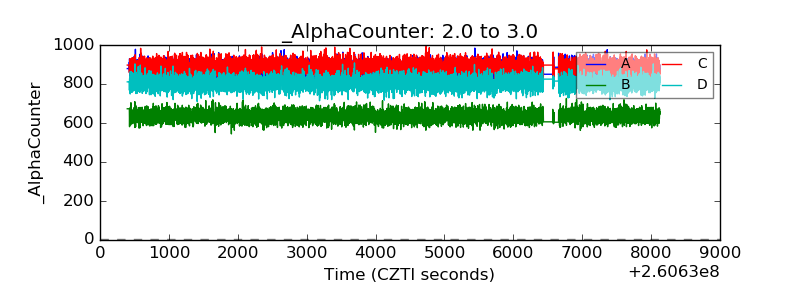 |
| _CPM_Rate | 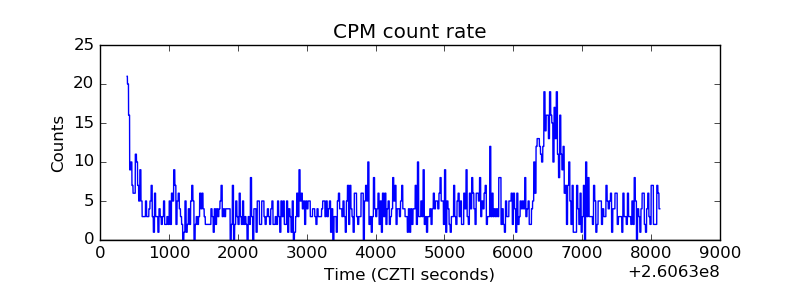 |
| CZT Counter | 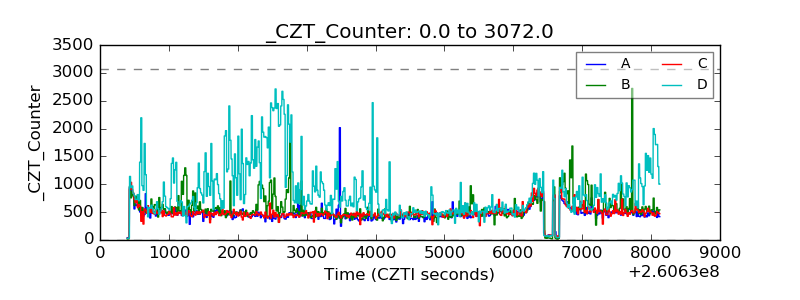 |
| +2.5 Volts monitor |  |
| +5 Volts monitor |  |
| _ROLL_ROT | 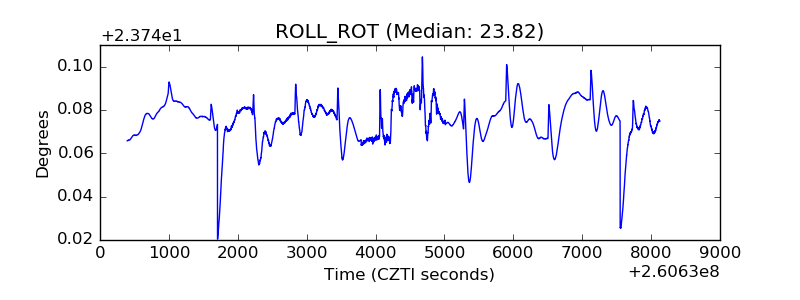 |
| _Roll_DEC | 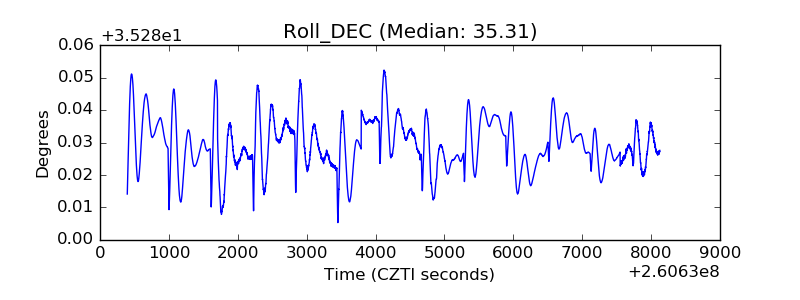 |
| _Roll_RA | 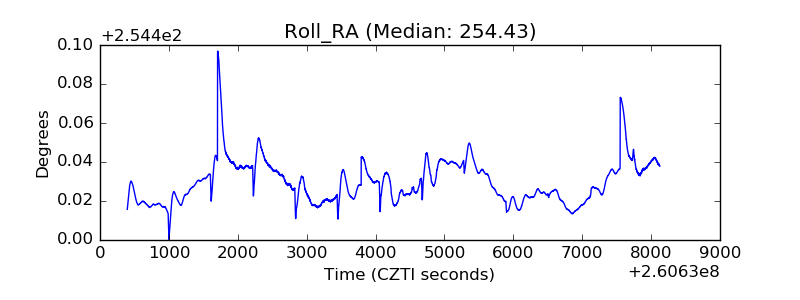 |
| Veto Counter | 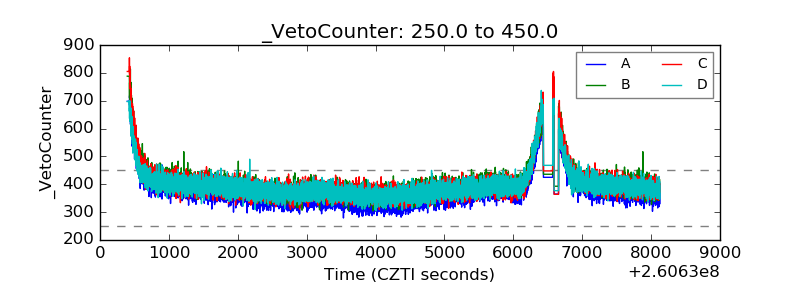 |