| Param | Original file | Final file |
|---|---|---|
| Filename | modeM0/AS1G08_038T01_9000002018_13629cztM0_level2.evt | modeM0/AS1G08_038T01_9000002018_13629cztM0_level2_quad_clean.evt |
| Size (bytes) | 569,934,720 | 102,268,800 |
| Size | 543.5 MB | 97.5 MB |
| Events in quadrant A | 3,440,702 | 611,776 |
| Events in quadrant B | 3,996,972 | 630,150 |
| Events in quadrant C | 3,754,377 | 697,906 |
| Events in quadrant D | 5,564,417 | 639,883 |
| Mode M0 | |||
|---|---|---|---|
| Quadrant | BADHDUFLAG | Total packets | Discarded packets |
| A | 0 | 15307 | 3 |
| B | 0 | 16956 | 2 |
| C | 0 | 15649 | 2 |
| D | 0 | 21677 | 2 |
| Mode SS | |||
|---|---|---|---|
| Quadrant | BADHDUFLAG | Total packets | Discarded packets |
| A | 0 | 154 | 0 |
| B | 0 | 154 | 0 |
| C | 0 | 154 | 0 |
| D | 0 | 154 | 0 |
| Mode M9 | |||
|---|---|---|---|
| Quadrant | BADHDUFLAG | Total packets | Discarded packets |
| A | 0 | 16 | 0 |
| B | 0 | 16 | 0 |
| C | 0 | 16 | 0 |
| D | 0 | 16 | 0 |
| Quadrant | Total seconds | Saturated seconds | Saturation percentage |
|---|---|---|---|
| A | 7433 | 47 | 0.632315% |
| B | 7433 | 177 | 2.381273% |
| C | 7433 | 46 | 0.618862% |
| D | 7433 | 160 | 2.152563% |
Noise dominated data is calculated using 1-second bins in cleaned event files. If a bin has >2000 counts, and if more than 50% of those come from <1% of pixels, then it is considered to be noise-dominated and hence unusable.
| Quadrant | # 1 sec bins | Bins with >0 counts | Bins with >2000 counts | High rate bins dominated by noise | Noise dominated (total time) | Noise dominated (detector-on time) | Marked lightcurve |
|---|---|---|---|---|---|---|---|
| A | 9124 | 7436 | 1 | 1 | 0.01% | 0.01% | 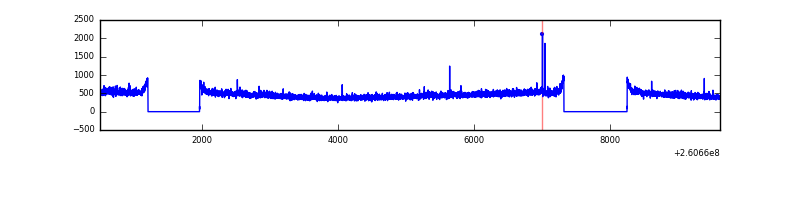 |
| B | 9124 | 7436 | 55 | 55 | 0.60% | 0.74% | 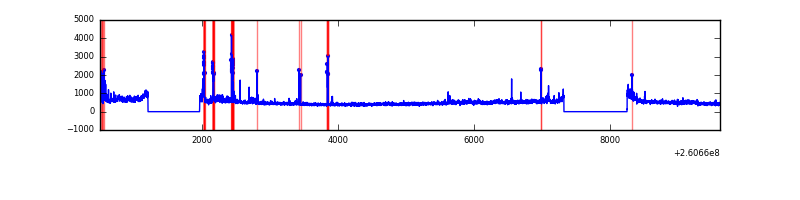 |
| C | 9124 | 7436 | 0 | 0 | 0.00% | 0.00% | 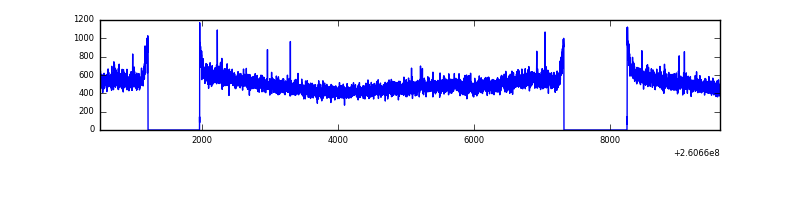 |
| D | 9124 | 7436 | 66 | 66 | 0.72% | 0.89% |  |
Top three noisy pixels from each quadrant. If the there are fewer than three noisy pixels in the level2.evt file, extra rows are filled as -1
| Pixel properties | Quadrant properties | ||||||
|---|---|---|---|---|---|---|---|
| Quadrant | DetID | PixID | Counts | Sigma | Mean | Median | Sigma |
| A | 1 | 162 | 15946 | 83.66 | 885 | 865 | 180.3 |
| A | 15 | 69 | 12410 | 64.05 | 885 | 865 | 180.3 |
| A | 0 | 226 | 7987 | 39.51 | 885 | 865 | 180.3 |
| B | 0 | 219 | 282912 | 1656.52 | 885 | 859 | 170.3 |
| B | 3 | 64 | 138137 | 806.25 | 885 | 859 | 170.3 |
| B | 0 | 214 | 48294 | 278.59 | 885 | 859 | 170.3 |
| C | 3 | 233 | 278600 | 1351.86 | 889 | 897 | 205.4 |
| C | 0 | 207 | 6382 | 26.7 | 889 | 897 | 205.4 |
| C | 13 | 61 | 6284 | 26.22 | 889 | 897 | 205.4 |
| D | 13 | 122 | 1823767 | 8740.03 | 869 | 847 | 208.6 |
| D | 8 | 195 | 151203 | 720.89 | 869 | 847 | 208.6 |
| D | 5 | 222 | 110161 | 524.11 | 869 | 847 | 208.6 |
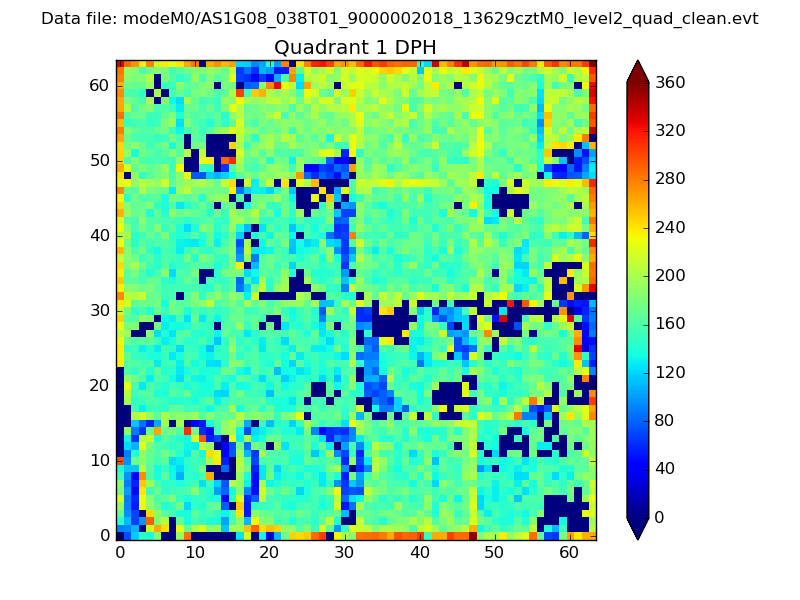
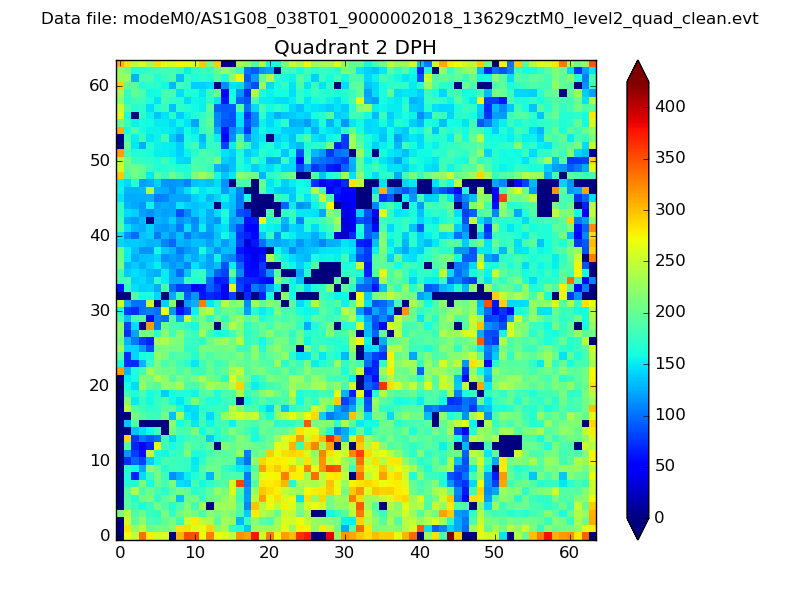
Histogram calculated using DETX and DETY for each event in the final _common_clean file
| Quadrant A | 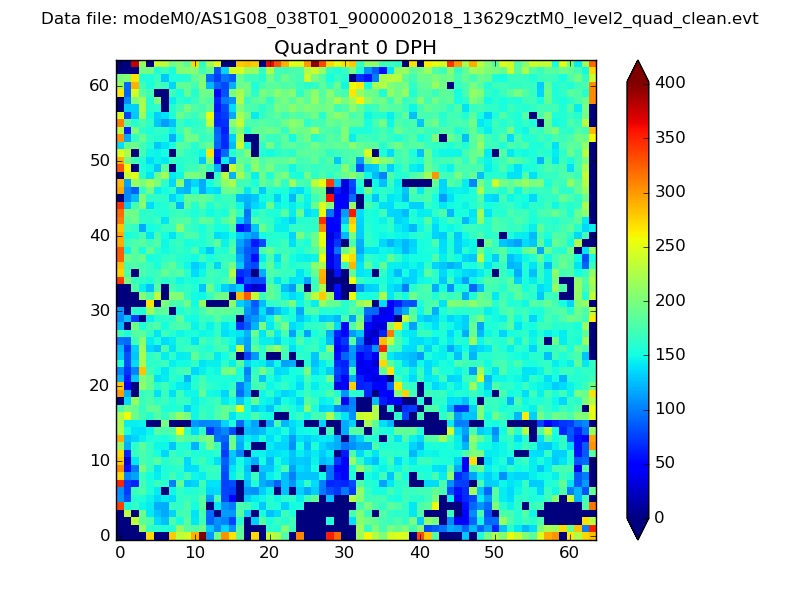 |
 |
Quadrant B |
|---|---|---|---|
| Quadrant D | 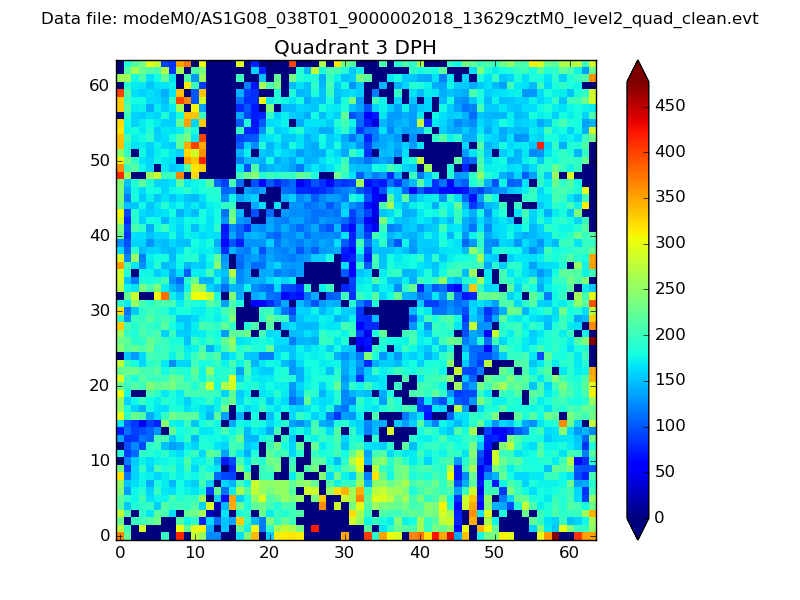 |
 |
Quadrant C |
| Plot type | Count rate plots | Images |
|---|---|---|
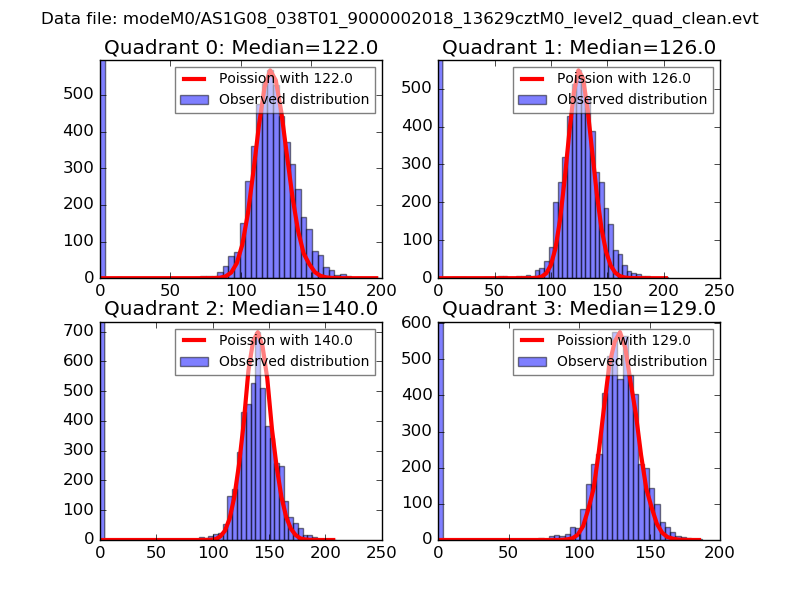
| Comparison with Poisson distribution Blue bars denote a histogram of data divided into 1 sec bins. Red curve is a Poisson curve with rate = median count rate of data. |
 |
 |
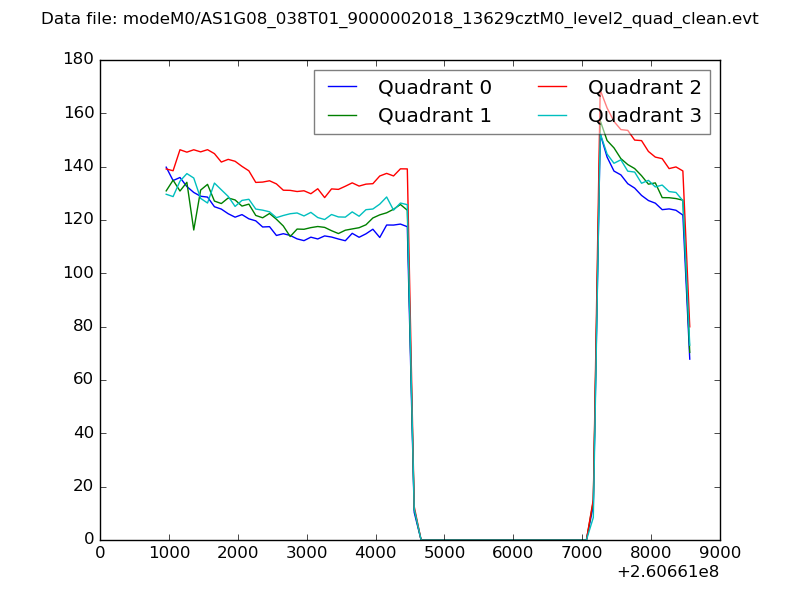
| Quadrant-wise count rates Data is divided into 100 sec bins |
 |
|
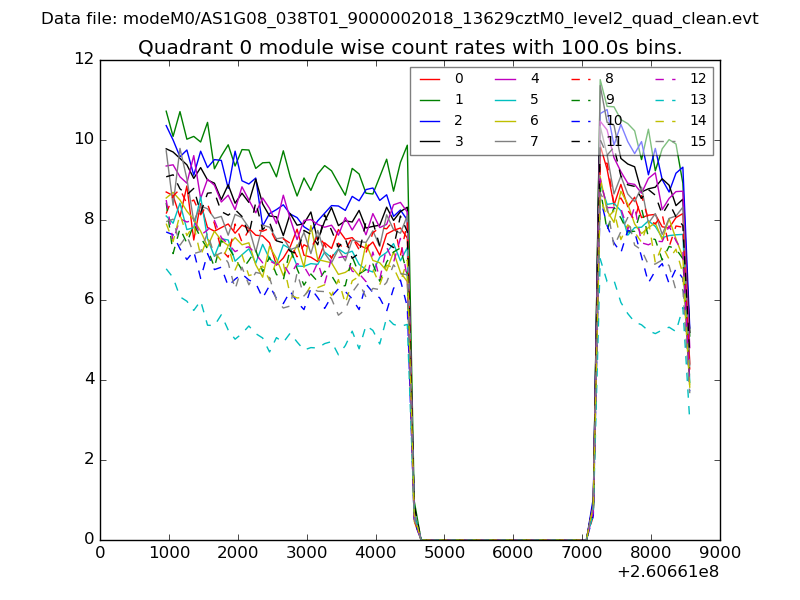
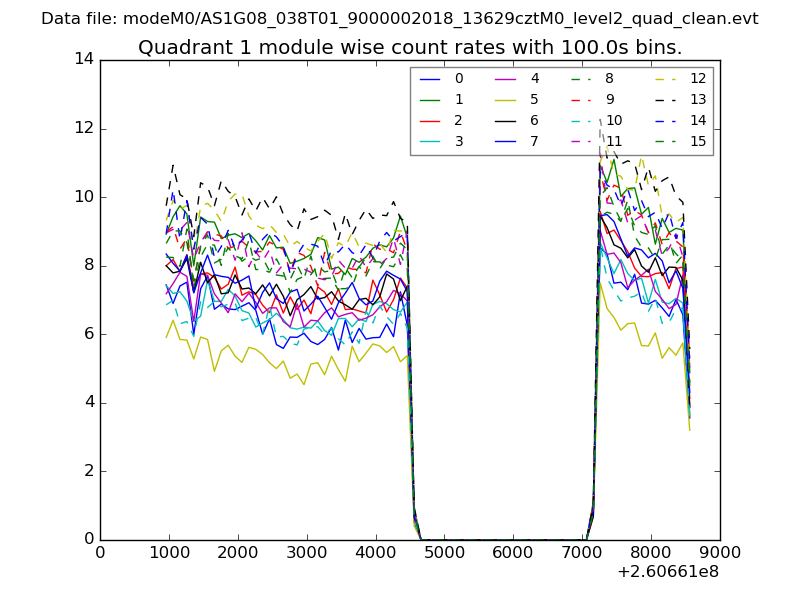
| Module-wise count rates for Quadrant A Data is divided into 100 sec bins |
 |
 |
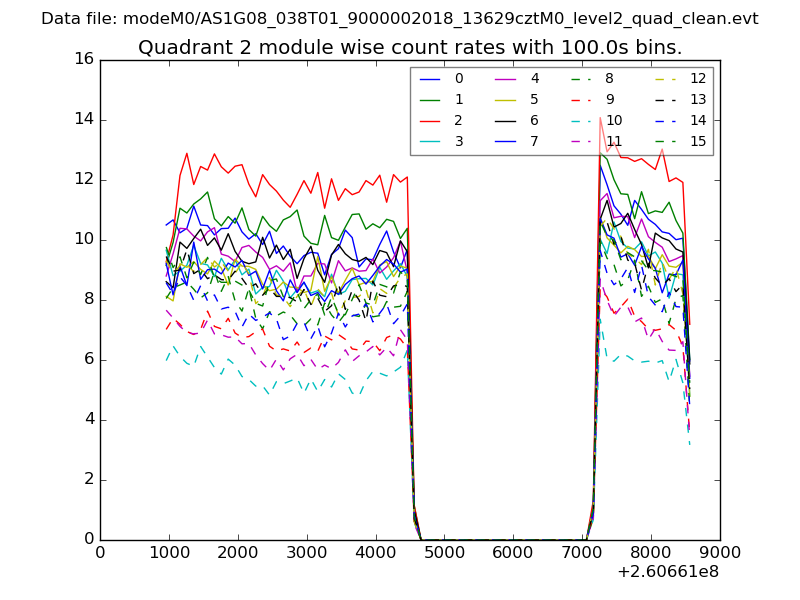
| Module-wise count rates for Quadrant B Data is divided into 100 sec bins |
 |
 |
| Module-wise count rates for Quadrant C Data is divided into 100 sec bins |
 |
 |
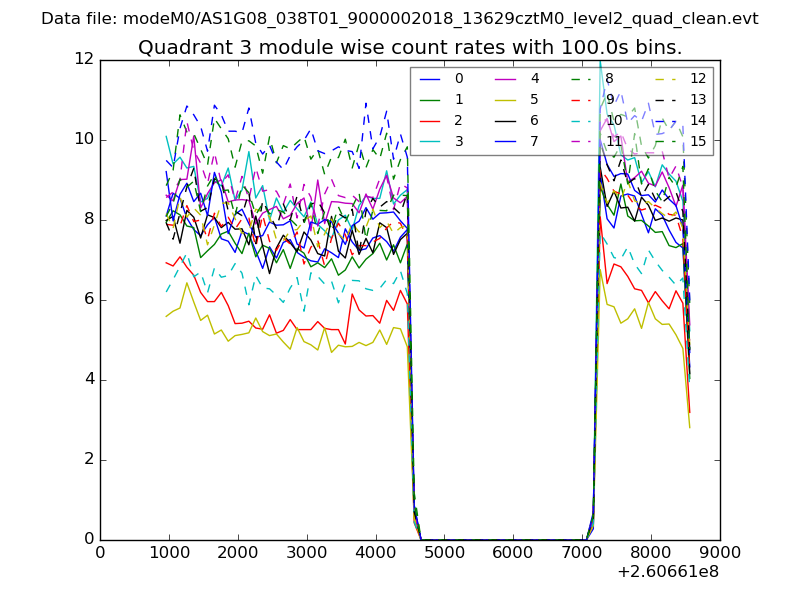
| Module-wise count rates for Quadrant D Data is divided into 100 sec bins |
 |
 |
| Parameter | Plot |
|---|---|
| CZT HV Monitor | 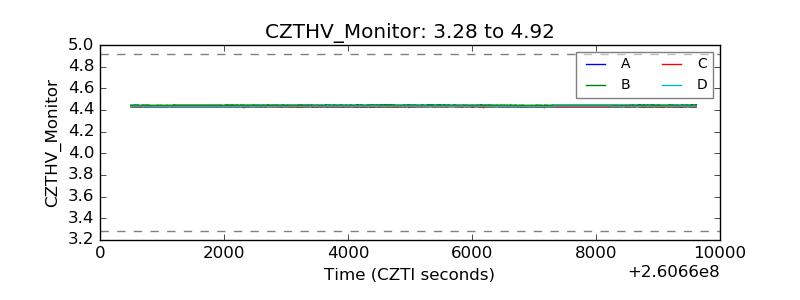 |
| D_VDD | 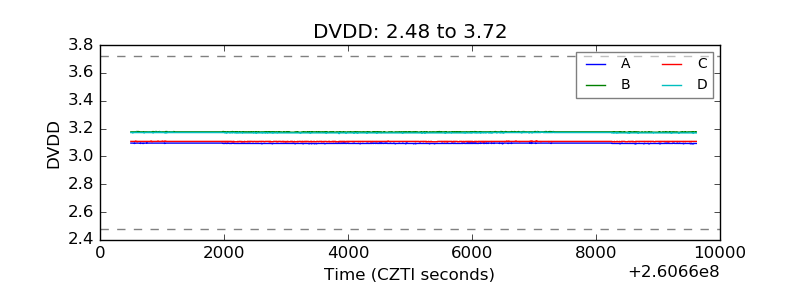 |
| Temperature 1 | 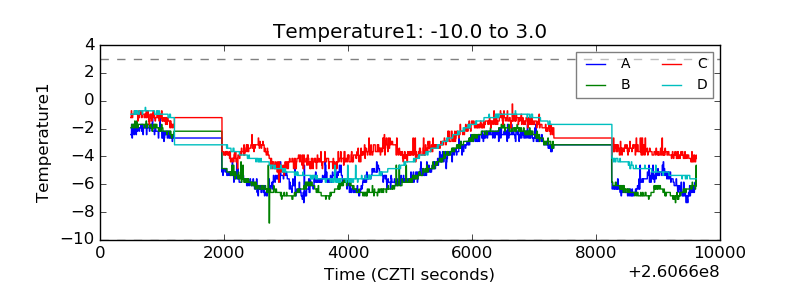 |
| Veto HV Monitor | 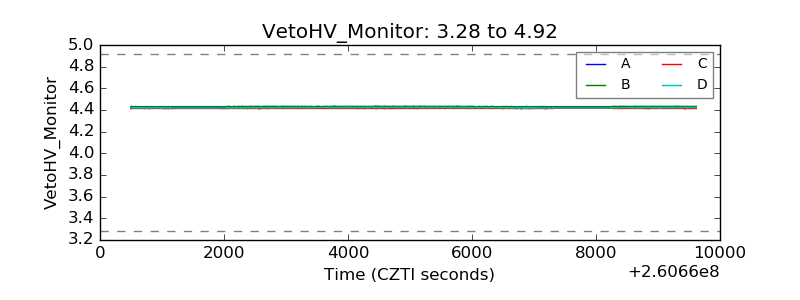 |
| Veto LLD | 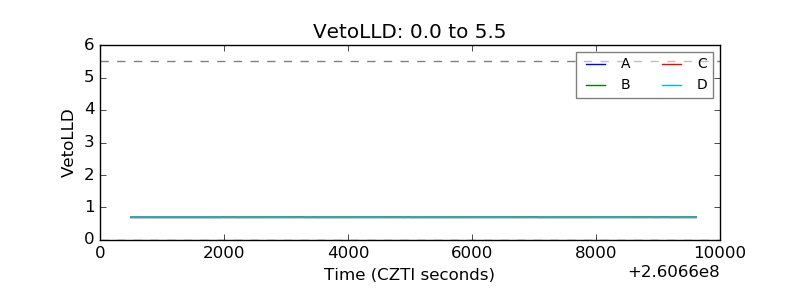 |
| Alpha Counter | 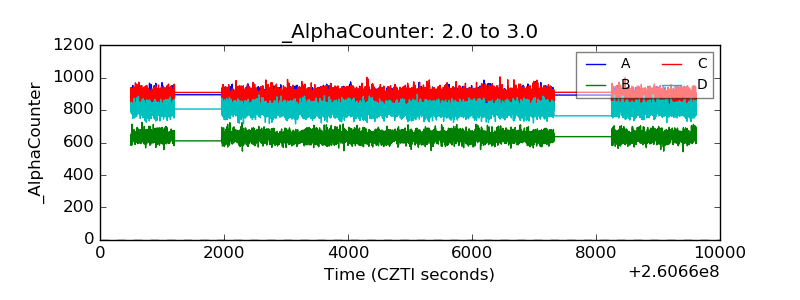 |
| _CPM_Rate | 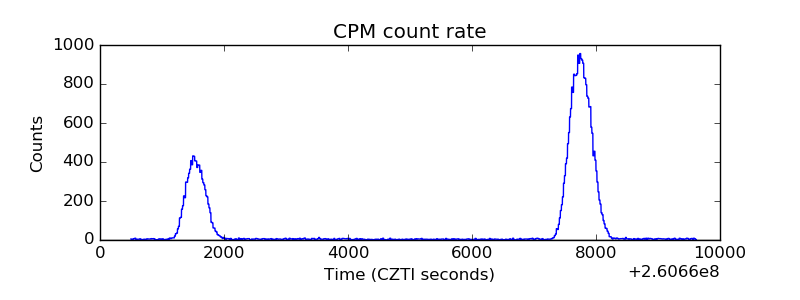 |
| CZT Counter | 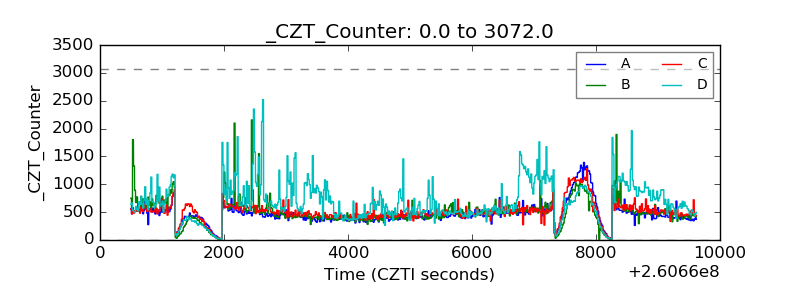 |
| +2.5 Volts monitor |  |
| +5 Volts monitor |  |
| _ROLL_ROT | 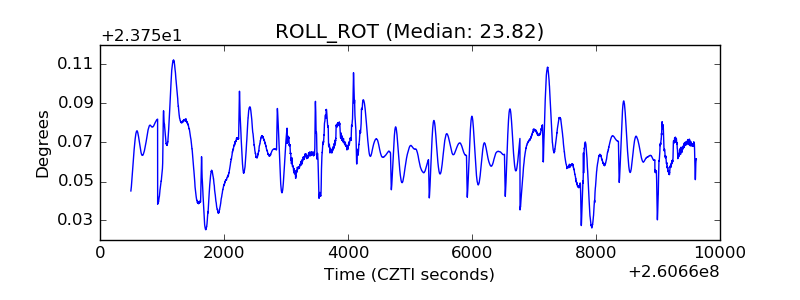 |
| _Roll_DEC | 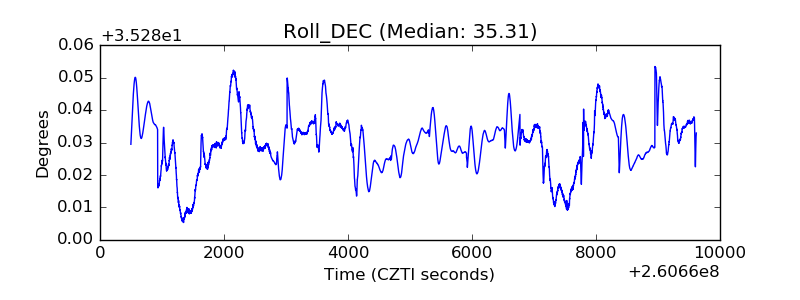 |
| _Roll_RA | 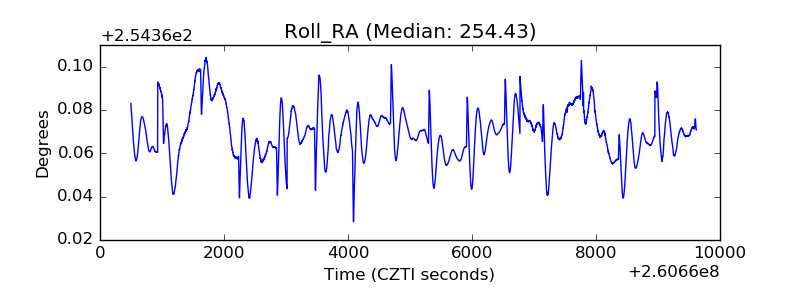 |
| Veto Counter | 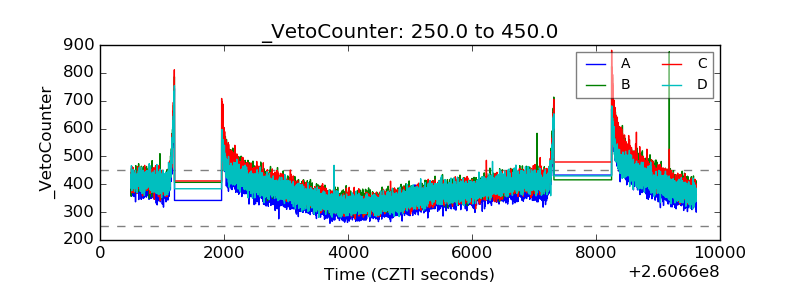 |