| Param | Original file | Final file |
|---|---|---|
| Filename | modeM0/AS1G08_038T01_9000002018_13632cztM0_level2.evt | modeM0/AS1G08_038T01_9000002018_13632cztM0_level2_quad_clean.evt |
| Size (bytes) | 481,420,800 | 99,400,320 |
| Size | 459.1 MB | 94.8 MB |
| Events in quadrant A | 3,082,516 | 610,944 |
| Events in quadrant B | 3,318,743 | 636,567 |
| Events in quadrant C | 3,267,773 | 675,595 |
| Events in quadrant D | 4,468,779 | 633,111 |
| Mode M0 | |||
|---|---|---|---|
| Quadrant | BADHDUFLAG | Total packets | Discarded packets |
| A | 0 | 13558 | 112 |
| B | 0 | 14142 | 106 |
| C | 0 | 13771 | 116 |
| D | 0 | 17830 | 199 |
| Mode SS | |||
|---|---|---|---|
| Quadrant | BADHDUFLAG | Total packets | Discarded packets |
| A | 0 | 134 | 0 |
| B | 0 | 134 | 0 |
| C | 0 | 134 | 4 |
| D | 0 | 134 | 2 |
| Mode M9 | |||
|---|---|---|---|
| Quadrant | BADHDUFLAG | Total packets | Discarded packets |
| A | 0 | 13 | 0 |
| B | 0 | 13 | 0 |
| C | 0 | 13 | 0 |
| D | 0 | 14 | 0 |
| Quadrant | Total seconds | Saturated seconds | Saturation percentage |
|---|---|---|---|
| A | 6517 | 22 | 0.337579% |
| B | 6520 | 33 | 0.506135% |
| C | 6515 | 24 | 0.368381% |
| D | 6493 | 73 | 1.124288% |
Noise dominated data is calculated using 1-second bins in cleaned event files. If a bin has >2000 counts, and if more than 50% of those come from <1% of pixels, then it is considered to be noise-dominated and hence unusable.
| Quadrant | # 1 sec bins | Bins with >0 counts | Bins with >2000 counts | High rate bins dominated by noise | Noise dominated (total time) | Noise dominated (detector-on time) | Marked lightcurve |
|---|---|---|---|---|---|---|---|
| A | 7763 | 6568 | 4 | 4 | 0.05% | 0.06% | 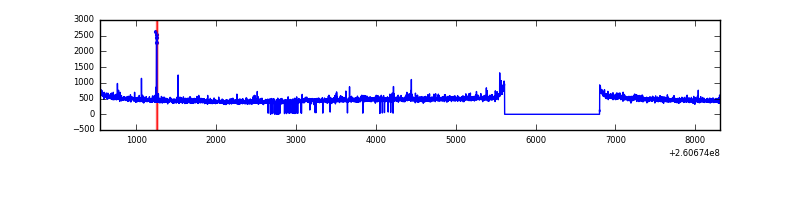 |
| B | 7763 | 6562 | 1 | 1 | 0.01% | 0.02% | 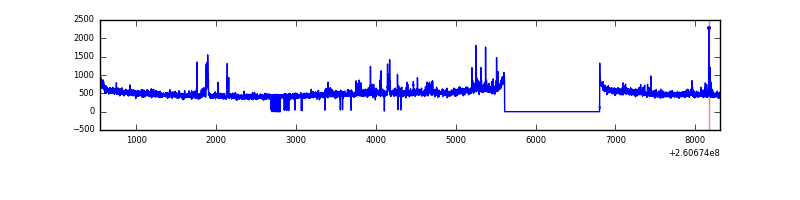 |
| C | 7763 | 6560 | 5 | 5 | 0.06% | 0.08% | 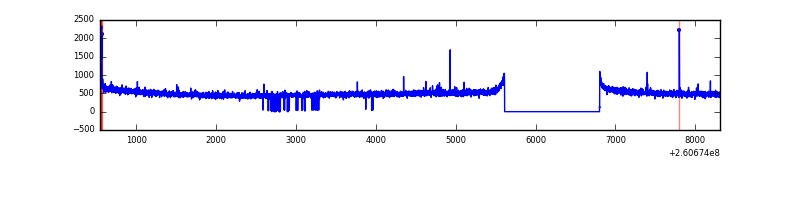 |
| D | 7763 | 6559 | 32 | 32 | 0.41% | 0.49% | 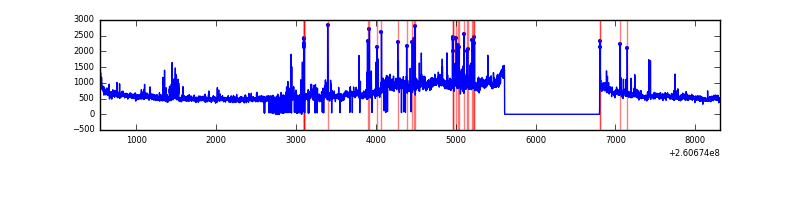 |
Top three noisy pixels from each quadrant. If the there are fewer than three noisy pixels in the level2.evt file, extra rows are filled as -1
| Pixel properties | Quadrant properties | ||||||
|---|---|---|---|---|---|---|---|
| Quadrant | DetID | PixID | Counts | Sigma | Mean | Median | Sigma |
| A | 1 | 162 | 23973 | 145.34 | 786 | 772 | 159.6 |
| A | 3 | 0 | 12655 | 74.44 | 786 | 772 | 159.6 |
| A | 1 | 178 | 8864 | 50.69 | 786 | 772 | 159.6 |
| B | 0 | 219 | 84853 | 565.83 | 795 | 776 | 148.6 |
| B | 0 | 229 | 62760 | 417.15 | 795 | 776 | 148.6 |
| B | 0 | 182 | 23527 | 153.11 | 795 | 776 | 148.6 |
| C | 3 | 233 | 186032 | 1035.21 | 783 | 793 | 178.9 |
| C | 14 | 234 | 20389 | 109.51 | 783 | 793 | 178.9 |
| C | 0 | 207 | 6995 | 34.66 | 783 | 793 | 178.9 |
| D | 13 | 122 | 982654 | 4951.09 | 760 | 748 | 198.3 |
| D | 8 | 195 | 443682 | 2233.42 | 760 | 748 | 198.3 |
| D | 5 | 222 | 87129 | 435.56 | 760 | 748 | 198.3 |
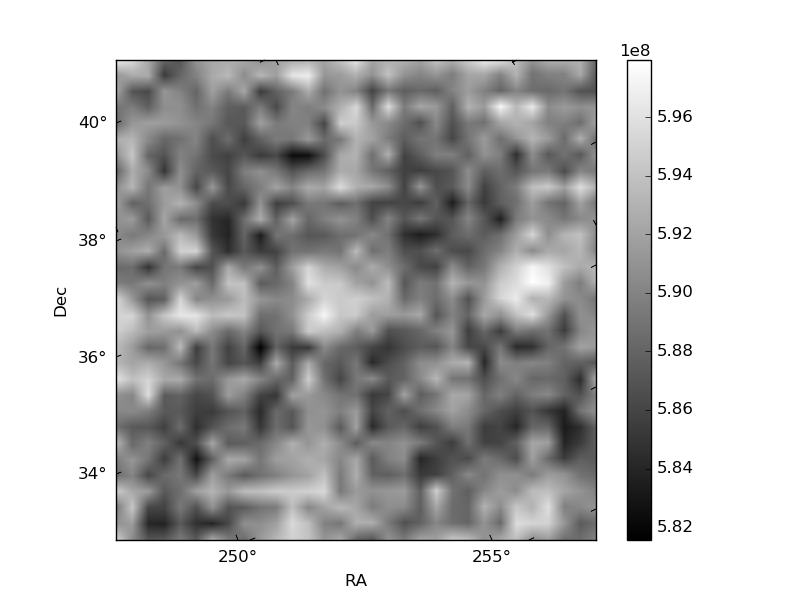
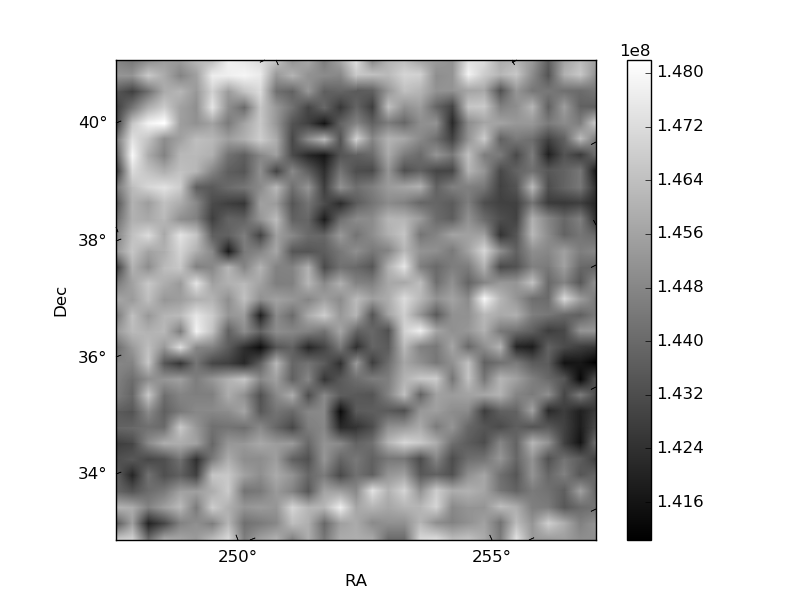
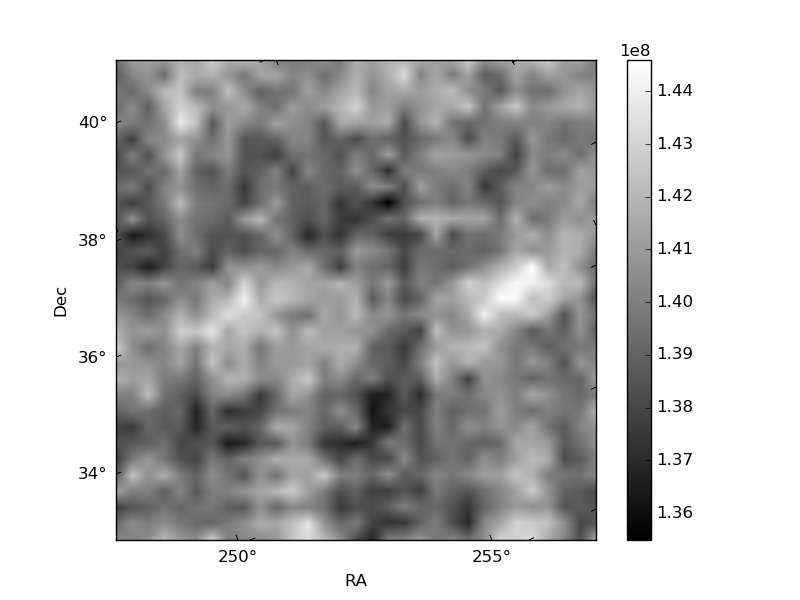
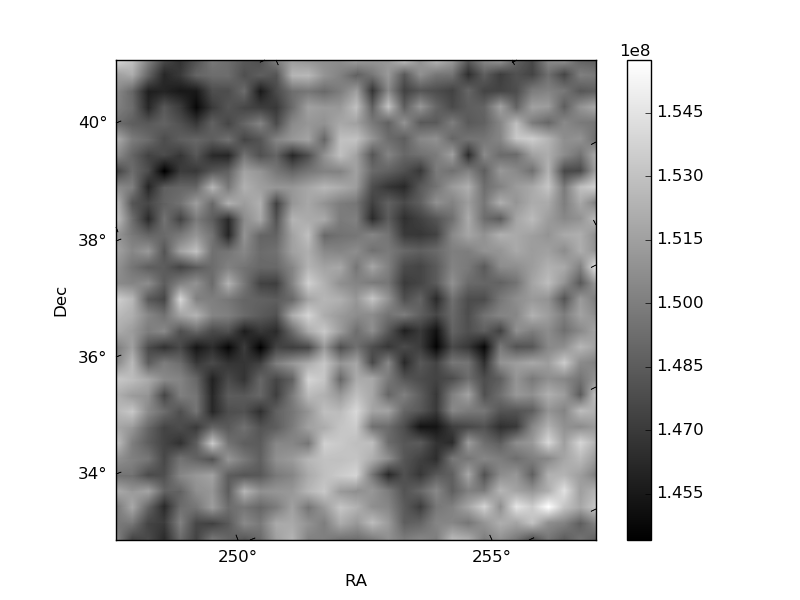
Histogram calculated using DETX and DETY for each event in the final _common_clean file
| Quadrant A | 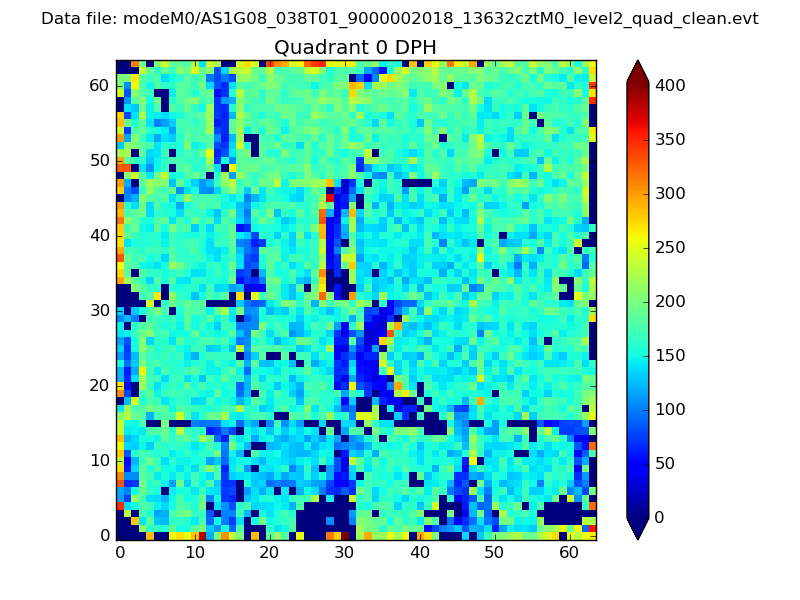 |
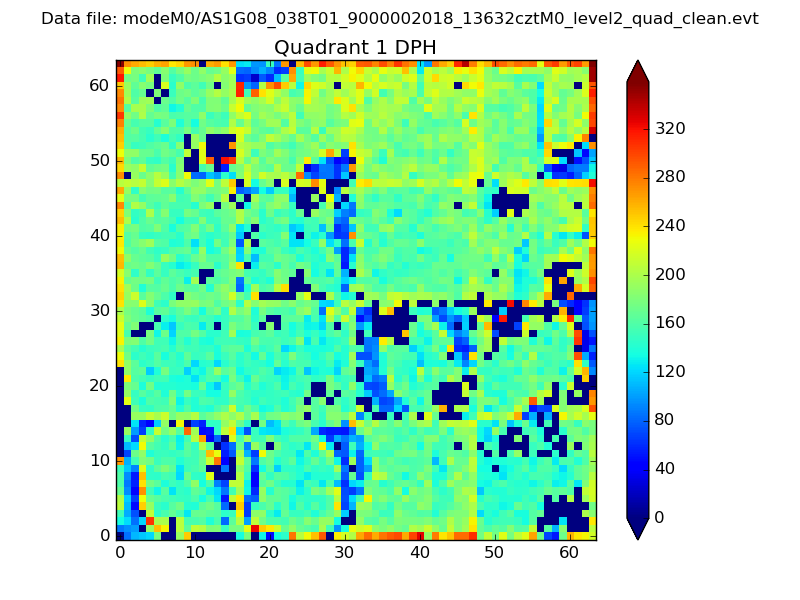 |
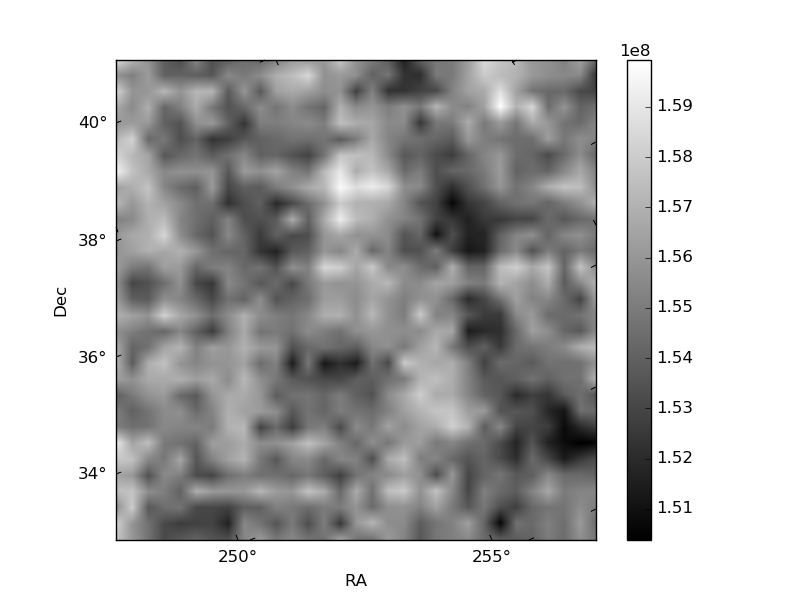
Quadrant B |
|---|---|---|---|
| Quadrant D | 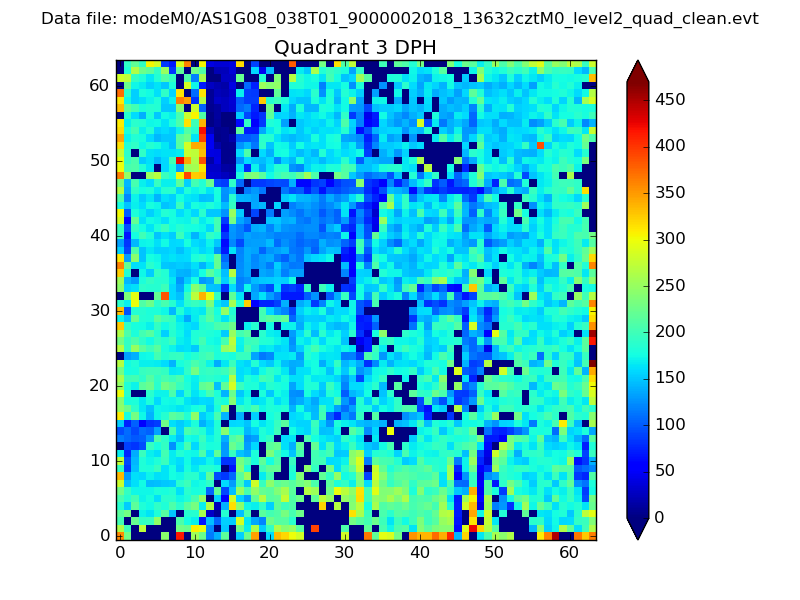 |
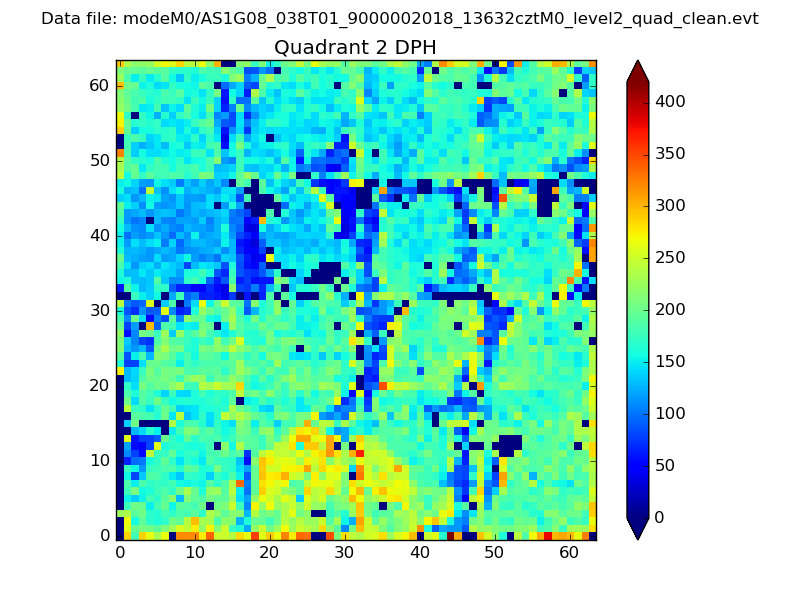 |
Quadrant C |
| Plot type | Count rate plots | Images |
|---|---|---|
| Comparison with Poisson distribution Blue bars denote a histogram of data divided into 1 sec bins. Red curve is a Poisson curve with rate = median count rate of data. |
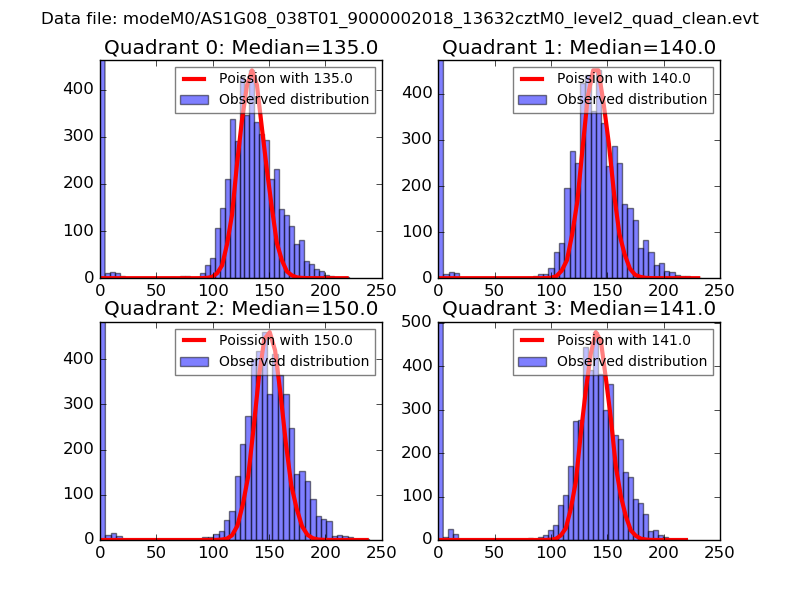 |
 |
| Quadrant-wise count rates Data is divided into 100 sec bins |
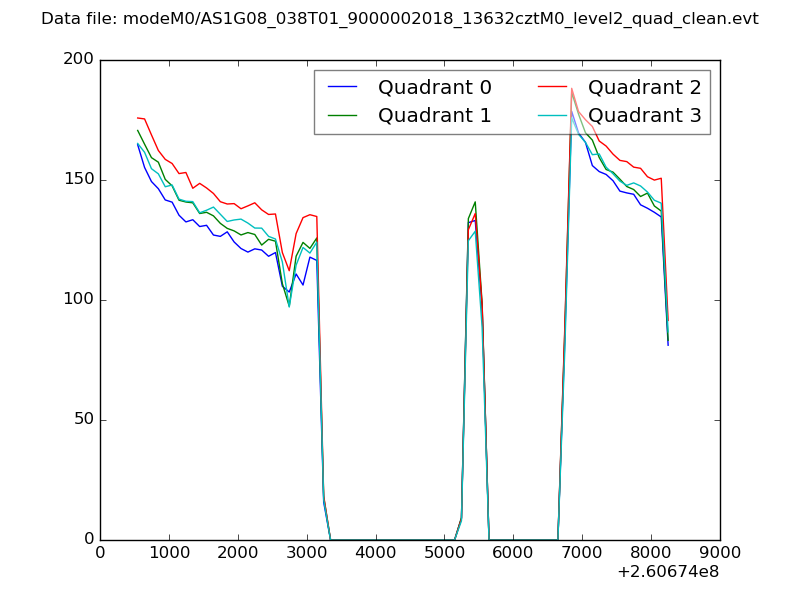 |
|
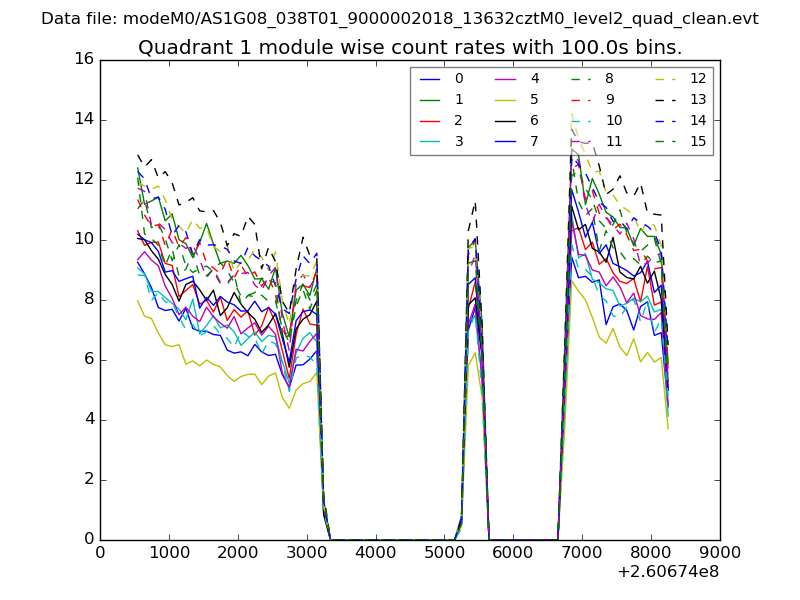
| Module-wise count rates for Quadrant A Data is divided into 100 sec bins |
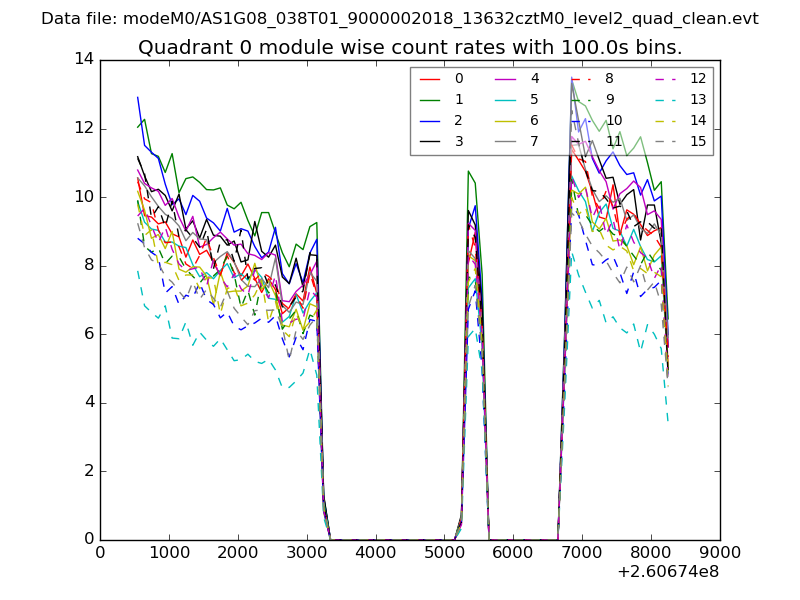 |
 |
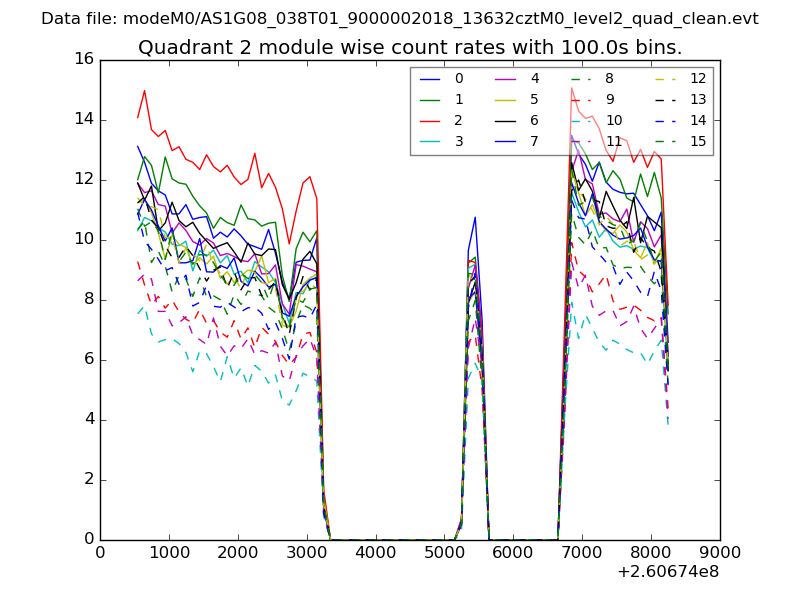
| Module-wise count rates for Quadrant B Data is divided into 100 sec bins |
 |
 |
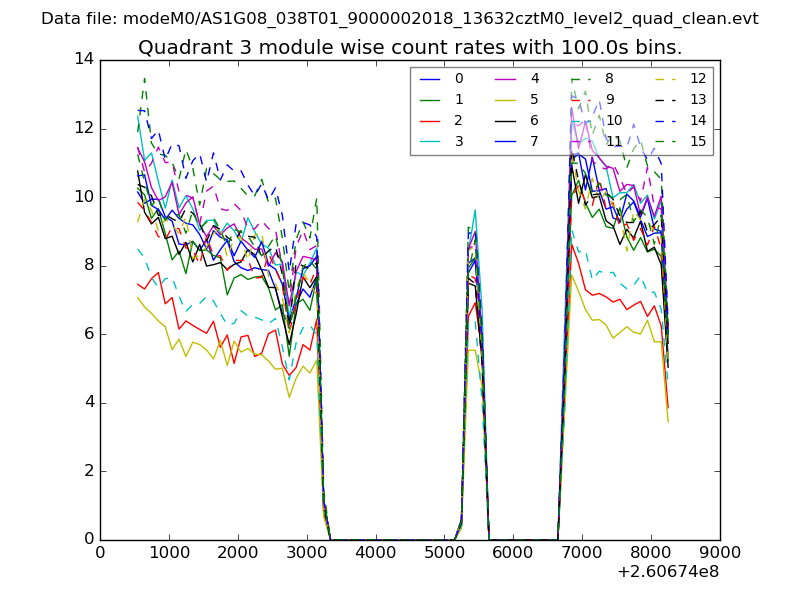
| Module-wise count rates for Quadrant C Data is divided into 100 sec bins |
 |
 |
| Module-wise count rates for Quadrant D Data is divided into 100 sec bins |
 |
 |
| Parameter | Plot |
|---|---|
| CZT HV Monitor |  |
| D_VDD | 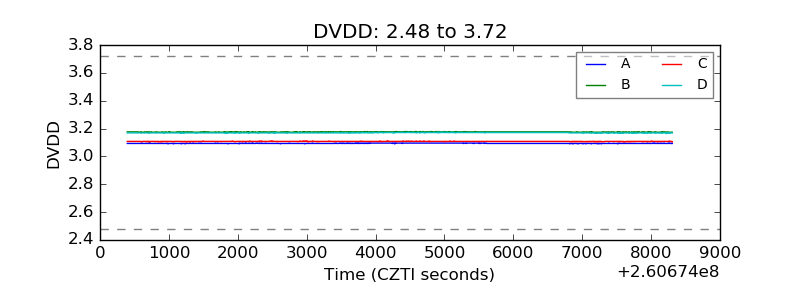 |
| Temperature 1 | 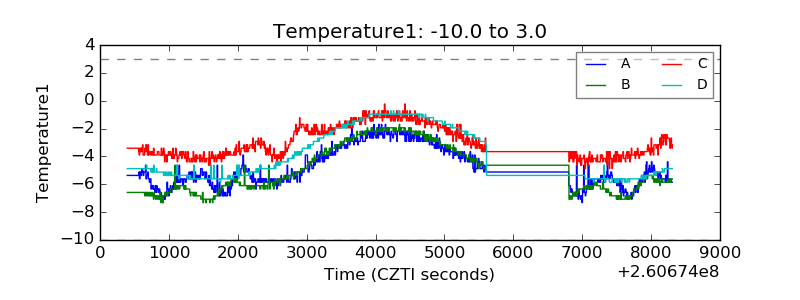 |
| Veto HV Monitor | 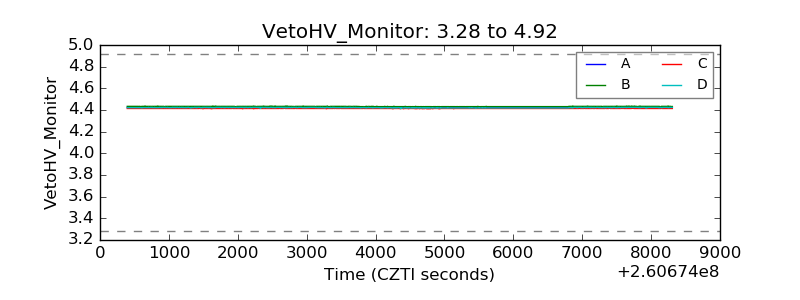 |
| Veto LLD | 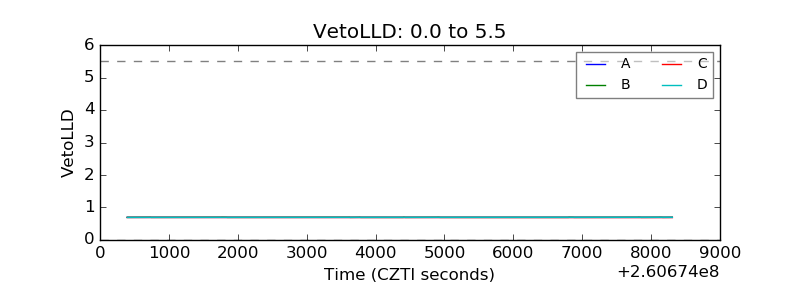 |
| Alpha Counter | 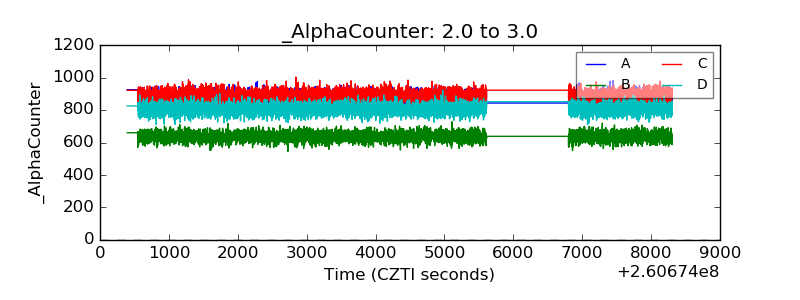 |
| _CPM_Rate | 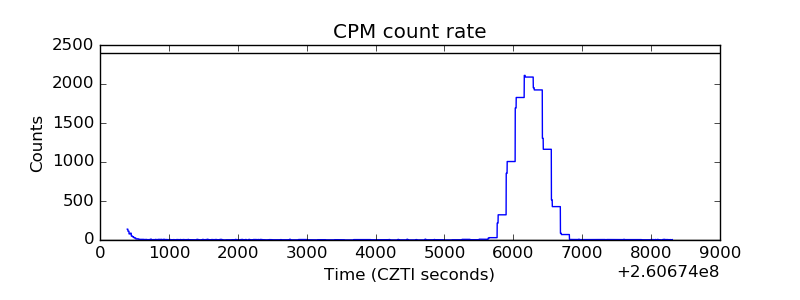 |
| CZT Counter | 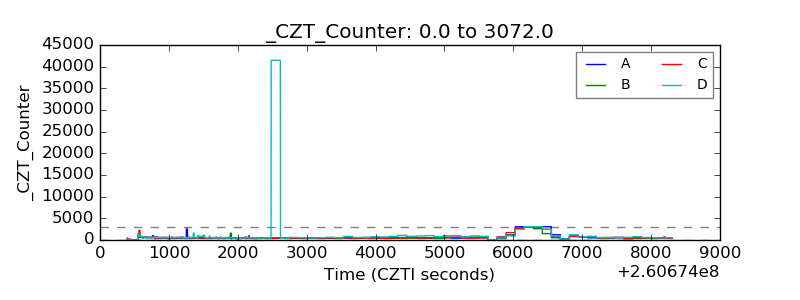 |
| +2.5 Volts monitor |  |
| +5 Volts monitor |  |
| _ROLL_ROT | 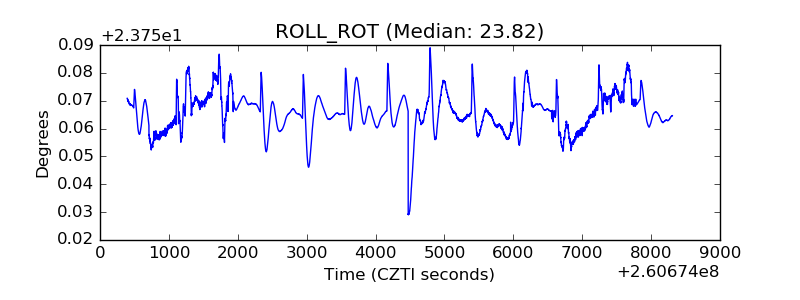 |
| _Roll_DEC | 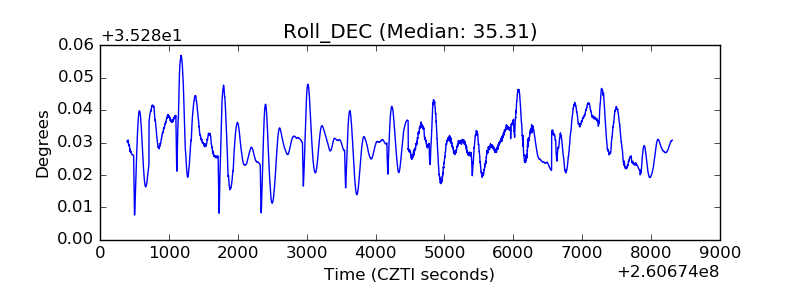 |
| _Roll_RA | 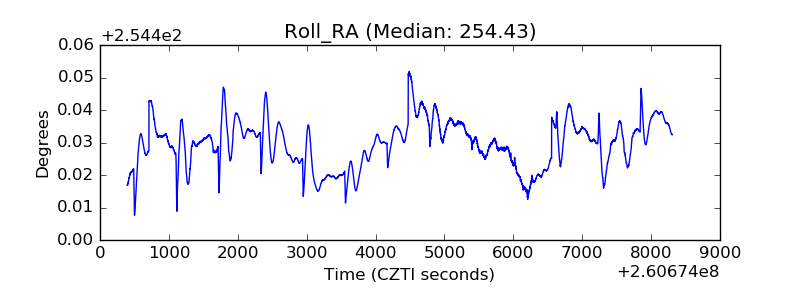 |
| Veto Counter | 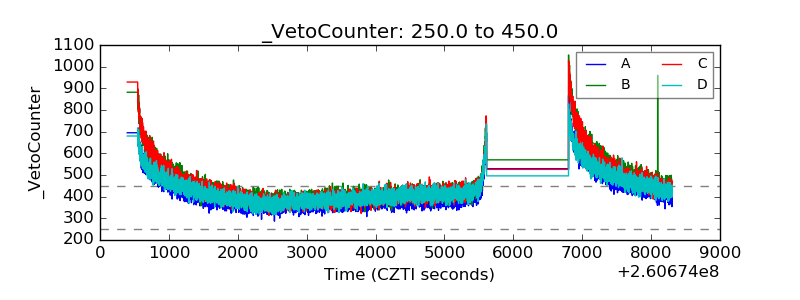 |