| Param | Original file | Final file |
|---|---|---|
| Filename | modeM0/AS1G08_038T01_9000002018_13633cztM0_level2.evt | modeM0/AS1G08_038T01_9000002018_13633cztM0_level2_quad_clean.evt |
| Size (bytes) | 547,522,560 | 99,587,520 |
| Size | 522.2 MB | 95.0 MB |
| Events in quadrant A | 3,141,726 | 637,565 |
| Events in quadrant B | 3,331,719 | 657,262 |
| Events in quadrant C | 3,288,888 | 690,490 |
| Events in quadrant D | 6,387,487 | 585,682 |
| Mode M0 | |||
|---|---|---|---|
| Quadrant | BADHDUFLAG | Total packets | Discarded packets |
| A | 0 | 13275 | 3 |
| B | 0 | 13775 | 2 |
| C | 0 | 13474 | 2 |
| D | 0 | 23133 | 2 |
| Mode SS | |||
|---|---|---|---|
| Quadrant | BADHDUFLAG | Total packets | Discarded packets |
| A | 0 | 128 | 0 |
| B | 0 | 128 | 0 |
| C | 0 | 128 | 0 |
| D | 0 | 128 | 0 |
| Mode M9 | |||
|---|---|---|---|
| Quadrant | BADHDUFLAG | Total packets | Discarded packets |
| A | 0 | 16 | 0 |
| B | 0 | 16 | 0 |
| C | 0 | 16 | 0 |
| D | 0 | 17 | 0 |
| Quadrant | Total seconds | Saturated seconds | Saturation percentage |
|---|---|---|---|
| A | 6378 | 24 | 0.376294% |
| B | 6378 | 41 | 0.642835% |
| C | 6378 | 23 | 0.360615% |
| D | 6378 | 799 | 12.527438% |
Noise dominated data is calculated using 1-second bins in cleaned event files. If a bin has >2000 counts, and if more than 50% of those come from <1% of pixels, then it is considered to be noise-dominated and hence unusable.
| Quadrant | # 1 sec bins | Bins with >0 counts | Bins with >2000 counts | High rate bins dominated by noise | Noise dominated (total time) | Noise dominated (detector-on time) | Marked lightcurve |
|---|---|---|---|---|---|---|---|
| A | 7659 | 6380 | 0 | 0 | 0.00% | 0.00% | 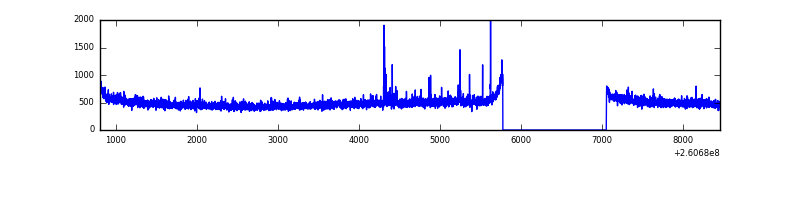 |
| B | 7659 | 6380 | 13 | 13 | 0.17% | 0.20% | 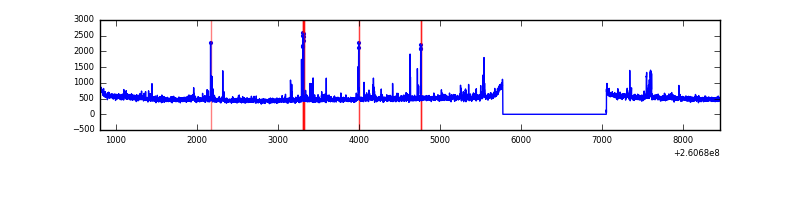 |
| C | 7659 | 6380 | 3 | 3 | 0.04% | 0.05% | 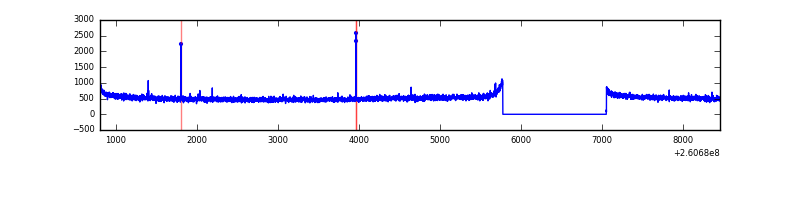 |
| D | 7659 | 6380 | 772 | 772 | 10.08% | 12.10% | 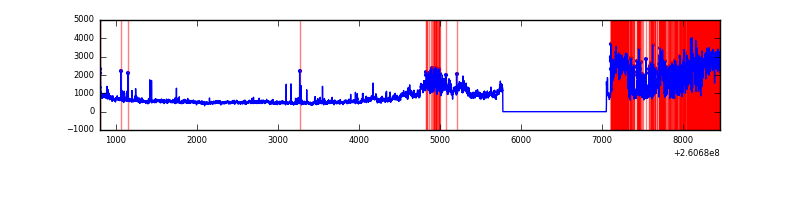 |
Top three noisy pixels from each quadrant. If the there are fewer than three noisy pixels in the level2.evt file, extra rows are filled as -1
| Pixel properties | Quadrant properties | ||||||
|---|---|---|---|---|---|---|---|
| Quadrant | DetID | PixID | Counts | Sigma | Mean | Median | Sigma |
| A | 1 | 162 | 23731 | 141.35 | 803 | 789 | 162.3 |
| A | 15 | 69 | 12724 | 73.53 | 803 | 789 | 162.3 |
| A | 1 | 178 | 8481 | 47.39 | 803 | 789 | 162.3 |
| B | 3 | 64 | 70530 | 465.72 | 806 | 789 | 149.7 |
| B | 0 | 219 | 52575 | 345.82 | 806 | 789 | 149.7 |
| B | 0 | 245 | 19491 | 124.89 | 806 | 789 | 149.7 |
| C | 3 | 233 | 189702 | 1054.79 | 790 | 800 | 179.1 |
| C | 14 | 234 | 13163 | 69.03 | 790 | 800 | 179.1 |
| C | 13 | 61 | 5564 | 26.6 | 790 | 800 | 179.1 |
| D | 5 | 222 | 1984288 | 10300.08 | 734 | 721 | 192.6 |
| D | 13 | 122 | 1271306 | 6597.77 | 734 | 721 | 192.6 |
| D | 8 | 195 | 151327 | 782.05 | 734 | 721 | 192.6 |
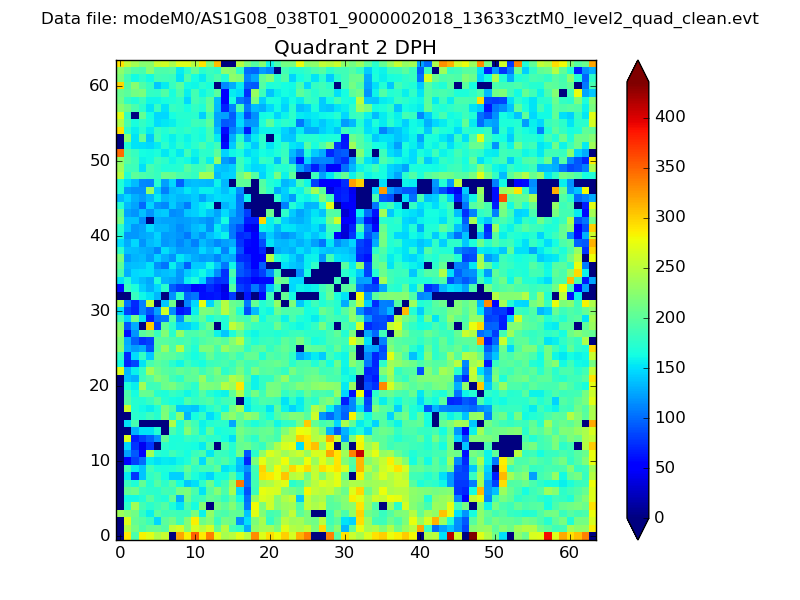
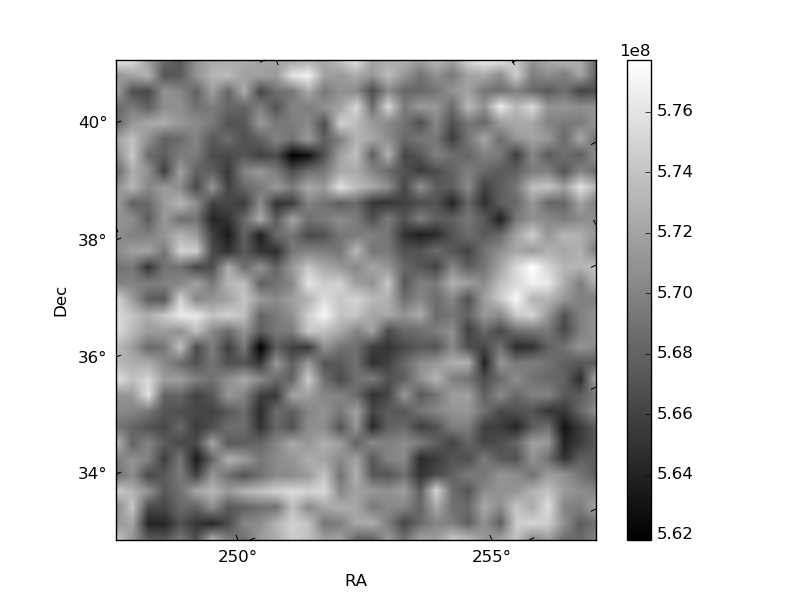
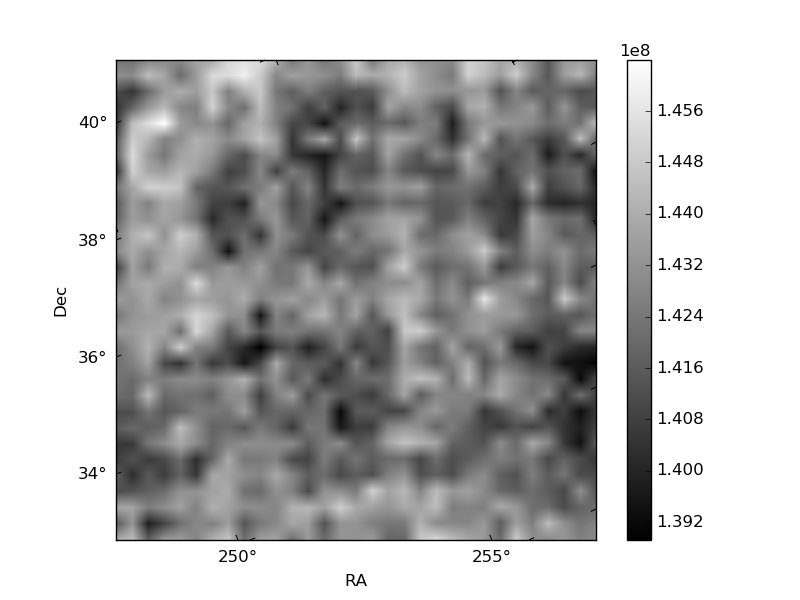
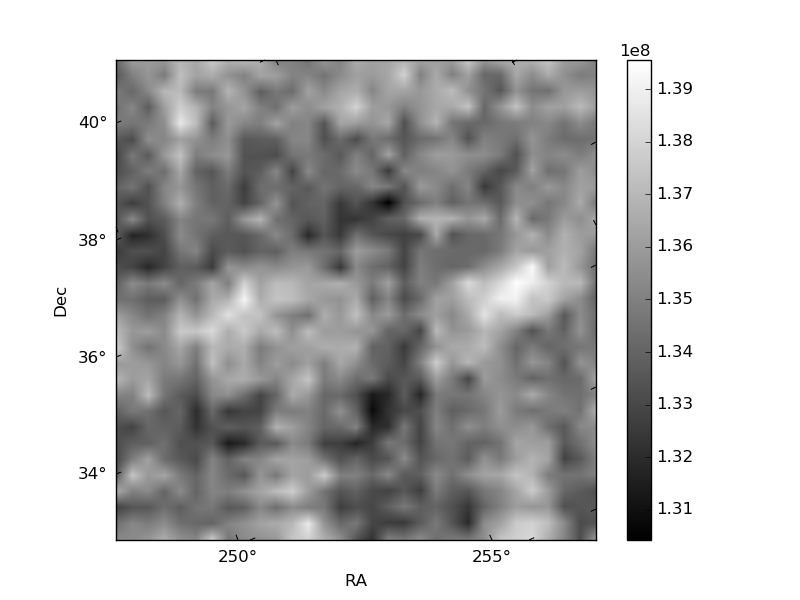
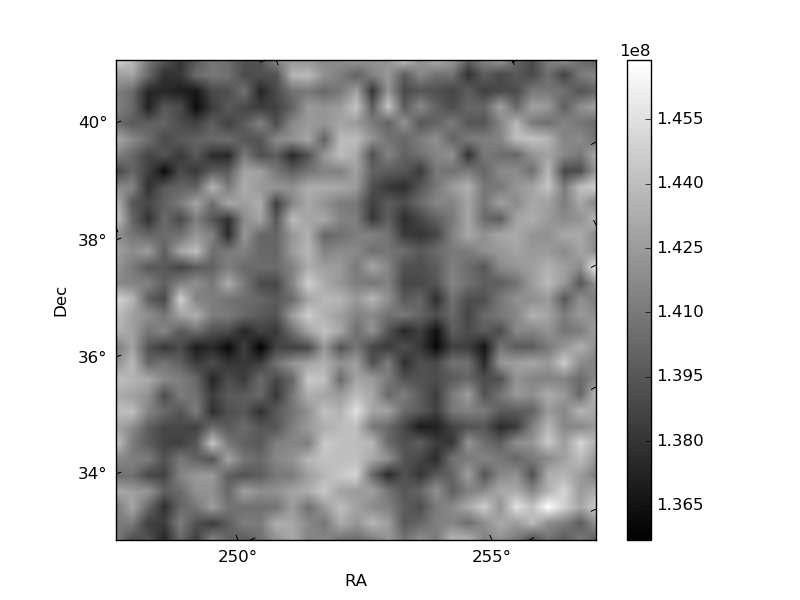
Histogram calculated using DETX and DETY for each event in the final _common_clean file
| Quadrant A | 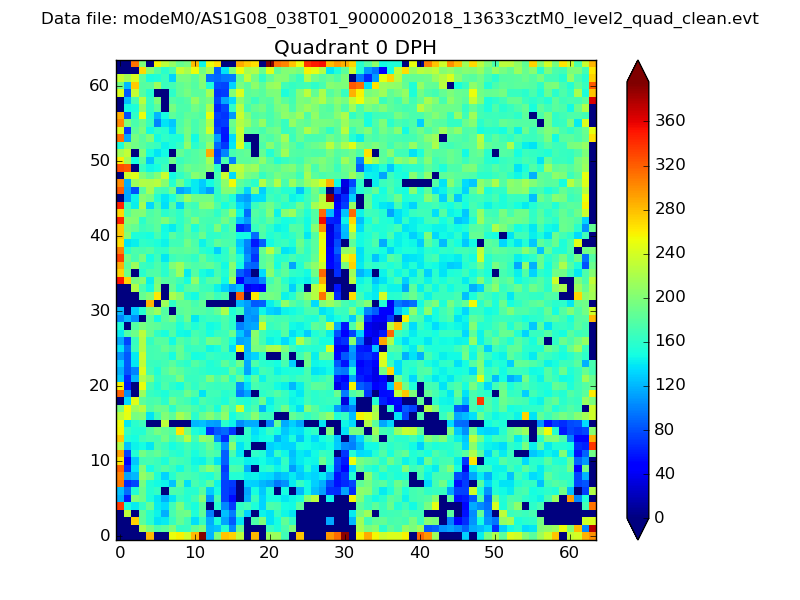 |
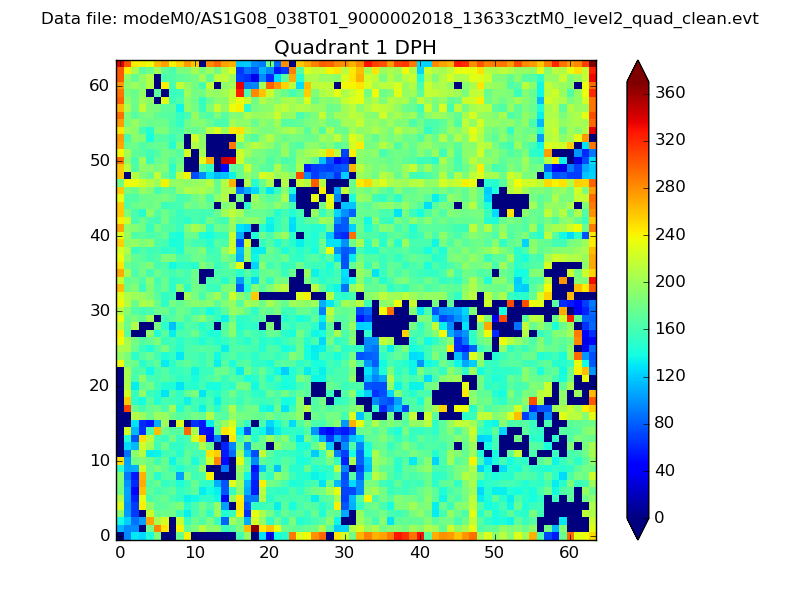 |
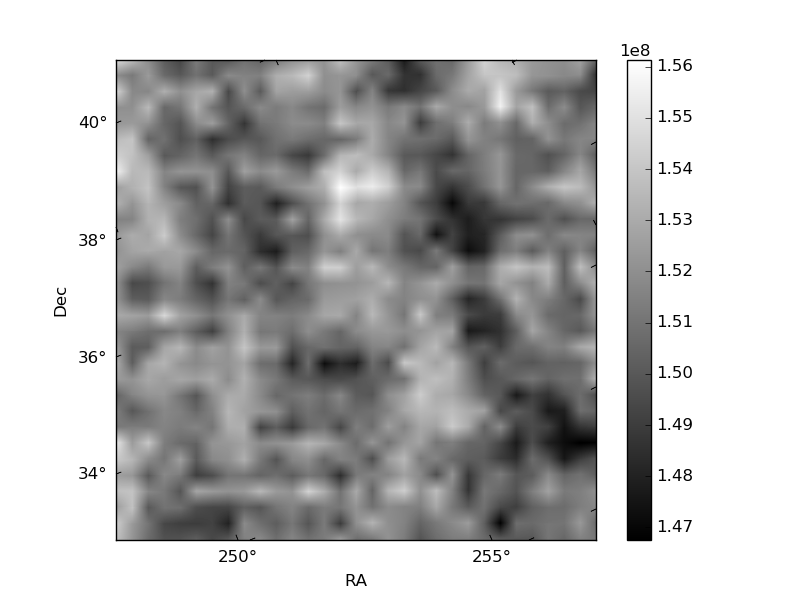
Quadrant B |
|---|---|---|---|
| Quadrant D | 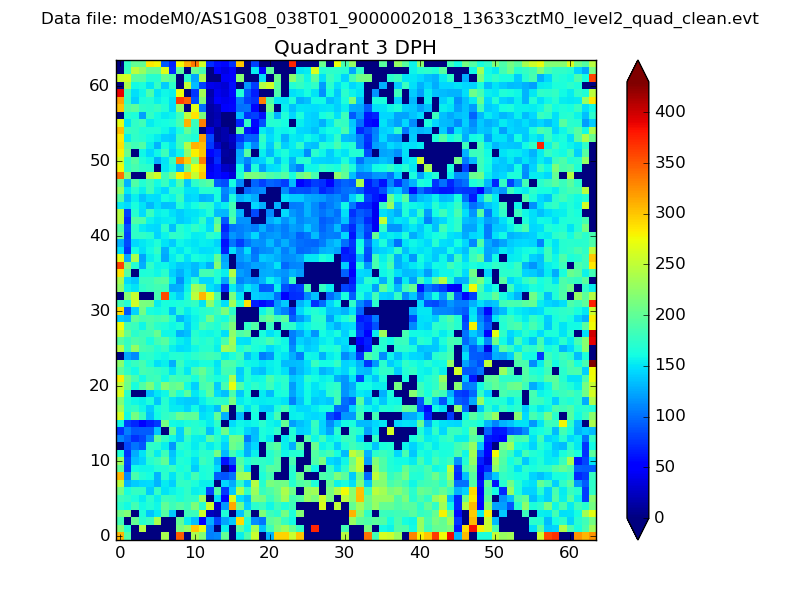 |
 |
Quadrant C |
| Plot type | Count rate plots | Images |
|---|---|---|
| Comparison with Poisson distribution Blue bars denote a histogram of data divided into 1 sec bins. Red curve is a Poisson curve with rate = median count rate of data. |
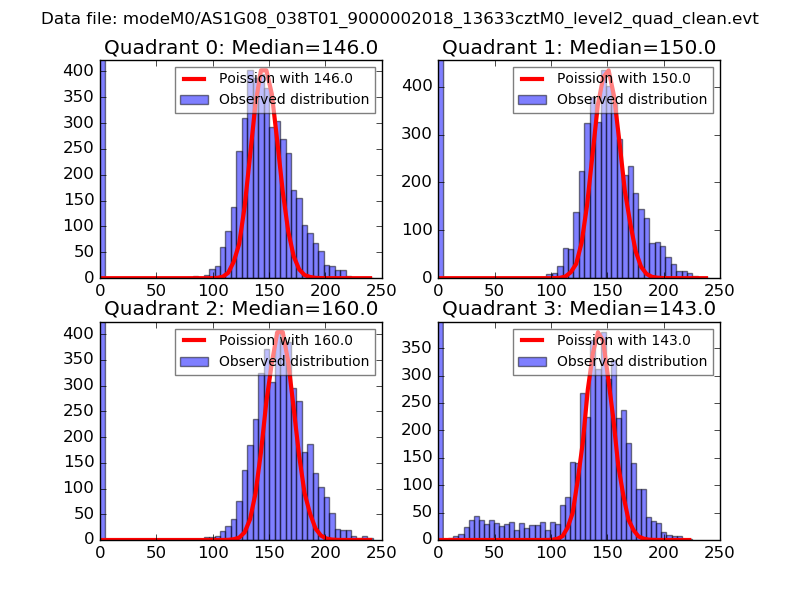 |
 |
| Quadrant-wise count rates Data is divided into 100 sec bins |
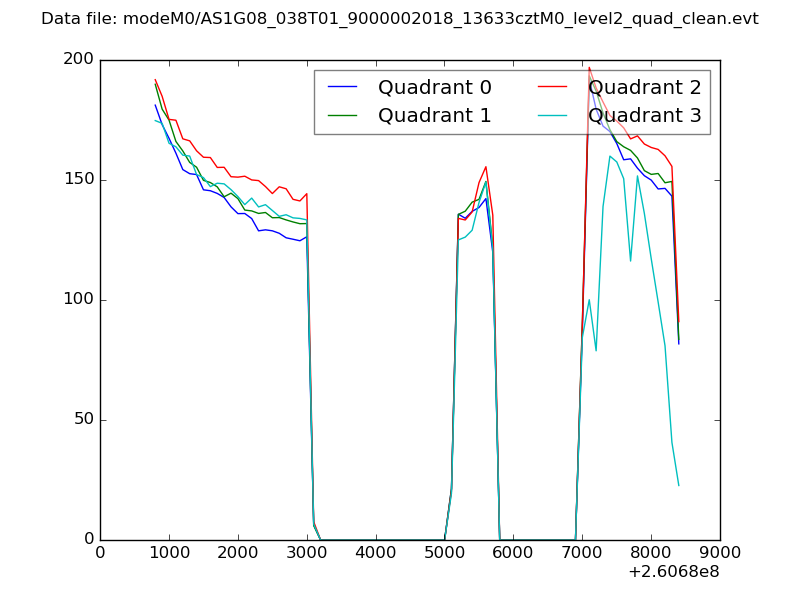 |
|
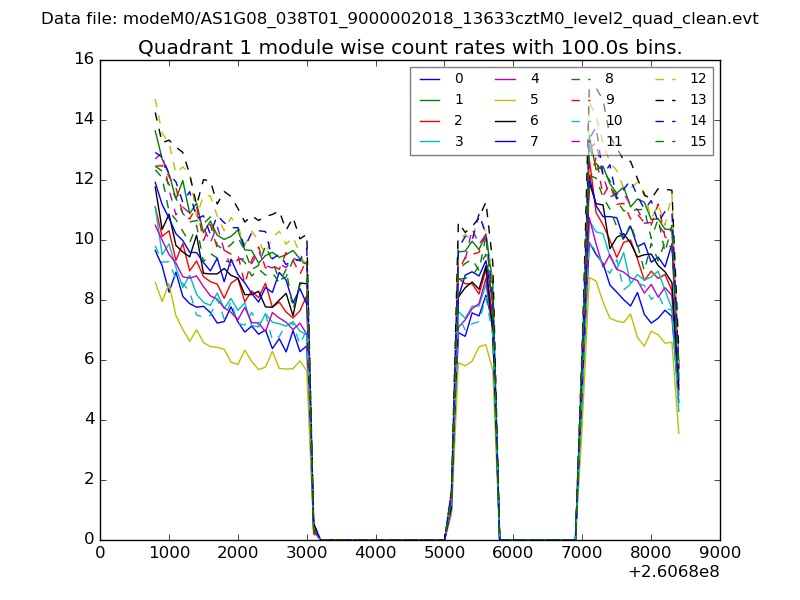
| Module-wise count rates for Quadrant A Data is divided into 100 sec bins |
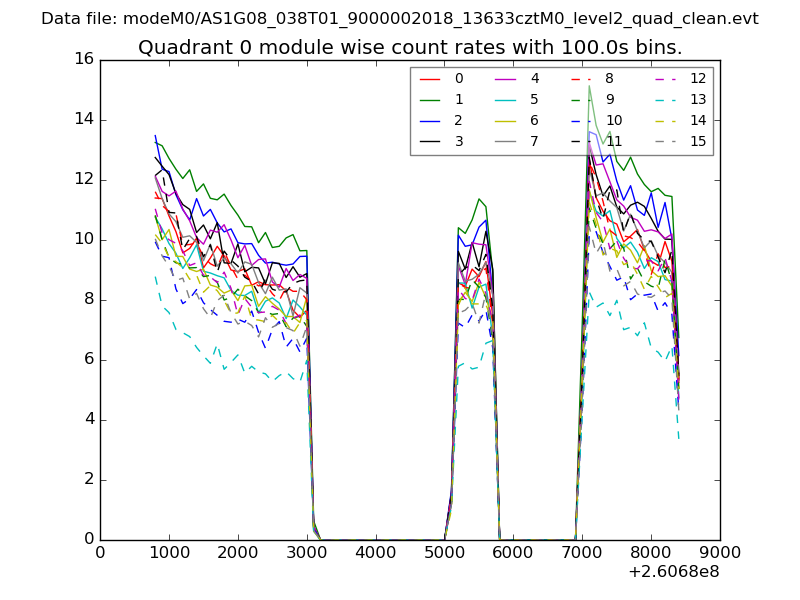 |
 |
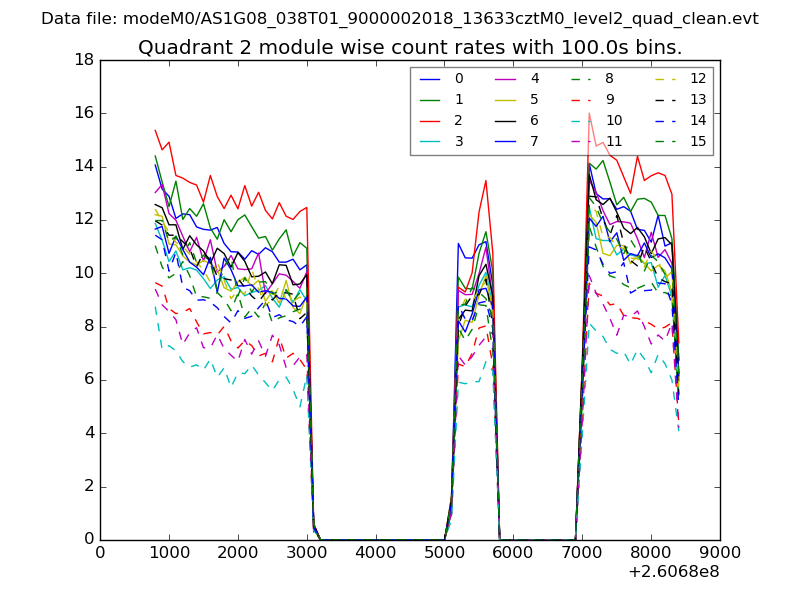
| Module-wise count rates for Quadrant B Data is divided into 100 sec bins |
 |
 |
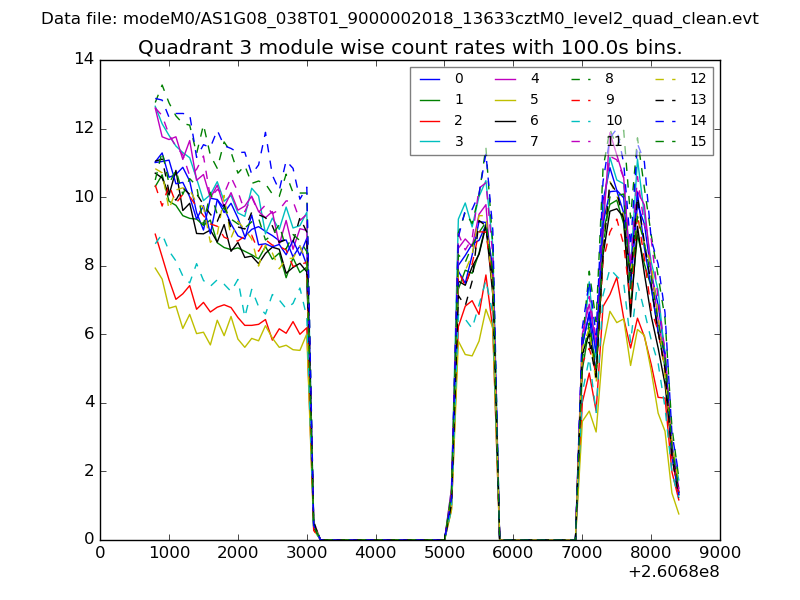
| Module-wise count rates for Quadrant C Data is divided into 100 sec bins |
 |
 |
| Module-wise count rates for Quadrant D Data is divided into 100 sec bins |
 |
 |
| Parameter | Plot |
|---|---|
| CZT HV Monitor | 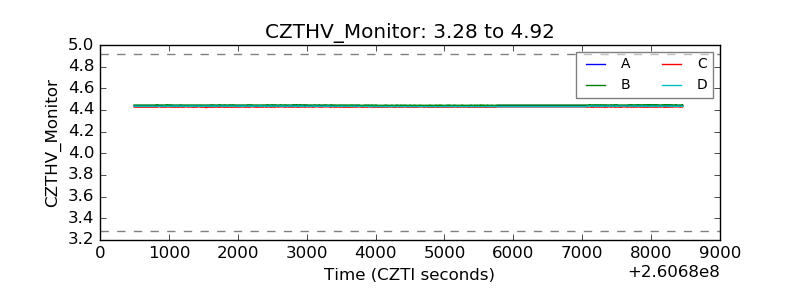 |
| D_VDD | 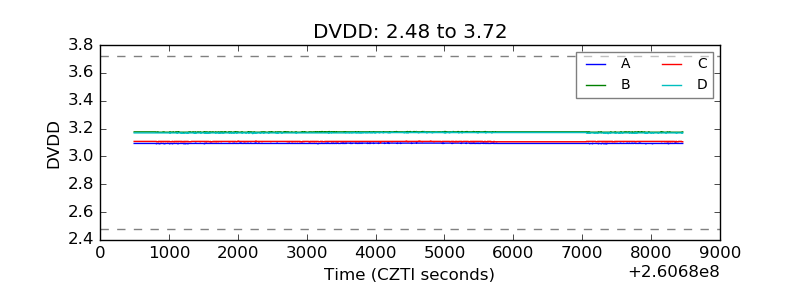 |
| Temperature 1 | 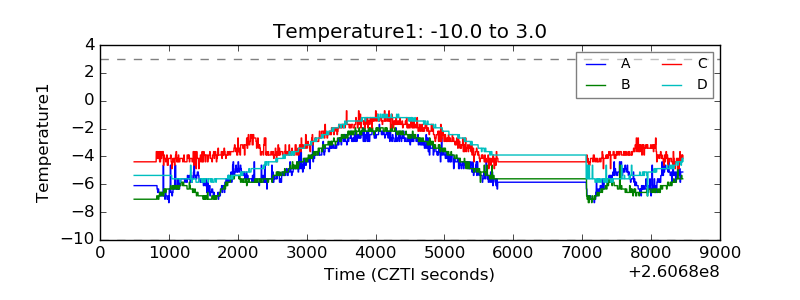 |
| Veto HV Monitor | 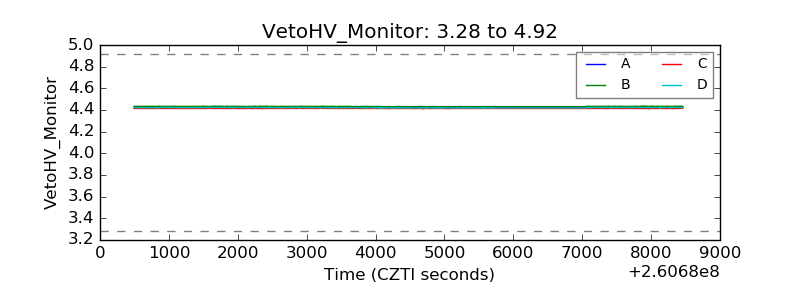 |
| Veto LLD | 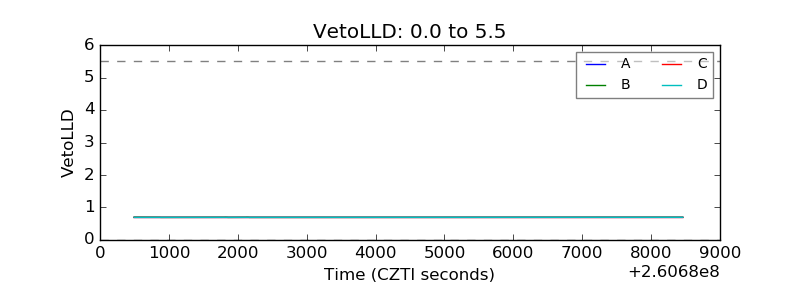 |
| Alpha Counter | 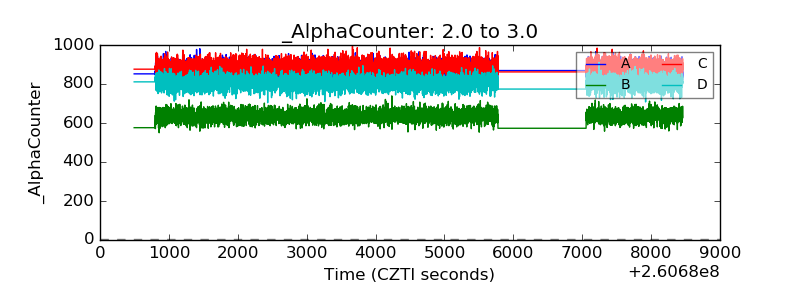 |
| _CPM_Rate | 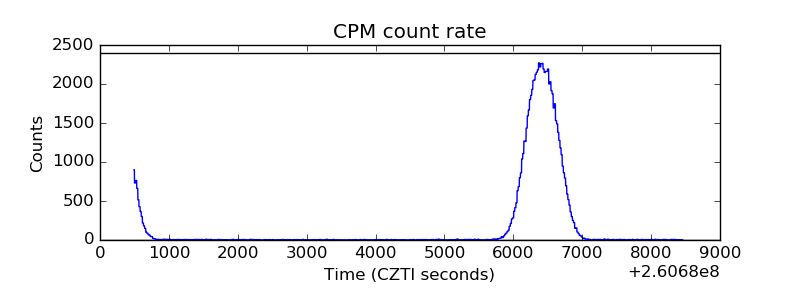 |
| CZT Counter | 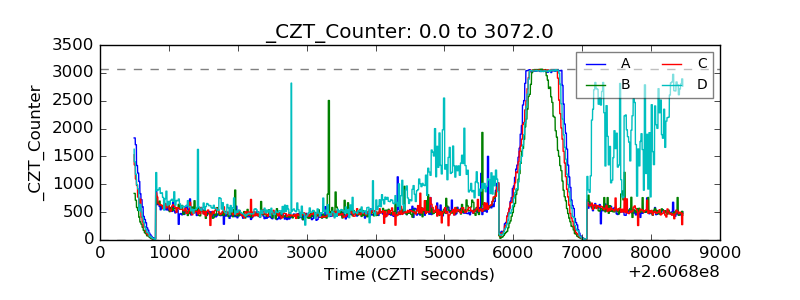 |
| +2.5 Volts monitor |  |
| +5 Volts monitor |  |
| _ROLL_ROT | 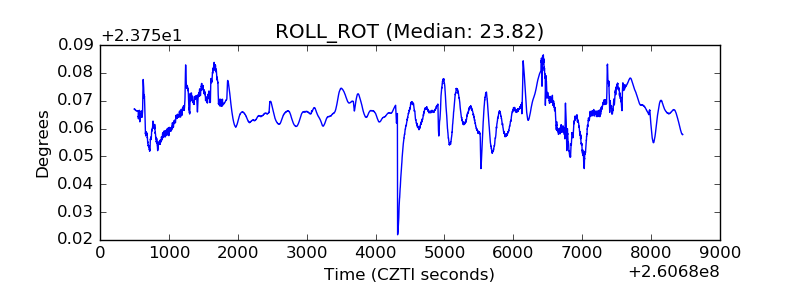 |
| _Roll_DEC | 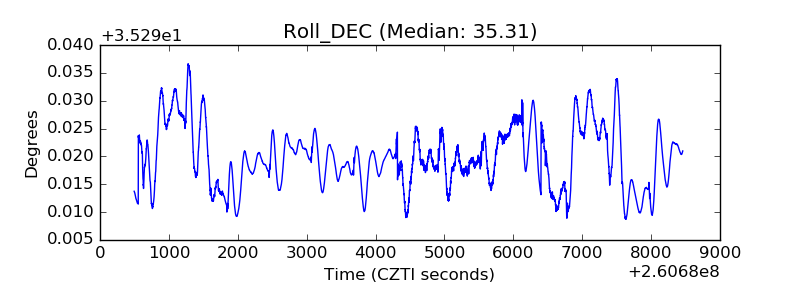 |
| _Roll_RA | 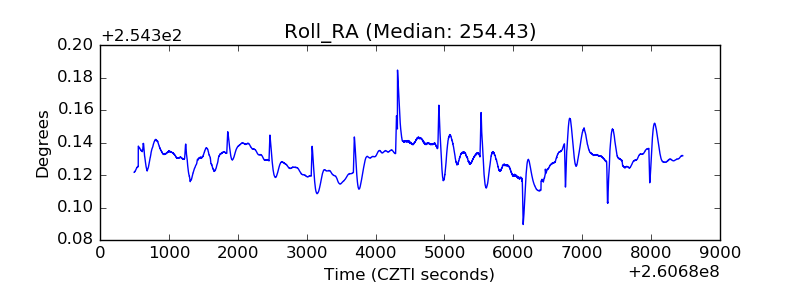 |
| Veto Counter | 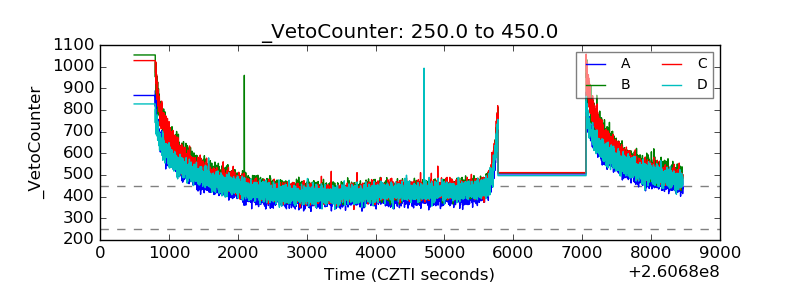 |