| Param | Original file | Final file |
|---|---|---|
| Filename | modeM0/AS1G08_038T01_9000002018_13634cztM0_level2.evt | modeM0/AS1G08_038T01_9000002018_13634cztM0_level2_quad_clean.evt |
| Size (bytes) | 644,218,560 | 83,914,560 |
| Size | 614.4 MB | 80.0 MB |
| Events in quadrant A | 2,918,924 | 541,879 |
| Events in quadrant B | 3,222,660 | 552,541 |
| Events in quadrant C | 2,941,354 | 584,122 |
| Events in quadrant D | 10,042,404 | 464,714 |
| Mode M0 | |||
|---|---|---|---|
| Quadrant | BADHDUFLAG | Total packets | Discarded packets |
| A | 0 | 11994 | 2 |
| B | 0 | 12989 | 1 |
| C | 0 | 11935 | 1 |
| D | 0 | 33846 | 1 |
| Mode SS | |||
|---|---|---|---|
| Quadrant | BADHDUFLAG | Total packets | Discarded packets |
| A | 0 | 114 | 0 |
| B | 0 | 114 | 0 |
| C | 0 | 114 | 0 |
| D | 0 | 114 | 0 |
| Mode M9 | |||
|---|---|---|---|
| Quadrant | BADHDUFLAG | Total packets | Discarded packets |
| A | 0 | 14 | 0 |
| B | 0 | 14 | 0 |
| C | 0 | 14 | 0 |
| D | 0 | 14 | 0 |
| Quadrant | Total seconds | Saturated seconds | Saturation percentage |
|---|---|---|---|
| A | 5688 | 40 | 0.703235% |
| B | 5688 | 55 | 0.966948% |
| C | 5688 | 14 | 0.246132% |
| D | 5688 | 2705 | 47.556259% |
Noise dominated data is calculated using 1-second bins in cleaned event files. If a bin has >2000 counts, and if more than 50% of those come from <1% of pixels, then it is considered to be noise-dominated and hence unusable.
| Quadrant | # 1 sec bins | Bins with >0 counts | Bins with >2000 counts | High rate bins dominated by noise | Noise dominated (total time) | Noise dominated (detector-on time) | Marked lightcurve |
|---|---|---|---|---|---|---|---|
| A | 7029 | 5690 | 11 | 11 | 0.16% | 0.19% | 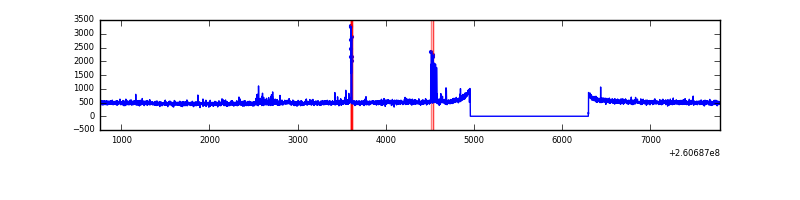 |
| B | 7029 | 5690 | 9 | 9 | 0.13% | 0.16% | 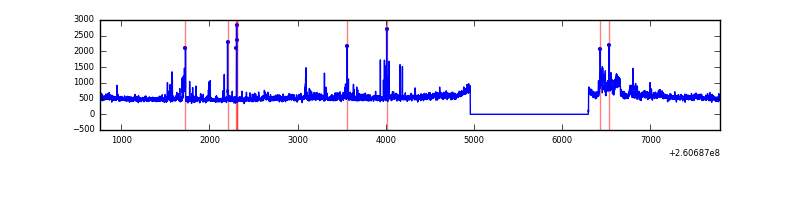 |
| C | 7029 | 5690 | 0 | 0 | 0.00% | 0.00% | 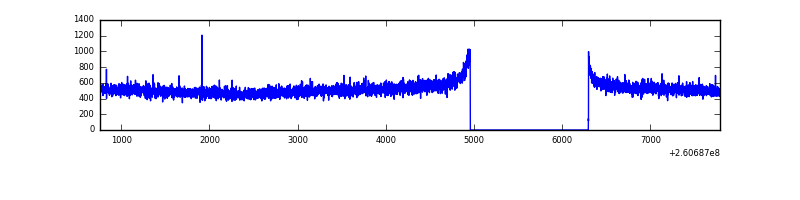 |
| D | 7029 | 5690 | 2519 | 2519 | 35.84% | 44.27% | 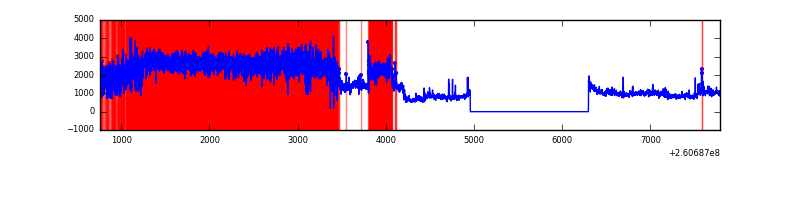 |
Top three noisy pixels from each quadrant. If the there are fewer than three noisy pixels in the level2.evt file, extra rows are filled as -1
| Pixel properties | Quadrant properties | ||||||
|---|---|---|---|---|---|---|---|
| Quadrant | DetID | PixID | Counts | Sigma | Mean | Median | Sigma |
| A | 15 | 69 | 67183 | 451.11 | 732 | 719 | 147.3 |
| A | 1 | 162 | 22225 | 145.97 | 732 | 719 | 147.3 |
| A | 1 | 178 | 7034 | 42.86 | 732 | 719 | 147.3 |
| B | 3 | 64 | 200522 | 1475.32 | 725 | 710 | 135.4 |
| B | 0 | 214 | 53170 | 387.34 | 725 | 710 | 135.4 |
| B | 0 | 229 | 46014 | 334.5 | 725 | 710 | 135.4 |
| C | 3 | 233 | 162867 | 997.9 | 711 | 718 | 162.5 |
| C | 13 | 61 | 5120 | 27.09 | 711 | 718 | 162.5 |
| C | 0 | 207 | 4146 | 21.1 | 711 | 718 | 162.5 |
| D | 5 | 222 | 6034937 | 46726.62 | 540 | 527 | 129.1 |
| D | 13 | 122 | 1712835 | 13259.02 | 540 | 527 | 129.1 |
| D | 8 | 195 | 133175 | 1027.14 | 540 | 527 | 129.1 |
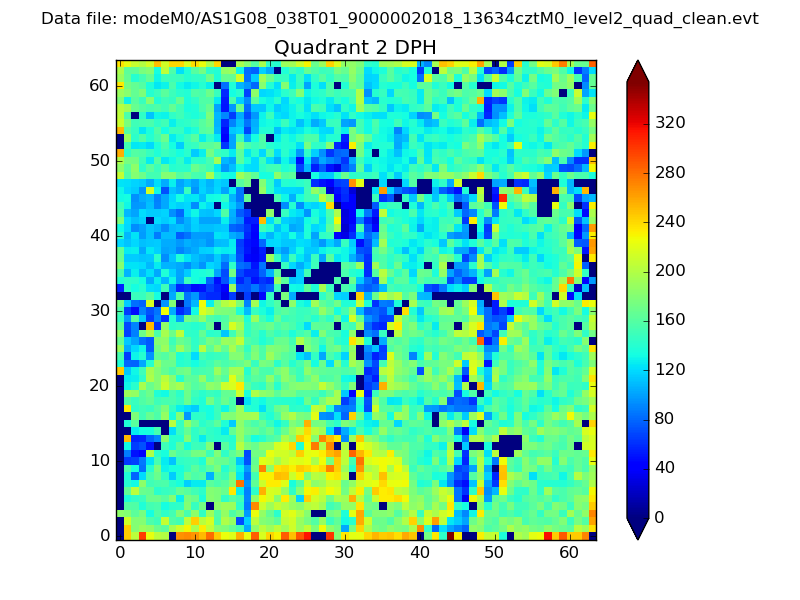
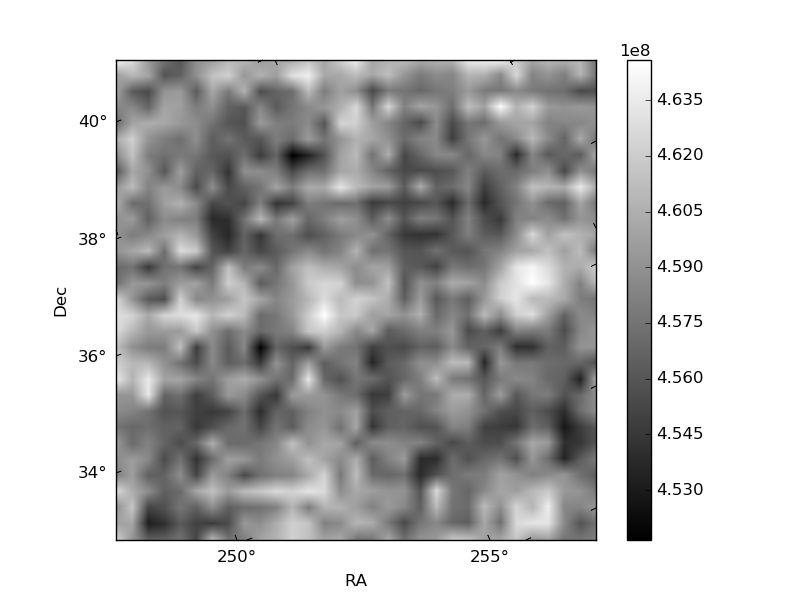
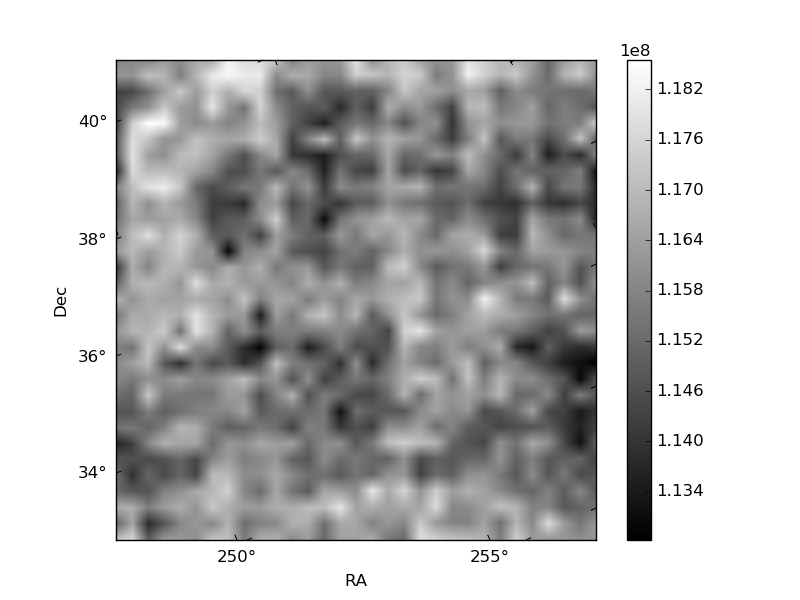
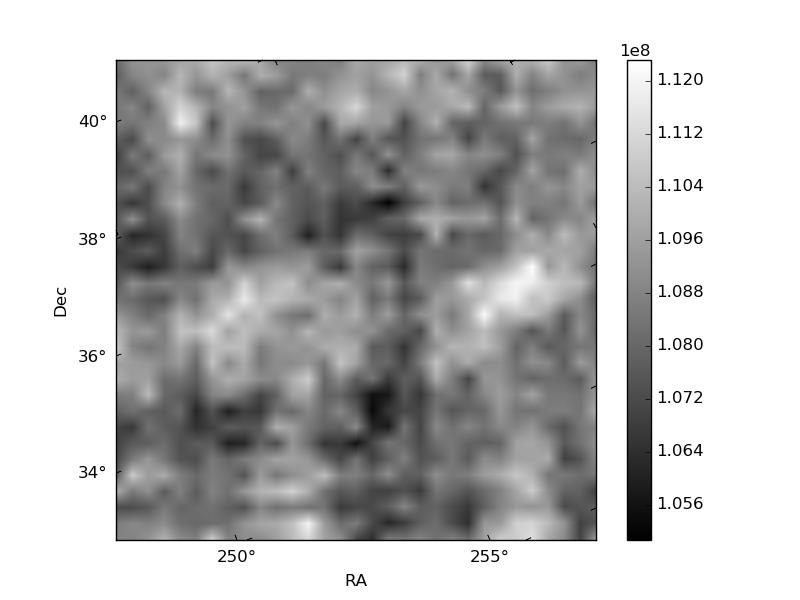
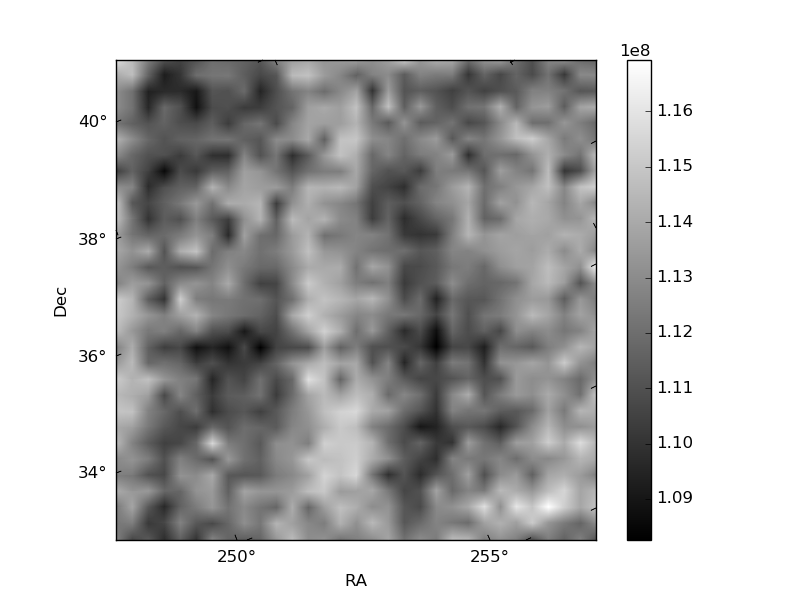
Histogram calculated using DETX and DETY for each event in the final _common_clean file
| Quadrant A | 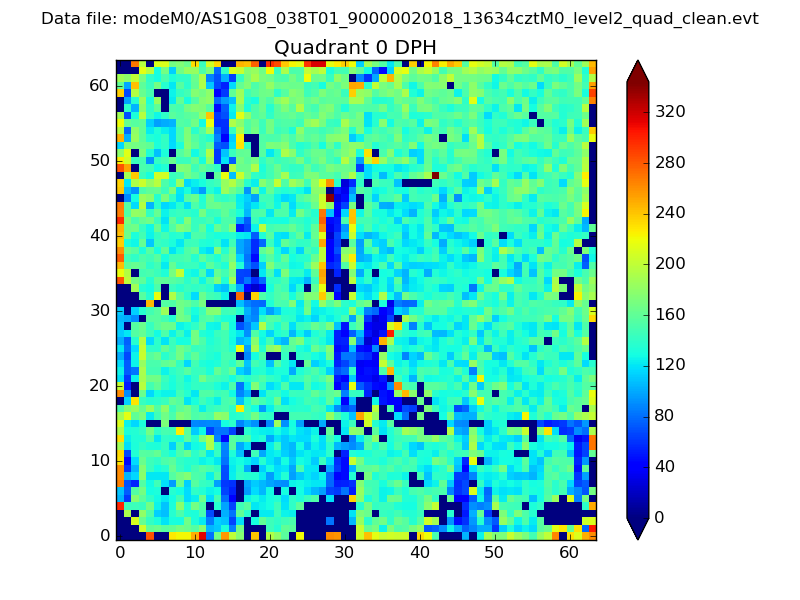 |
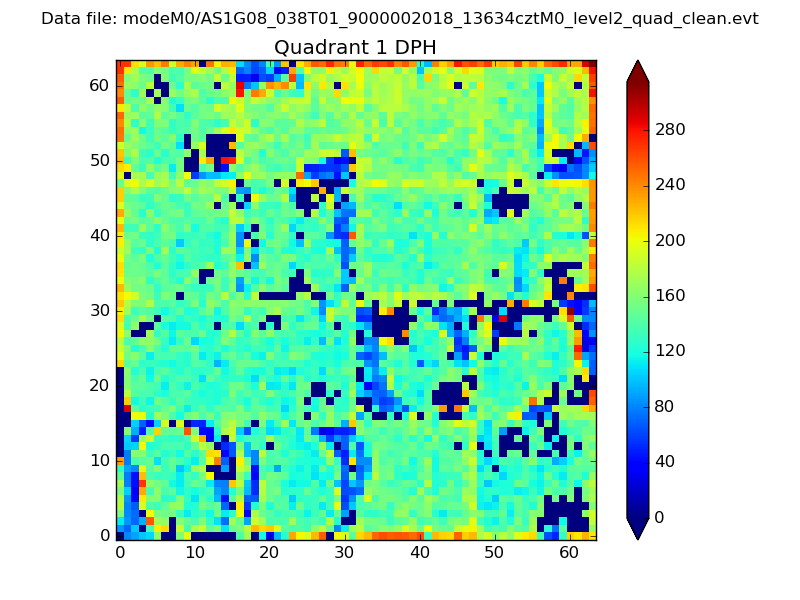 |
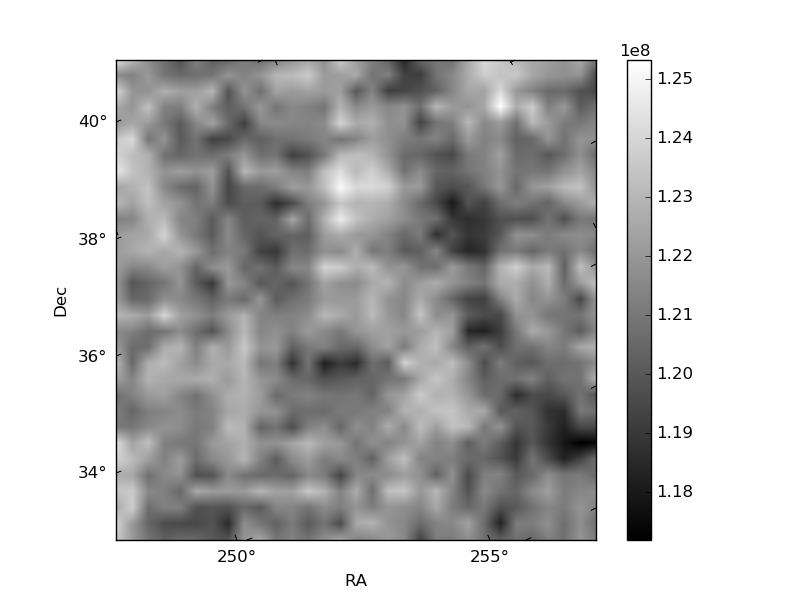
Quadrant B |
|---|---|---|---|
| Quadrant D | 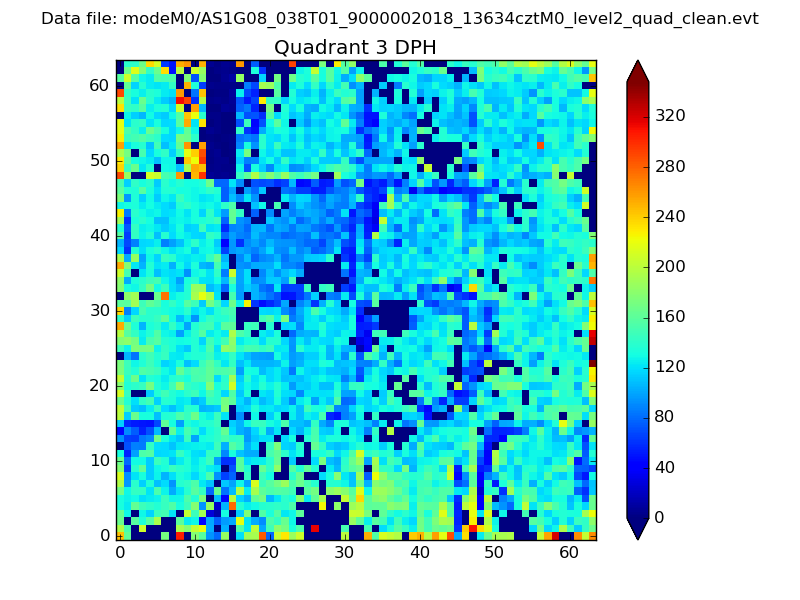 |
 |
Quadrant C |
| Plot type | Count rate plots | Images |
|---|---|---|
| Comparison with Poisson distribution Blue bars denote a histogram of data divided into 1 sec bins. Red curve is a Poisson curve with rate = median count rate of data. |
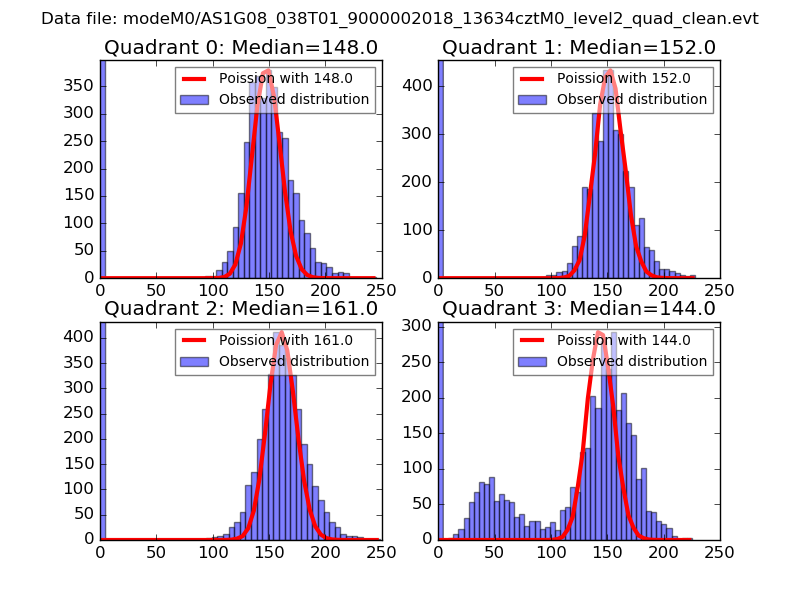 |
 |
| Quadrant-wise count rates Data is divided into 100 sec bins |
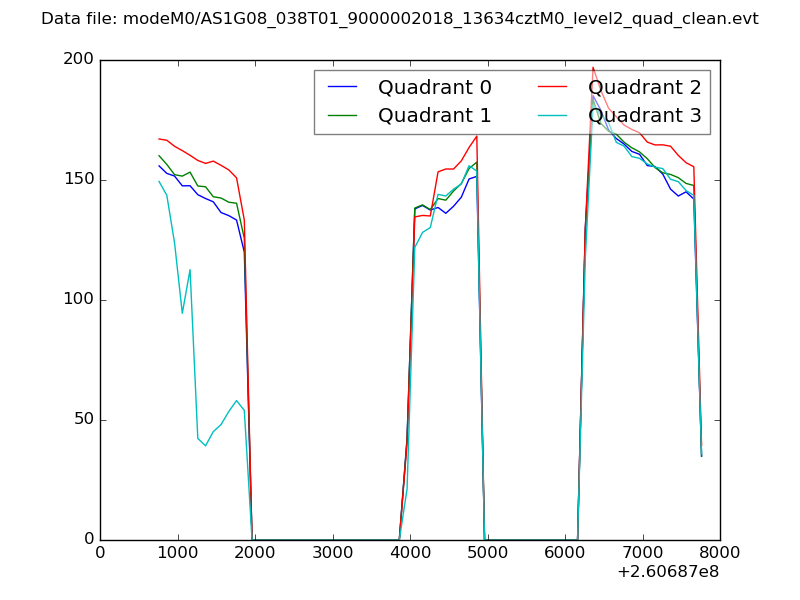 |
|
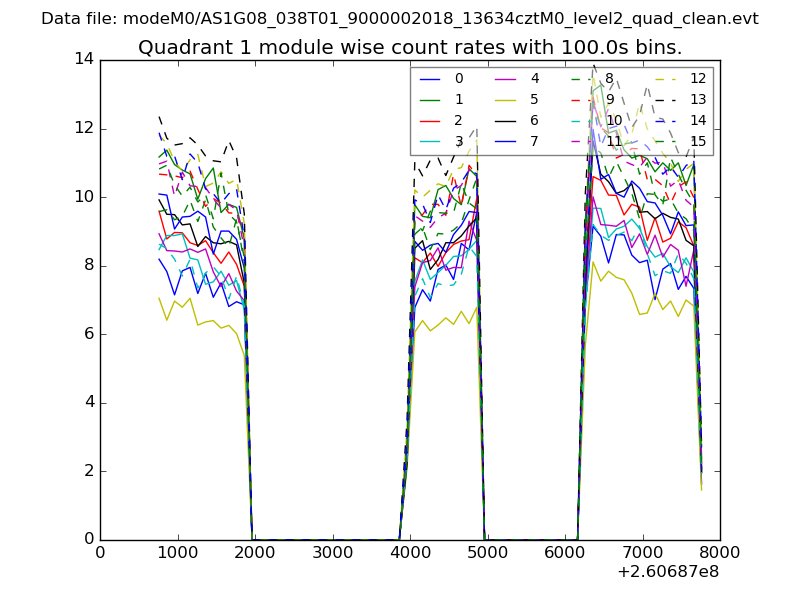
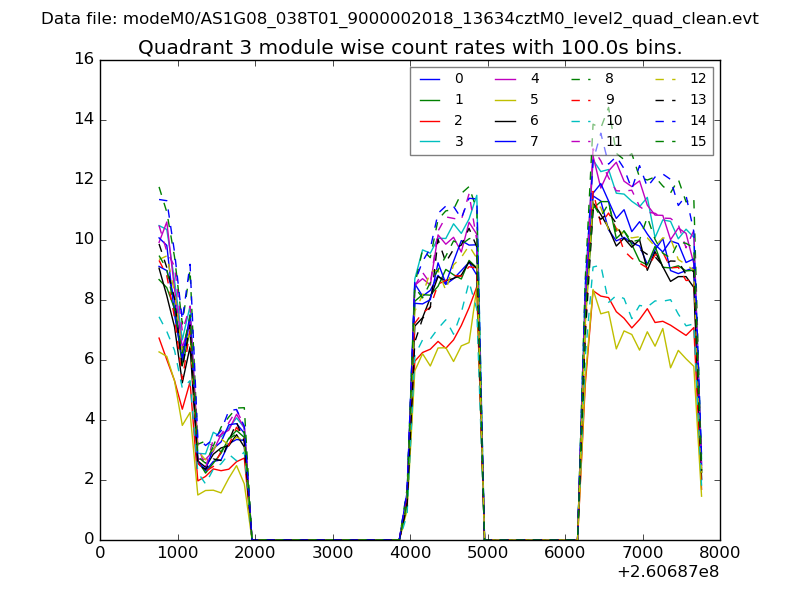
| Module-wise count rates for Quadrant A Data is divided into 100 sec bins |
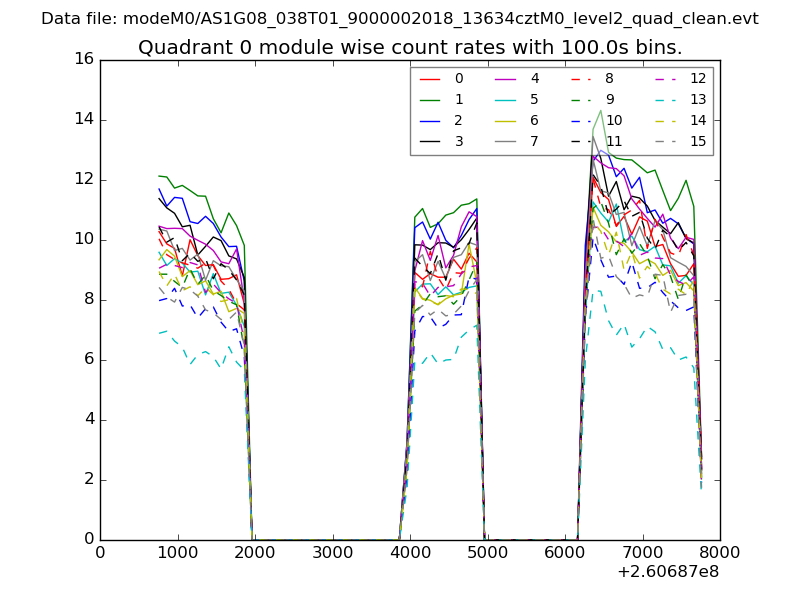 |
 |
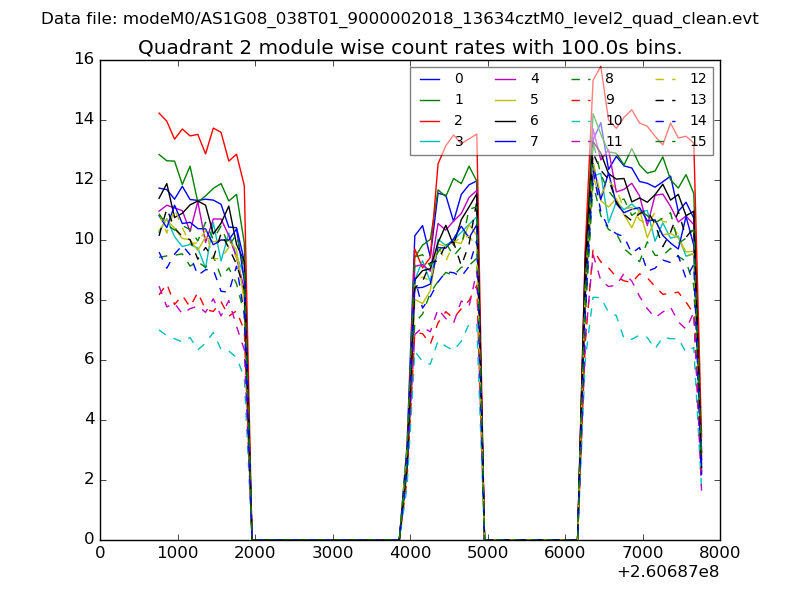
| Module-wise count rates for Quadrant B Data is divided into 100 sec bins |
 |
 |
| Module-wise count rates for Quadrant C Data is divided into 100 sec bins |
 |
 |
| Module-wise count rates for Quadrant D Data is divided into 100 sec bins |
 |
 |
| Parameter | Plot |
|---|---|
| CZT HV Monitor | 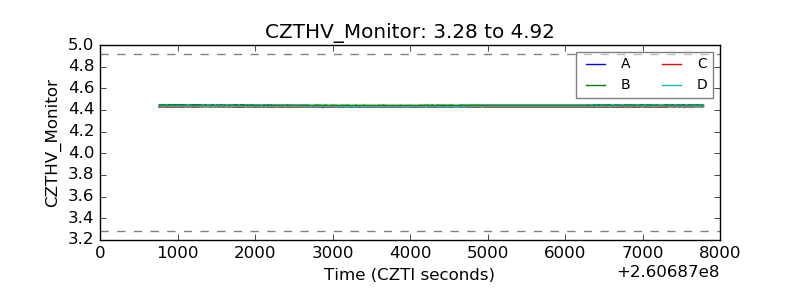 |
| D_VDD | 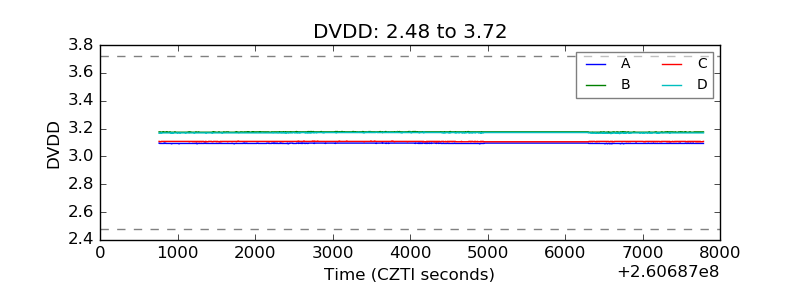 |
| Temperature 1 | 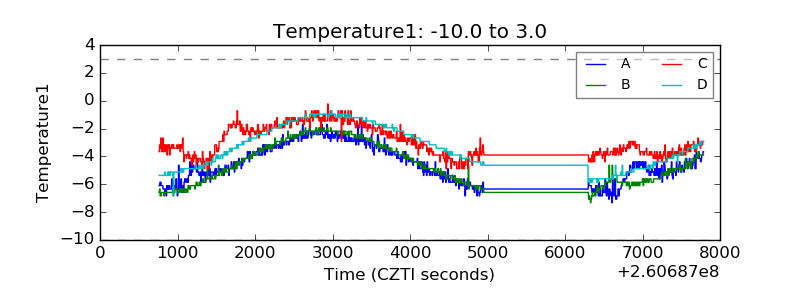 |
| Veto HV Monitor | 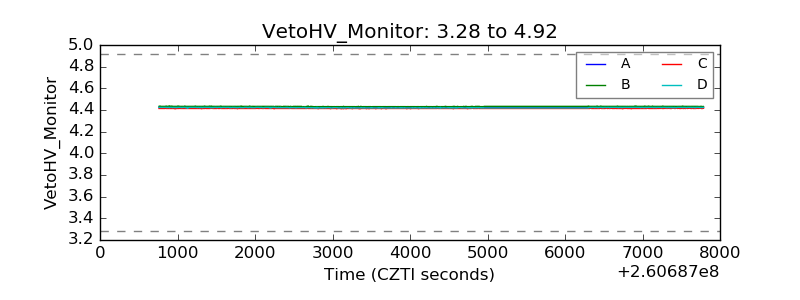 |
| Veto LLD | 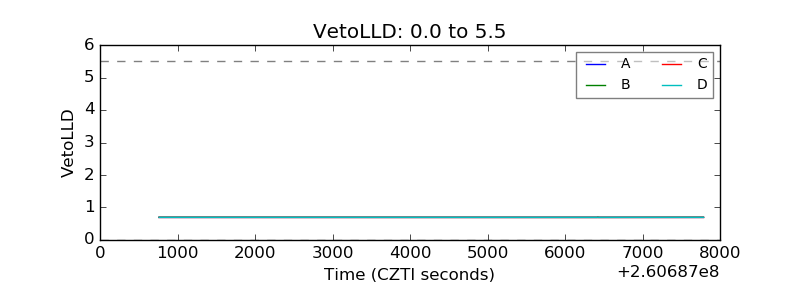 |
| Alpha Counter | 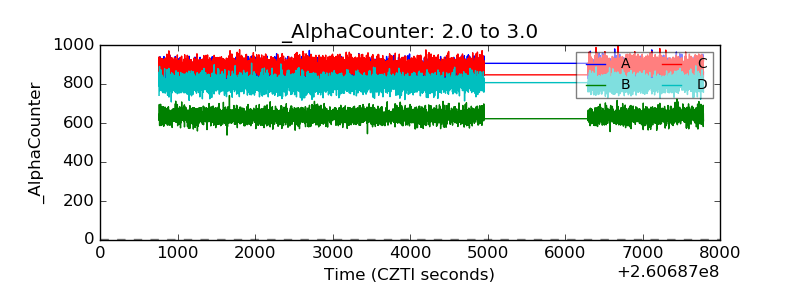 |
| _CPM_Rate |  |
| CZT Counter | 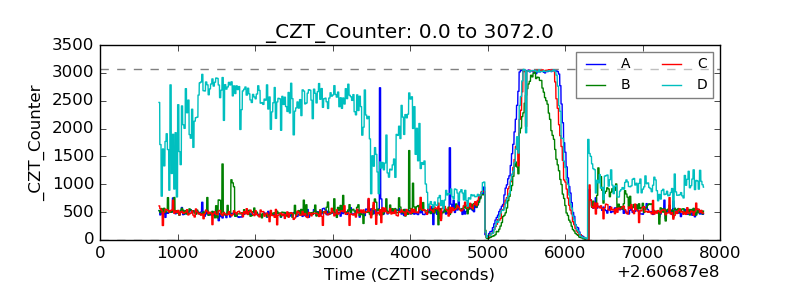 |
| +2.5 Volts monitor |  |
| +5 Volts monitor |  |
| _ROLL_ROT | 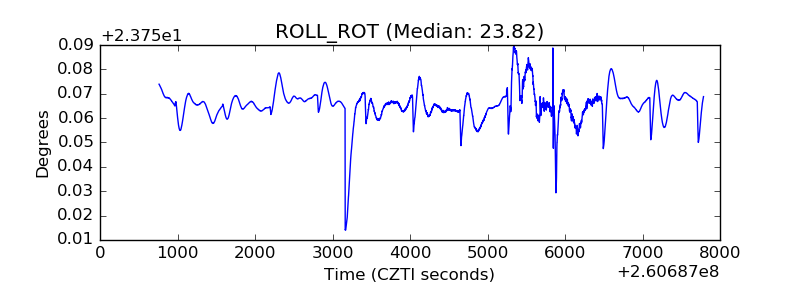 |
| _Roll_DEC | 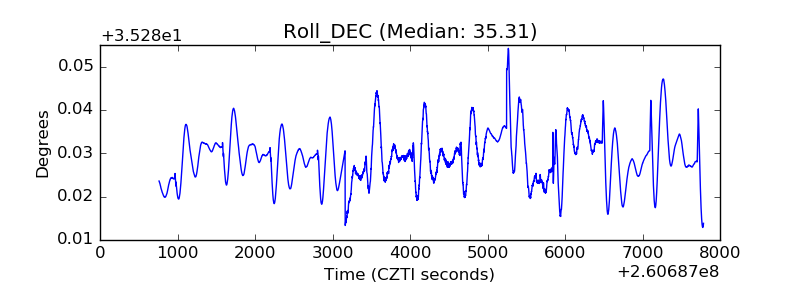 |
| _Roll_RA | 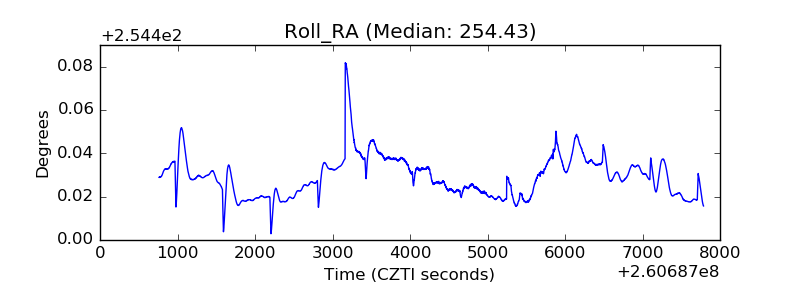 |
| Veto Counter | 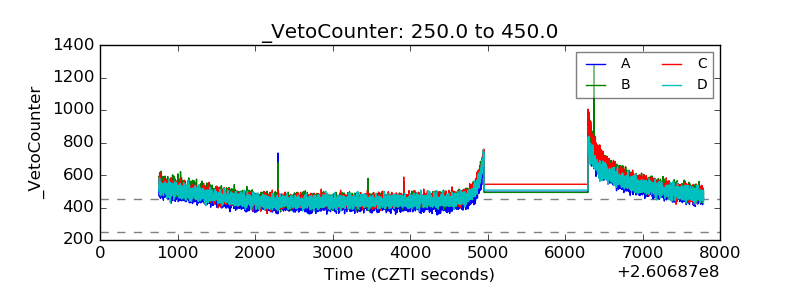 |