| Param | Original file | Final file |
|---|---|---|
| Filename | modeM0/AS1G08_038T01_9000002018_13635cztM0_level2.evt | modeM0/AS1G08_038T01_9000002018_13635cztM0_level2_quad_clean.evt |
| Size (bytes) | 438,940,800 | 76,959,360 |
| Size | 418.6 MB | 73.4 MB |
| Events in quadrant A | 2,780,366 | 471,847 |
| Events in quadrant B | 2,949,208 | 481,761 |
| Events in quadrant C | 2,859,504 | 508,405 |
| Events in quadrant D | 4,329,362 | 481,972 |
| Mode M0 | |||
|---|---|---|---|
| Quadrant | BADHDUFLAG | Total packets | Discarded packets |
| A | 0 | 11443 | 3 |
| B | 0 | 11897 | 2 |
| C | 0 | 11543 | 2 |
| D | 0 | 16891 | 2 |
| Mode SS | |||
|---|---|---|---|
| Quadrant | BADHDUFLAG | Total packets | Discarded packets |
| A | 0 | 112 | 0 |
| B | 0 | 112 | 0 |
| C | 0 | 112 | 0 |
| D | 0 | 112 | 0 |
| Mode M9 | |||
|---|---|---|---|
| Quadrant | BADHDUFLAG | Total packets | Discarded packets |
| A | 0 | 13 | 0 |
| B | 0 | 13 | 0 |
| C | 0 | 13 | 0 |
| D | 0 | 13 | 0 |
| Quadrant | Total seconds | Saturated seconds | Saturation percentage |
|---|---|---|---|
| A | 5524 | 37 | 0.669804% |
| B | 5524 | 51 | 0.923244% |
| C | 5524 | 32 | 0.579290% |
| D | 5524 | 54 | 0.977552% |
Noise dominated data is calculated using 1-second bins in cleaned event files. If a bin has >2000 counts, and if more than 50% of those come from <1% of pixels, then it is considered to be noise-dominated and hence unusable.
| Quadrant | # 1 sec bins | Bins with >0 counts | Bins with >2000 counts | High rate bins dominated by noise | Noise dominated (total time) | Noise dominated (detector-on time) | Marked lightcurve |
|---|---|---|---|---|---|---|---|
| A | 6865 | 5527 | 5 | 5 | 0.07% | 0.09% | 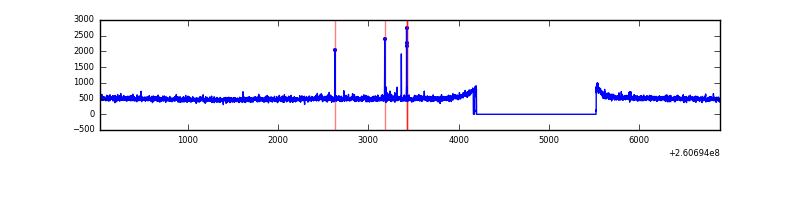 |
| B | 6865 | 5527 | 8 | 8 | 0.12% | 0.14% | 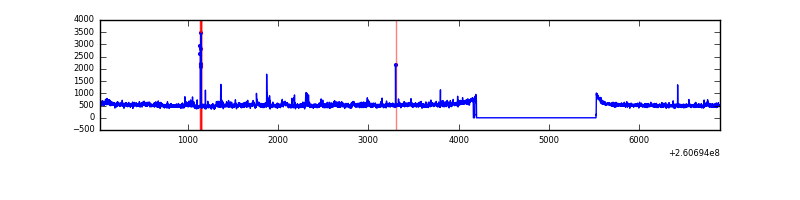 |
| C | 6865 | 5527 | 0 | 0 | 0.00% | 0.00% | 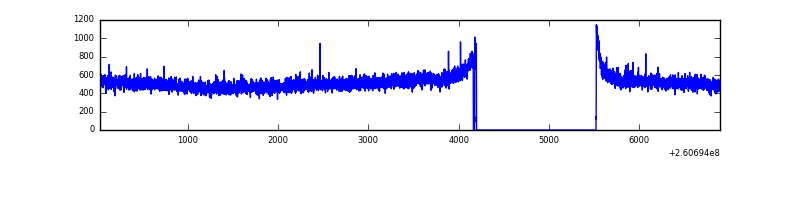 |
| D | 6865 | 5527 | 10 | 10 | 0.15% | 0.18% | 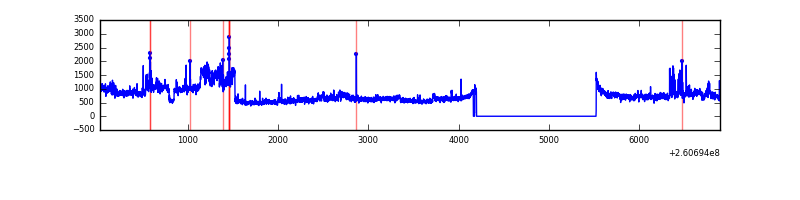 |
Top three noisy pixels from each quadrant. If the there are fewer than three noisy pixels in the level2.evt file, extra rows are filled as -1
| Pixel properties | Quadrant properties | ||||||
|---|---|---|---|---|---|---|---|
| Quadrant | DetID | PixID | Counts | Sigma | Mean | Median | Sigma |
| A | 9 | 143 | 16951 | 112.81 | 713 | 698 | 144.1 |
| A | 15 | 69 | 11186 | 72.8 | 713 | 698 | 144.1 |
| A | 1 | 162 | 7728 | 48.79 | 713 | 698 | 144.1 |
| B | 3 | 64 | 61269 | 456.23 | 705 | 689 | 132.8 |
| B | 0 | 229 | 58848 | 438.0 | 705 | 689 | 132.8 |
| B | 0 | 219 | 31939 | 235.35 | 705 | 689 | 132.8 |
| C | 3 | 233 | 156940 | 993.79 | 692 | 702 | 157.2 |
| C | 13 | 61 | 4848 | 26.37 | 692 | 702 | 157.2 |
| C | 0 | 207 | 3055 | 14.97 | 692 | 702 | 157.2 |
| D | 13 | 122 | 1499556 | 8969.52 | 695 | 678 | 167.1 |
| D | 8 | 195 | 96873 | 575.65 | 695 | 678 | 167.1 |
| D | 2 | 136 | 78114 | 463.39 | 695 | 678 | 167.1 |
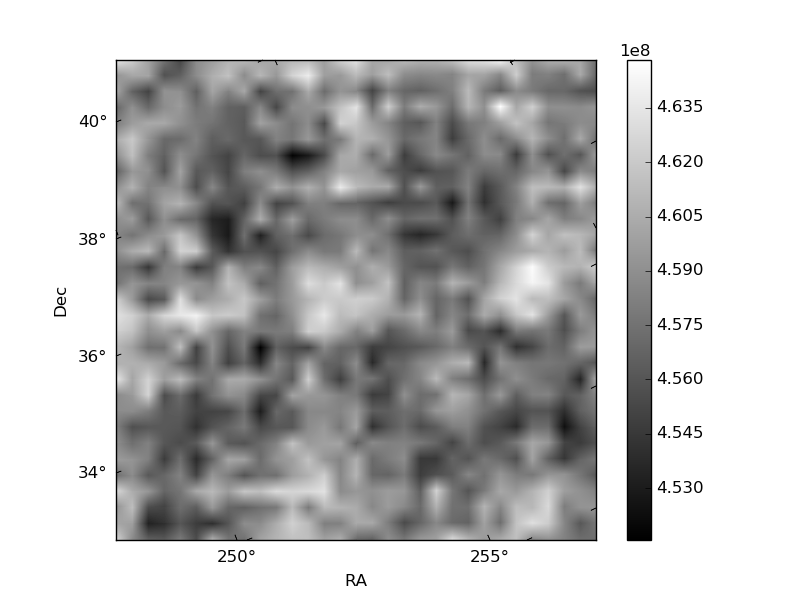
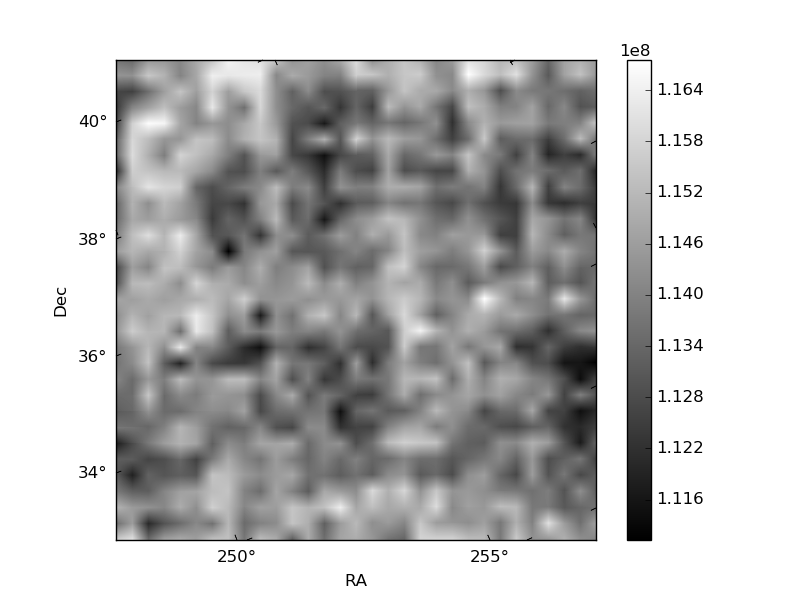
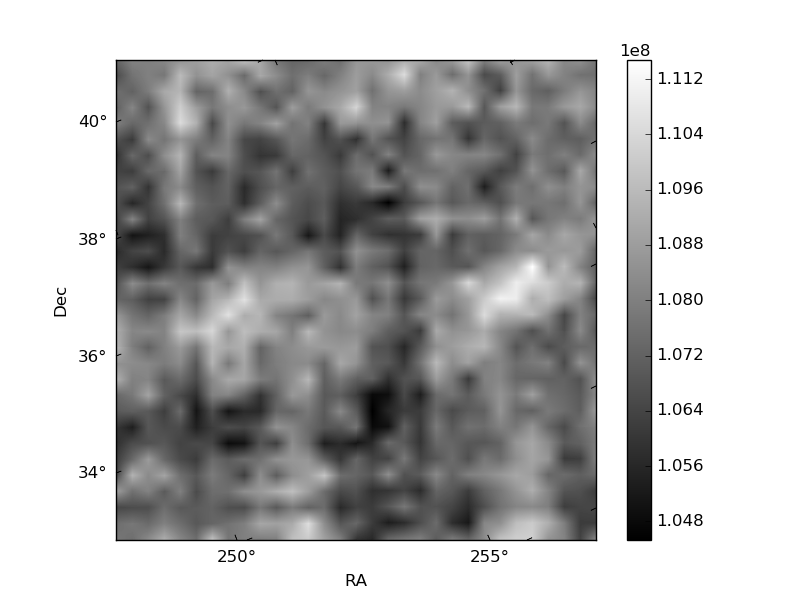
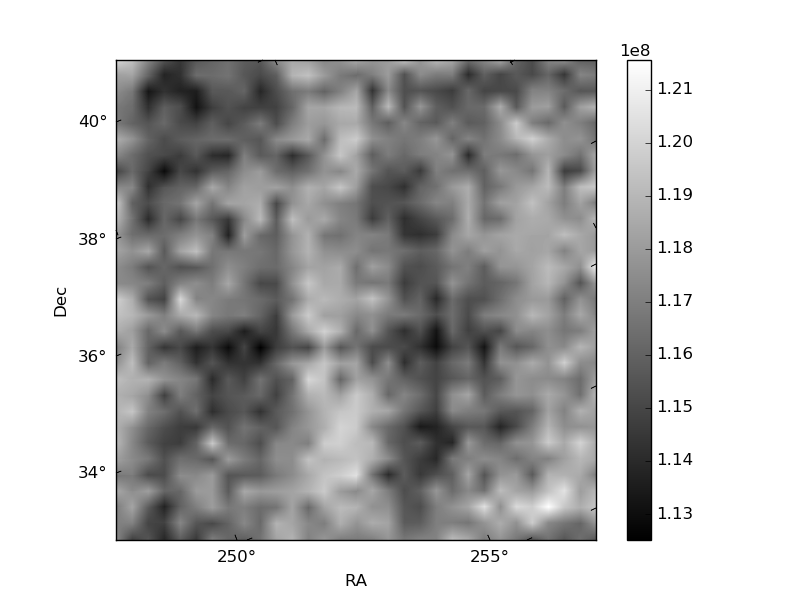
Histogram calculated using DETX and DETY for each event in the final _common_clean file
| Quadrant A | 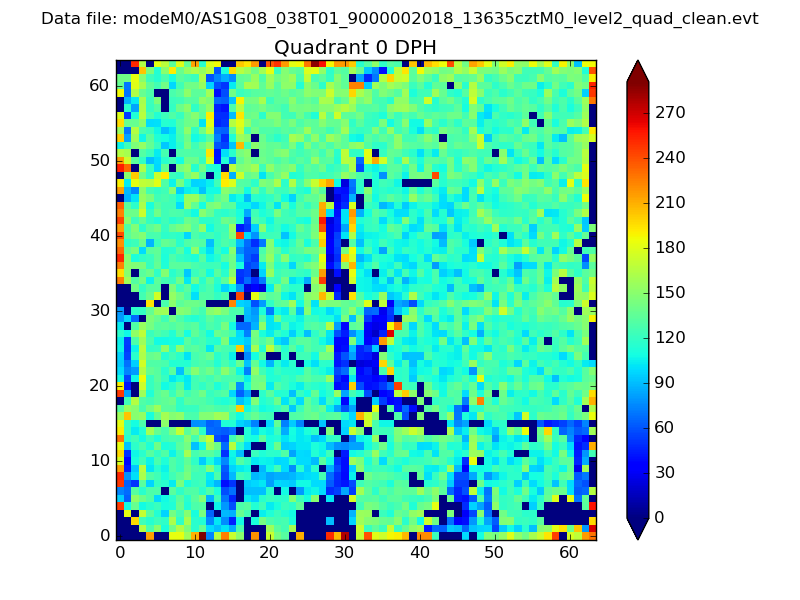 |
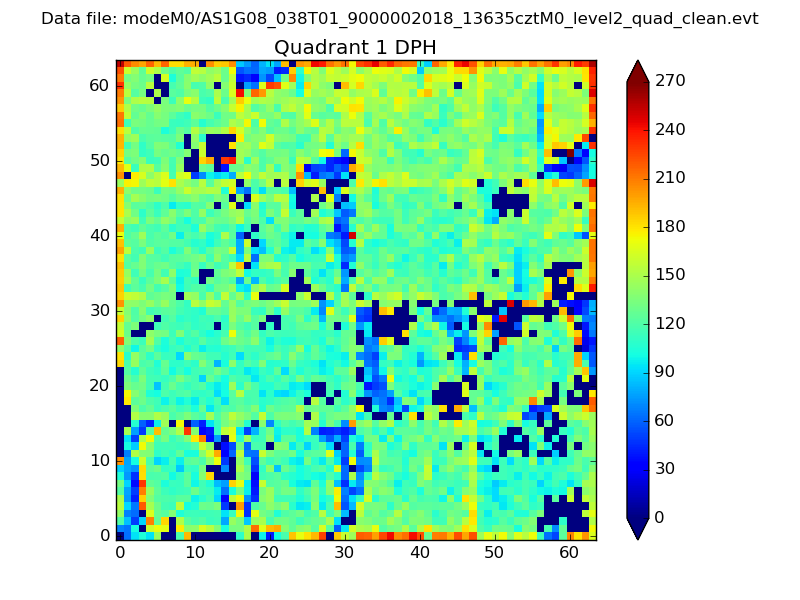 |
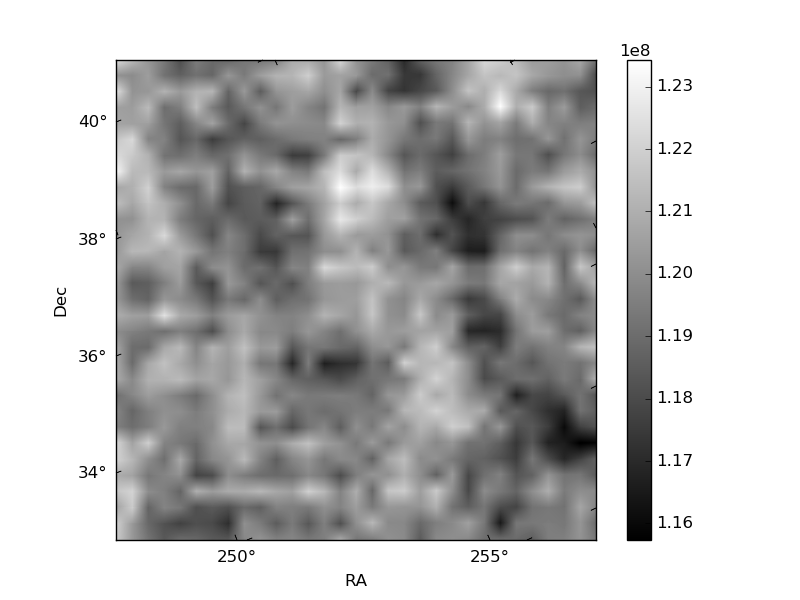
Quadrant B |
|---|---|---|---|
| Quadrant D | 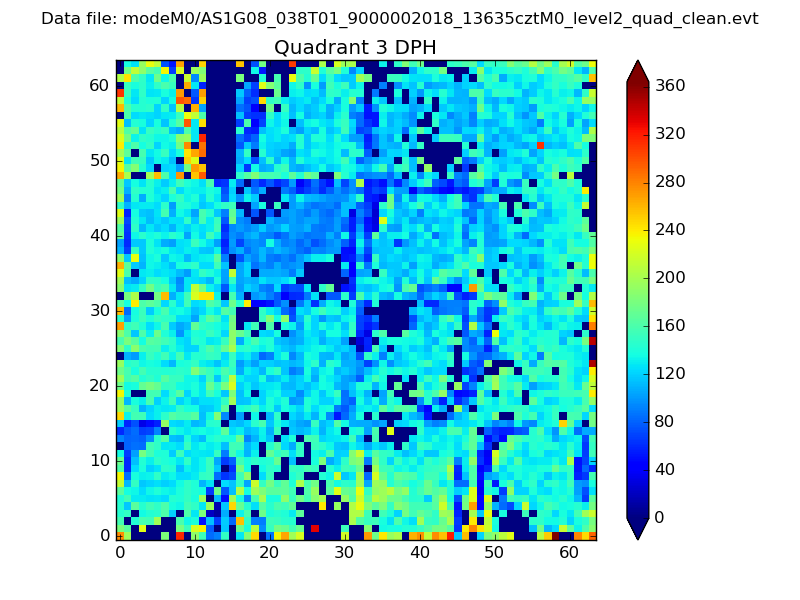 |
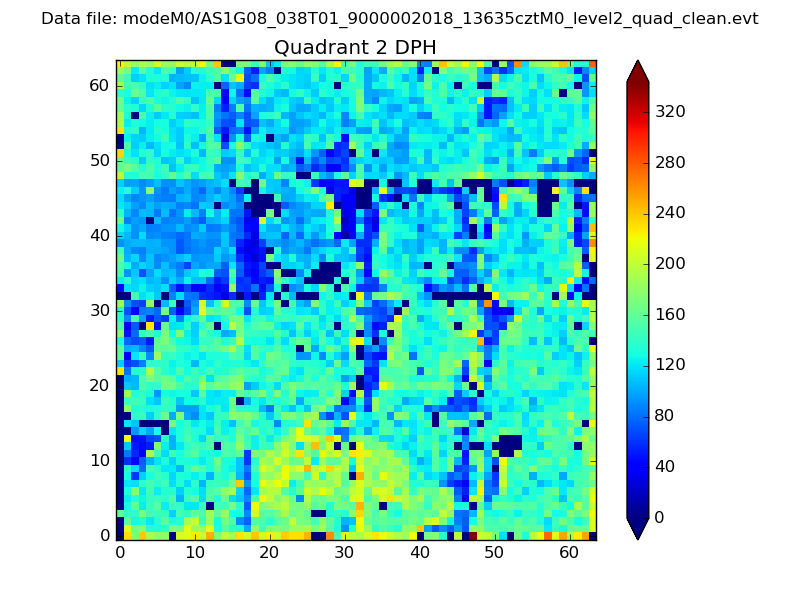 |
Quadrant C |
| Plot type | Count rate plots | Images |
|---|---|---|
| Comparison with Poisson distribution Blue bars denote a histogram of data divided into 1 sec bins. Red curve is a Poisson curve with rate = median count rate of data. |
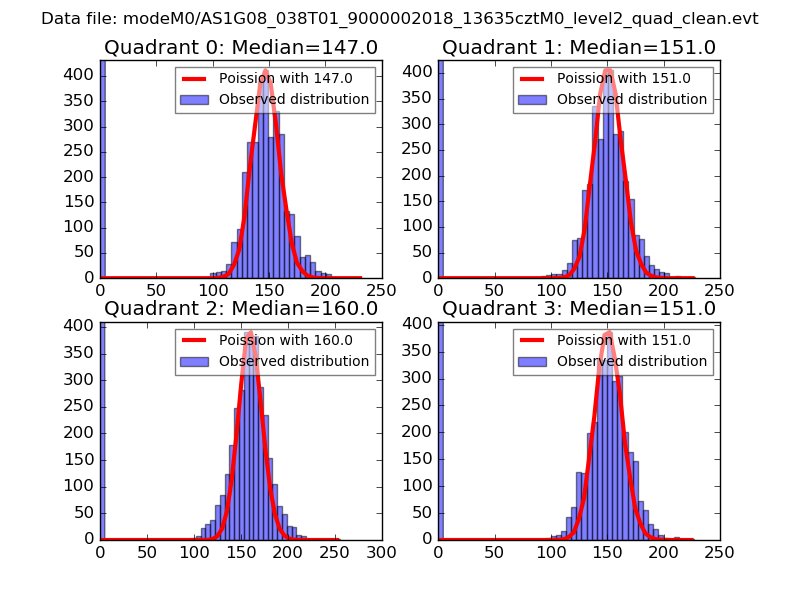 |
 |
| Quadrant-wise count rates Data is divided into 100 sec bins |
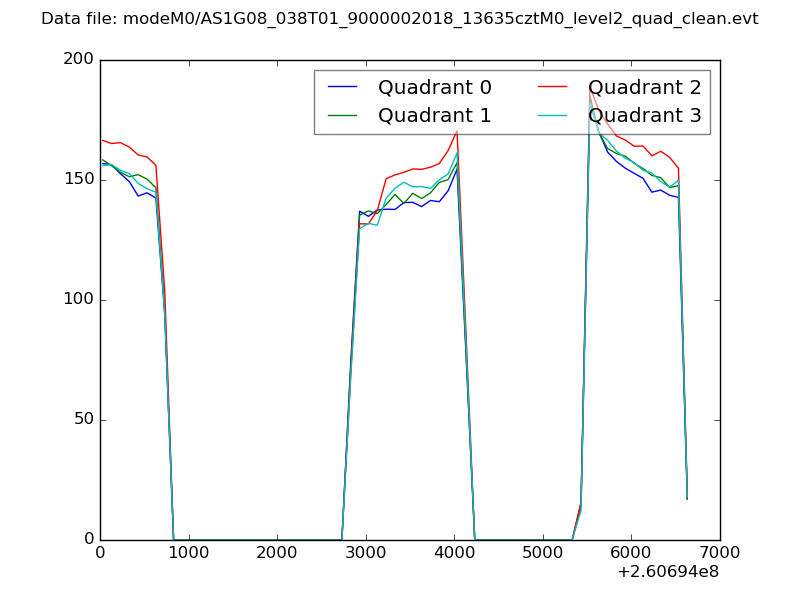 |
|
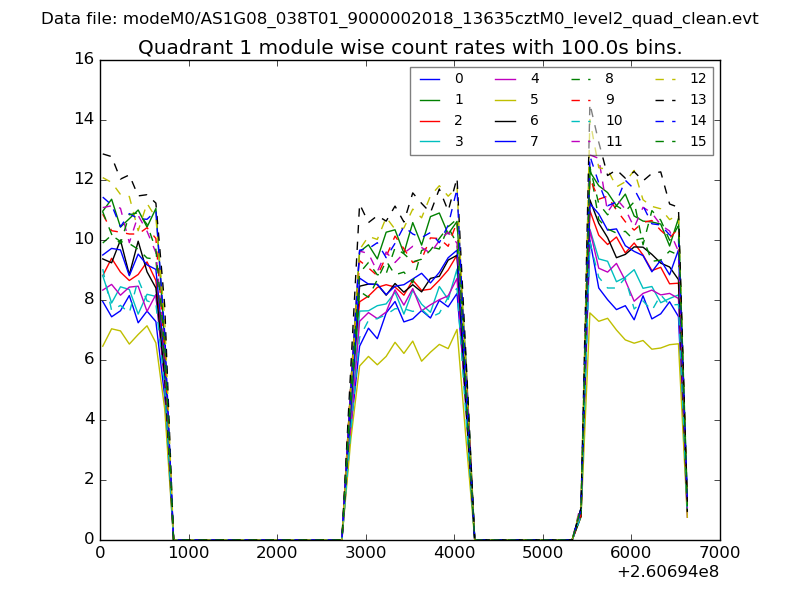
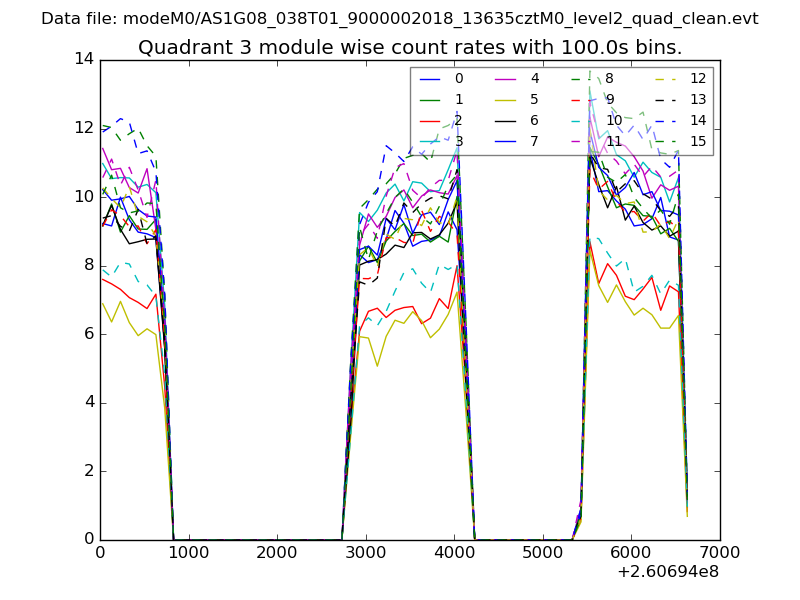
| Module-wise count rates for Quadrant A Data is divided into 100 sec bins |
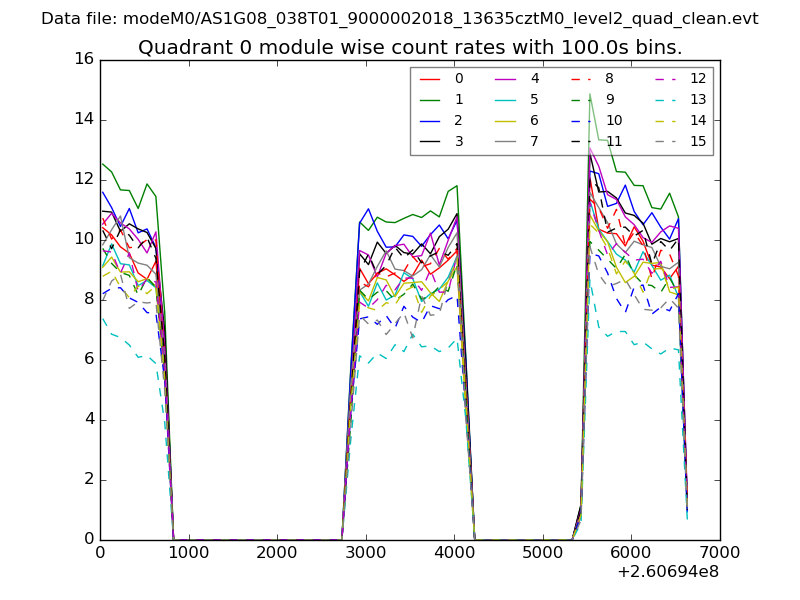 |
 |
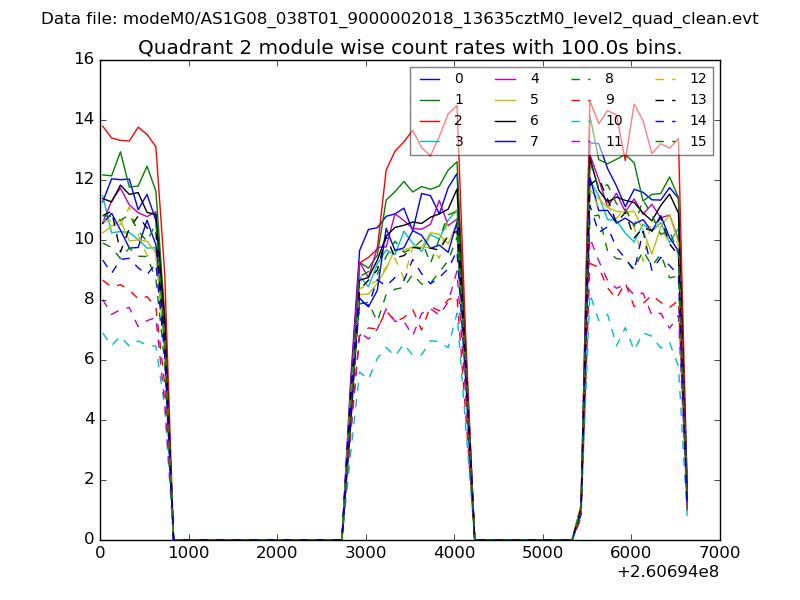
| Module-wise count rates for Quadrant B Data is divided into 100 sec bins |
 |
 |
| Module-wise count rates for Quadrant C Data is divided into 100 sec bins |
 |
 |
| Module-wise count rates for Quadrant D Data is divided into 100 sec bins |
 |
 |
| Parameter | Plot |
|---|---|
| CZT HV Monitor | 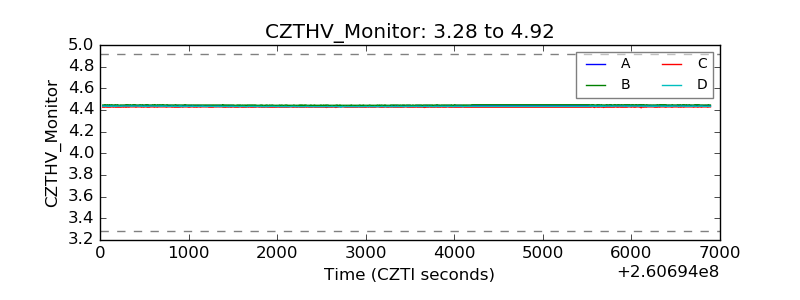 |
| D_VDD | 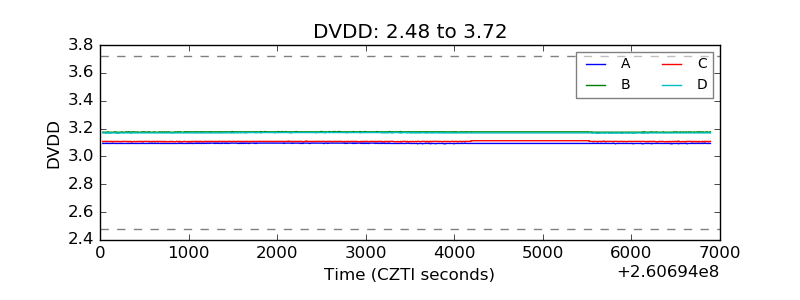 |
| Temperature 1 | 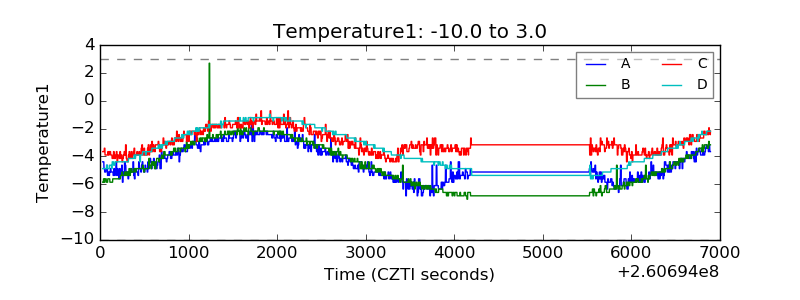 |
| Veto HV Monitor | 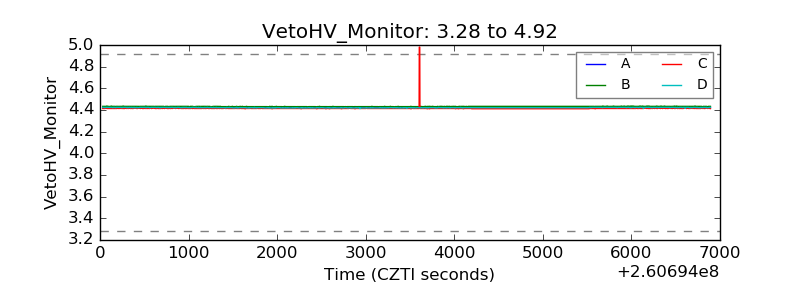 |
| Veto LLD | 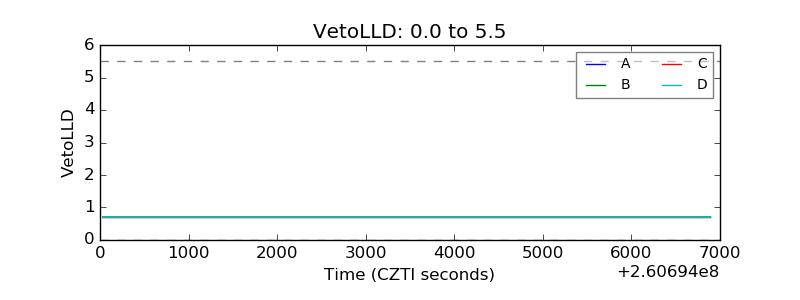 |
| Alpha Counter | 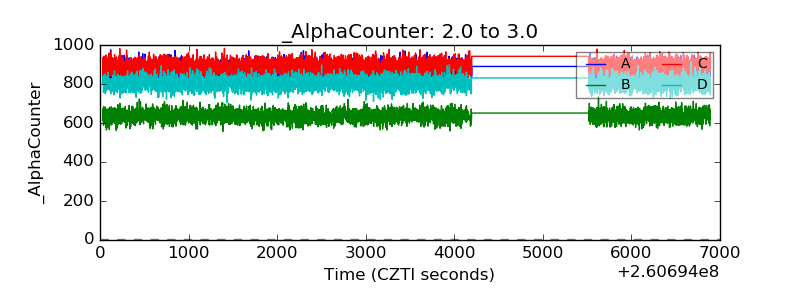 |
| _CPM_Rate | 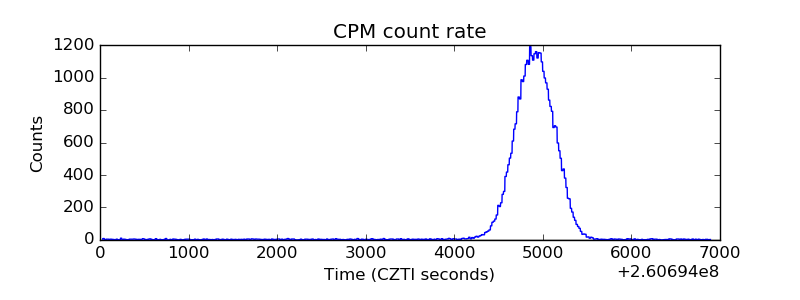 |
| CZT Counter | 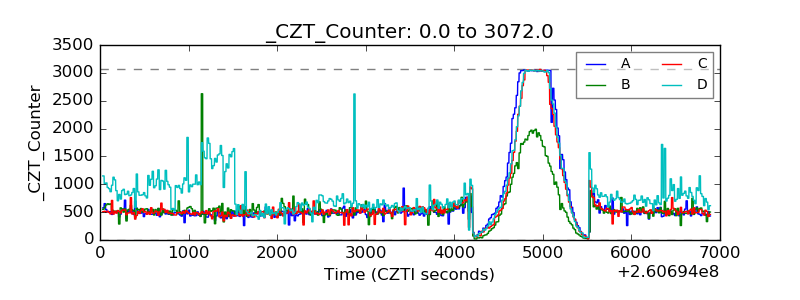 |
| +2.5 Volts monitor |  |
| +5 Volts monitor | 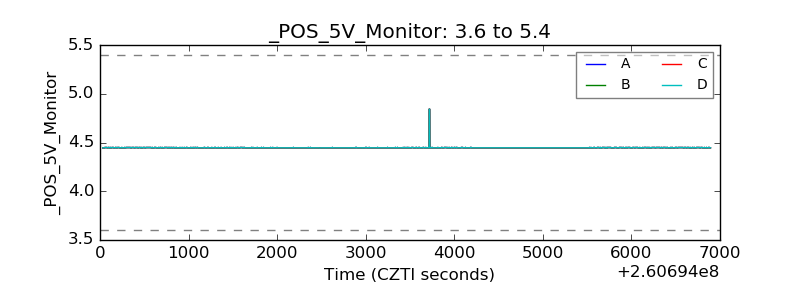 |
| _ROLL_ROT | 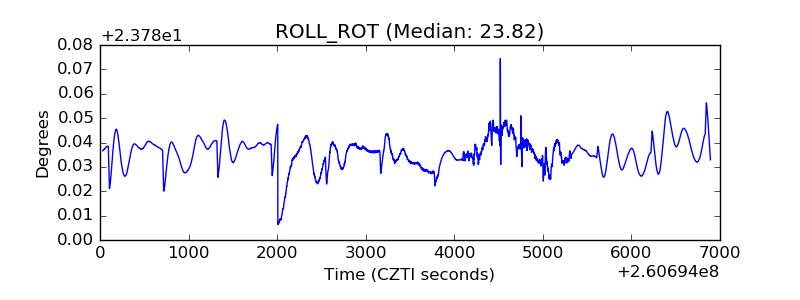 |
| _Roll_DEC | 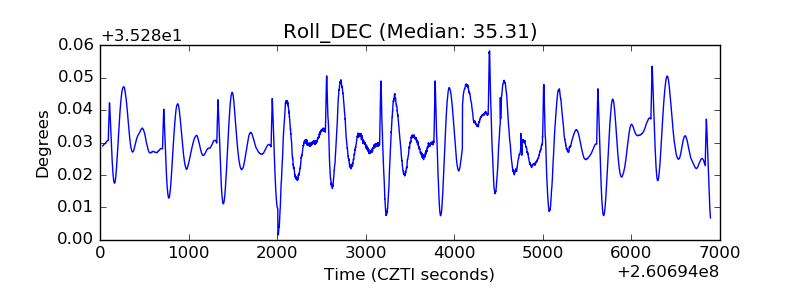 |
| _Roll_RA | 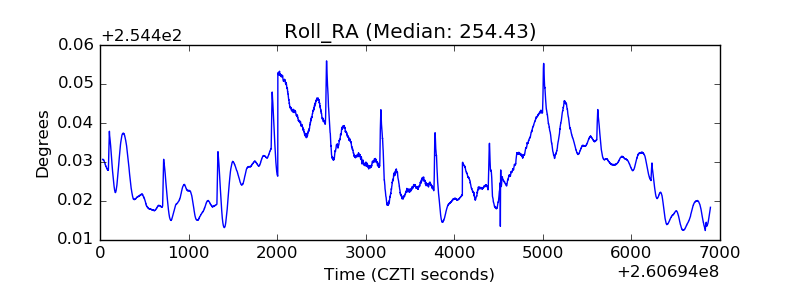 |
| Veto Counter | 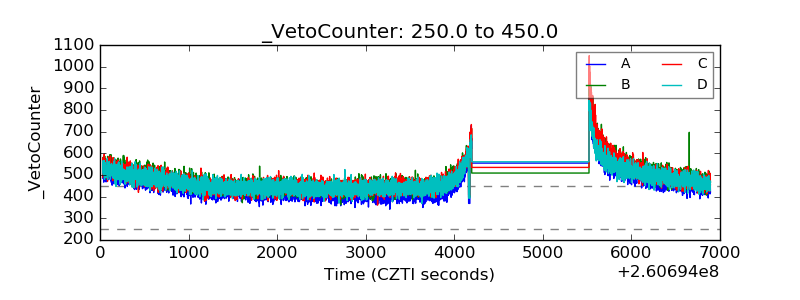 |