| Param | Original file | Final file |
|---|---|---|
| Filename | modeM0/AS1G08_038T01_9000002018_13636cztM0_level2.evt | modeM0/AS1G08_038T01_9000002018_13636cztM0_level2_quad_clean.evt |
| Size (bytes) | 540,673,920 | 76,224,960 |
| Size | 515.6 MB | 72.7 MB |
| Events in quadrant A | 3,000,892 | 455,887 |
| Events in quadrant B | 3,139,687 | 465,201 |
| Events in quadrant C | 3,130,790 | 499,073 |
| Events in quadrant D | 6,687,917 | 459,731 |
| Mode M0 | |||
|---|---|---|---|
| Quadrant | BADHDUFLAG | Total packets | Discarded packets |
| A | 0 | 12617 | 2 |
| B | 0 | 12861 | 1 |
| C | 0 | 12769 | 1 |
| D | 0 | 24209 | 1 |
| Mode SS | |||
|---|---|---|---|
| Quadrant | BADHDUFLAG | Total packets | Discarded packets |
| A | 0 | 124 | 0 |
| B | 0 | 124 | 0 |
| C | 0 | 124 | 0 |
| D | 0 | 124 | 0 |
| Mode M9 | |||
|---|---|---|---|
| Quadrant | BADHDUFLAG | Total packets | Discarded packets |
| A | 0 | 11 | 0 |
| B | 0 | 11 | 0 |
| C | 0 | 11 | 0 |
| D | 0 | 11 | 0 |
| Quadrant | Total seconds | Saturated seconds | Saturation percentage |
|---|---|---|---|
| A | 6135 | 111 | 1.809291% |
| B | 6135 | 120 | 1.955990% |
| C | 6135 | 86 | 1.401793% |
| D | 6135 | 253 | 4.123879% |
Noise dominated data is calculated using 1-second bins in cleaned event files. If a bin has >2000 counts, and if more than 50% of those come from <1% of pixels, then it is considered to be noise-dominated and hence unusable.
| Quadrant | # 1 sec bins | Bins with >0 counts | Bins with >2000 counts | High rate bins dominated by noise | Noise dominated (total time) | Noise dominated (detector-on time) | Marked lightcurve |
|---|---|---|---|---|---|---|---|
| A | 7271 | 6137 | 0 | 0 | 0.00% | 0.00% |  |
| B | 7271 | 6137 | 2 | 2 | 0.03% | 0.03% |  |
| C | 7271 | 6137 | 1 | 1 | 0.01% | 0.02% | 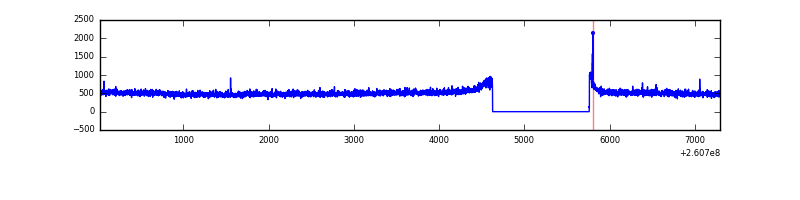 |
| D | 7271 | 6137 | 61 | 61 | 0.84% | 0.99% |  |
Top three noisy pixels from each quadrant. If the there are fewer than three noisy pixels in the level2.evt file, extra rows are filled as -1
| Pixel properties | Quadrant properties | ||||||
|---|---|---|---|---|---|---|---|
| Quadrant | DetID | PixID | Counts | Sigma | Mean | Median | Sigma |
| A | 0 | 226 | 7089 | 40.07 | 779 | 762 | 157.9 |
| A | 12 | 194 | 5987 | 33.09 | 779 | 762 | 157.9 |
| A | 1 | 162 | 5661 | 31.03 | 779 | 762 | 157.9 |
| B | 0 | 219 | 47883 | 324.48 | 771 | 752 | 145.3 |
| B | 0 | 229 | 20589 | 136.57 | 771 | 752 | 145.3 |
| B | 3 | 209 | 20369 | 135.06 | 771 | 752 | 145.3 |
| C | 3 | 233 | 159418 | 914.76 | 760 | 768 | 173.4 |
| C | 0 | 207 | 6935 | 35.56 | 760 | 768 | 173.4 |
| C | 13 | 61 | 5461 | 27.06 | 760 | 768 | 173.4 |
| D | 13 | 122 | 2972489 | 16726.07 | 752 | 733 | 177.7 |
| D | 5 | 222 | 513306 | 2884.94 | 752 | 733 | 177.7 |
| D | 8 | 195 | 223681 | 1254.83 | 752 | 733 | 177.7 |
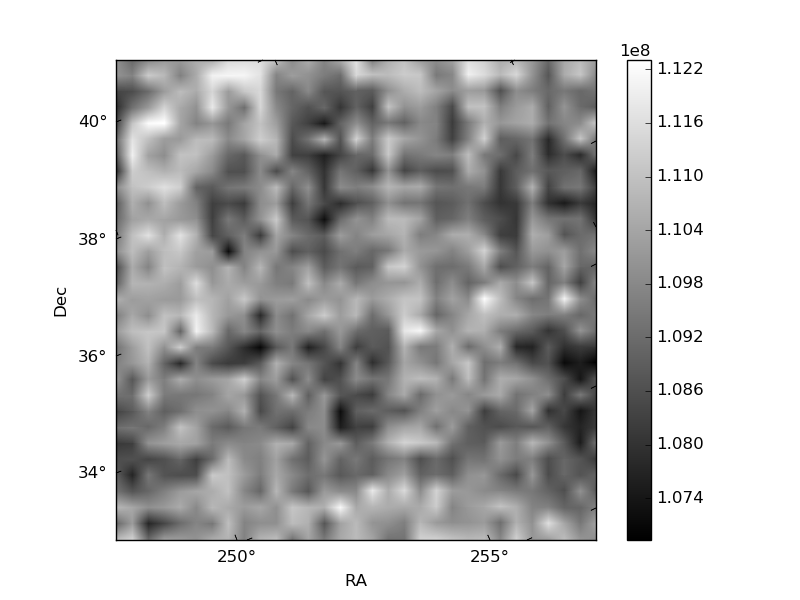
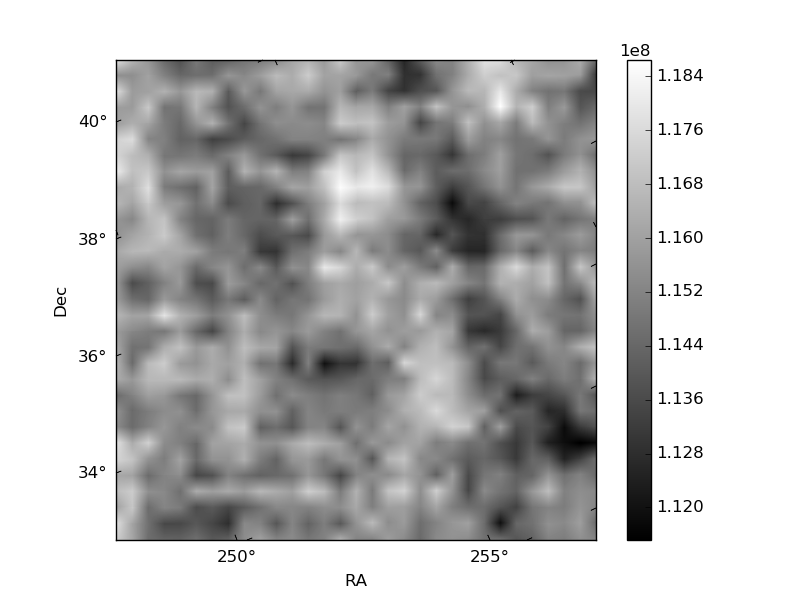
Histogram calculated using DETX and DETY for each event in the final _common_clean file
| Quadrant A | 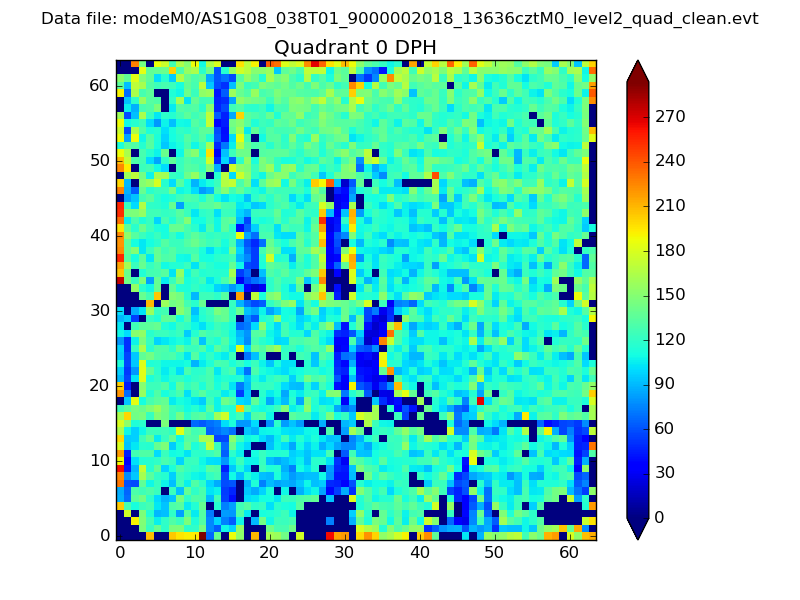 |
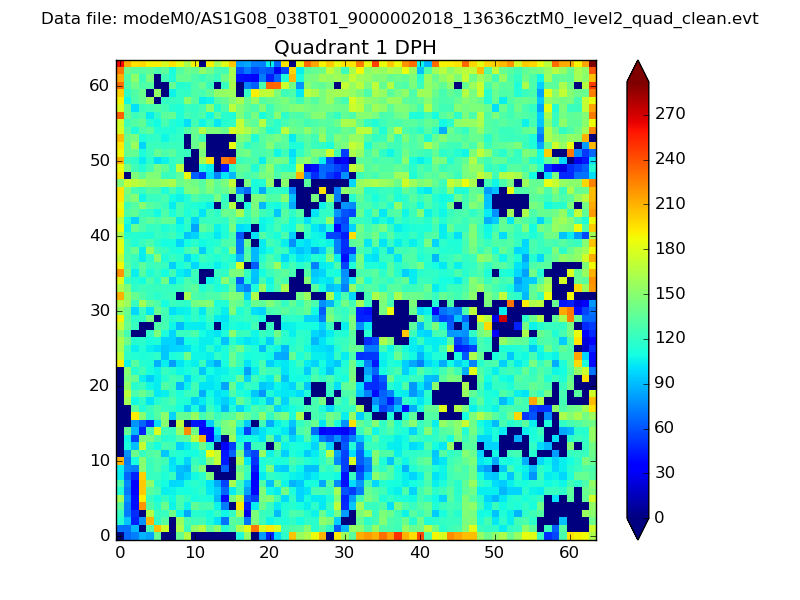 |
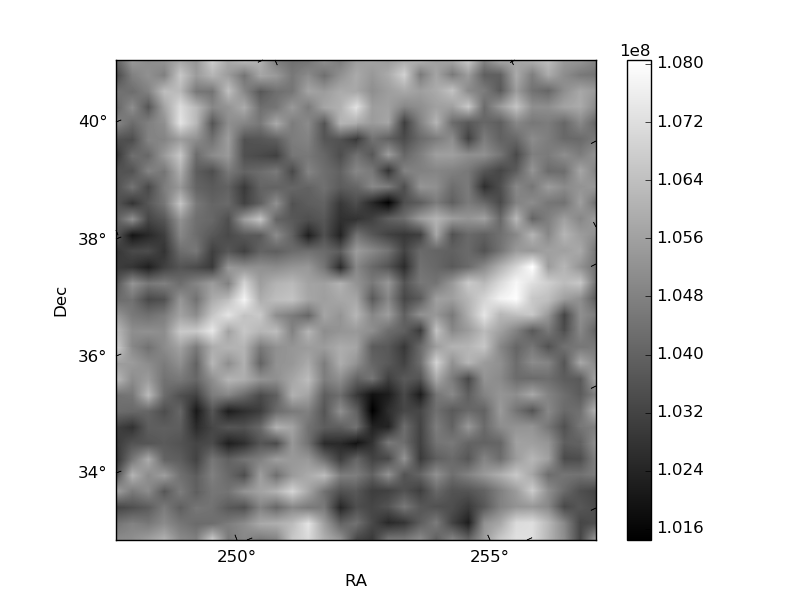
Quadrant B |
|---|---|---|---|
| Quadrant D | 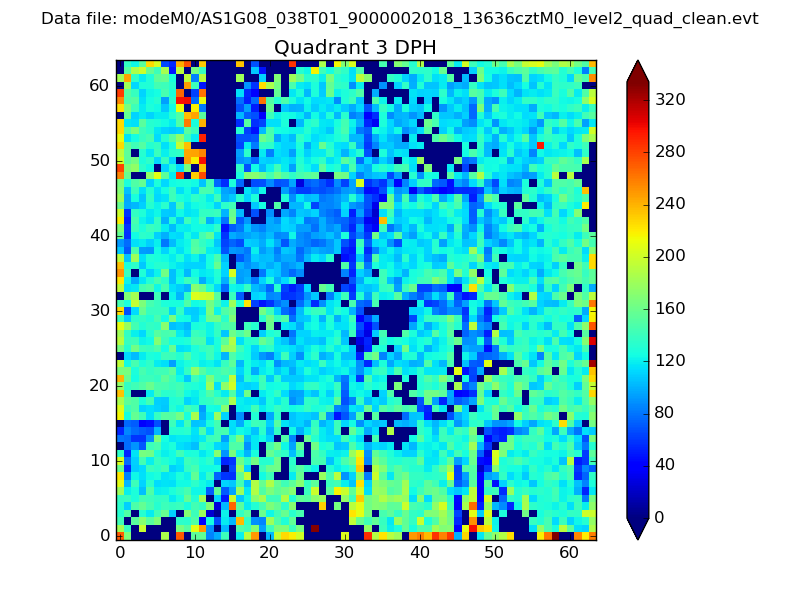 |
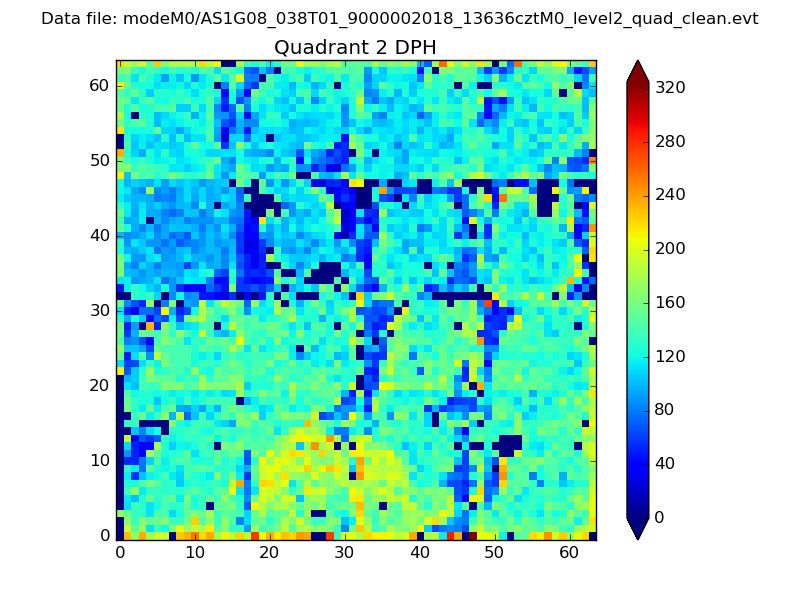 |
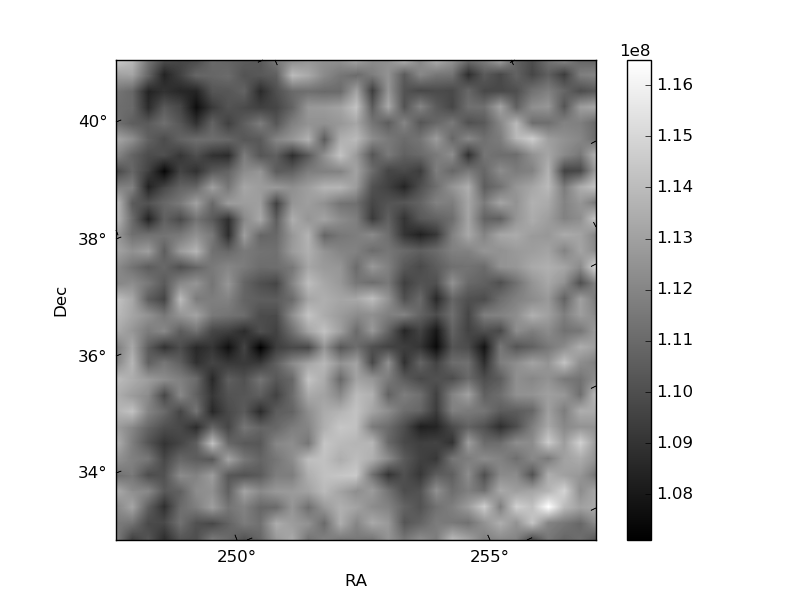
Quadrant C |
| Plot type | Count rate plots | Images |
|---|---|---|
| Comparison with Poisson distribution Blue bars denote a histogram of data divided into 1 sec bins. Red curve is a Poisson curve with rate = median count rate of data. |
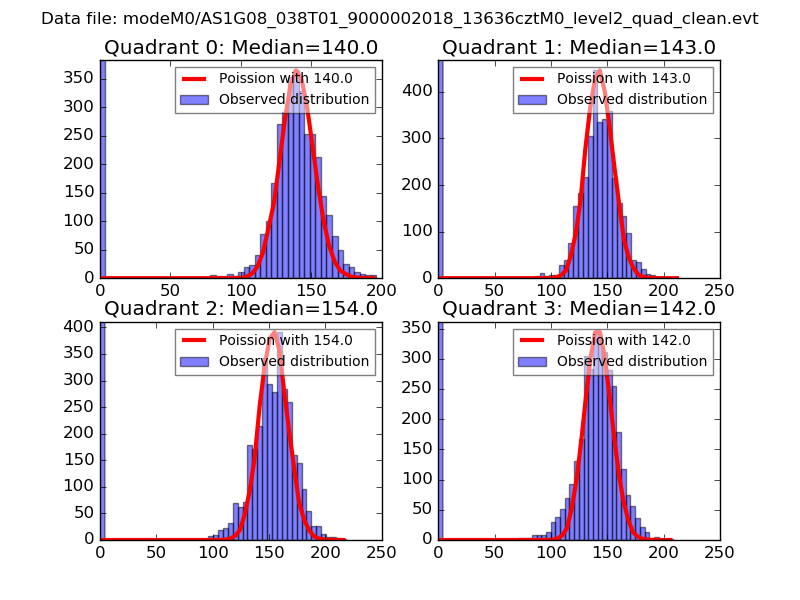 |
 |
| Quadrant-wise count rates Data is divided into 100 sec bins |
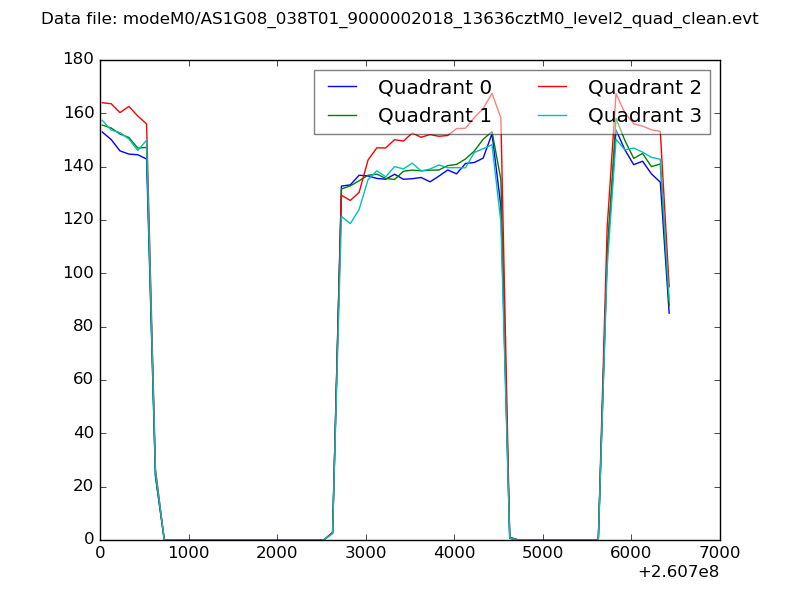 |
|
| Module-wise count rates for Quadrant A Data is divided into 100 sec bins |
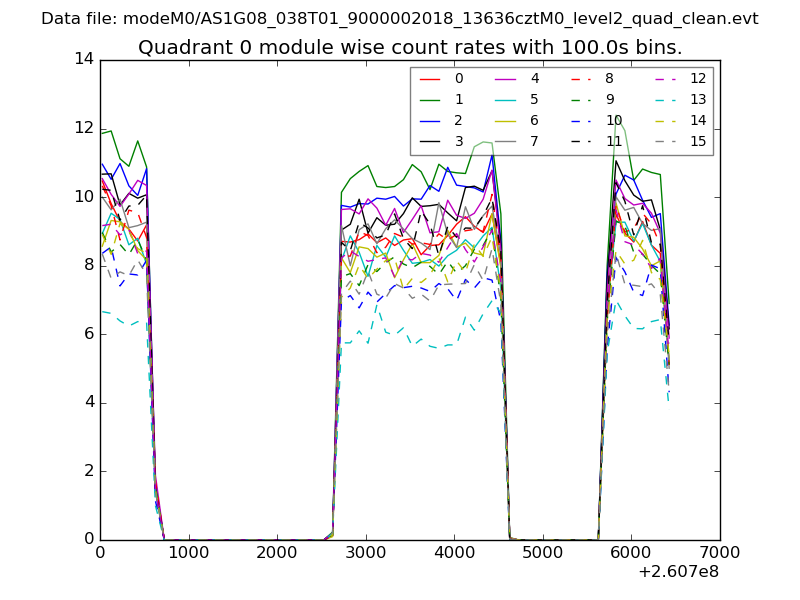 |
 |
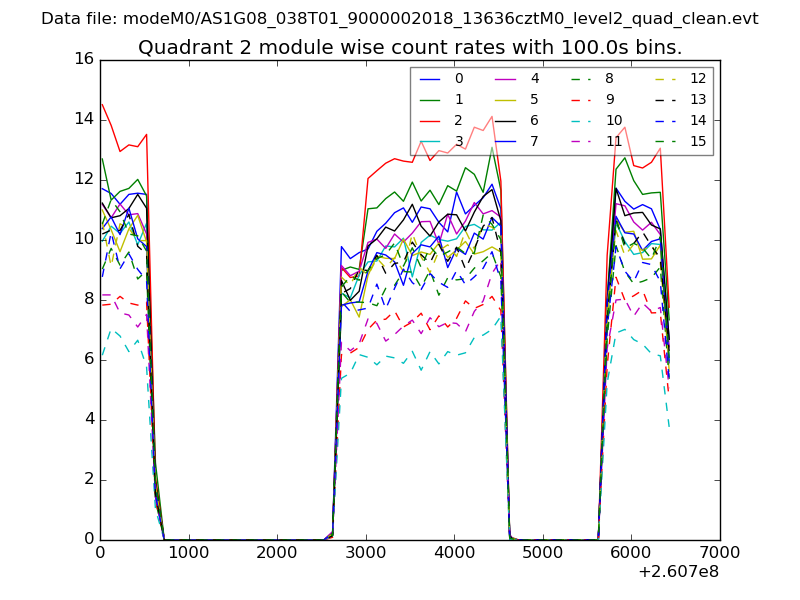
| Module-wise count rates for Quadrant B Data is divided into 100 sec bins |
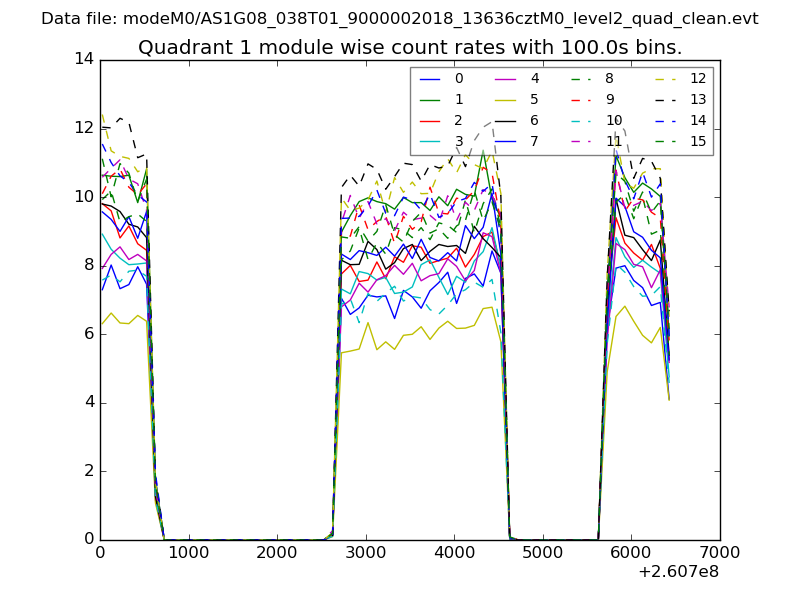 |
 |
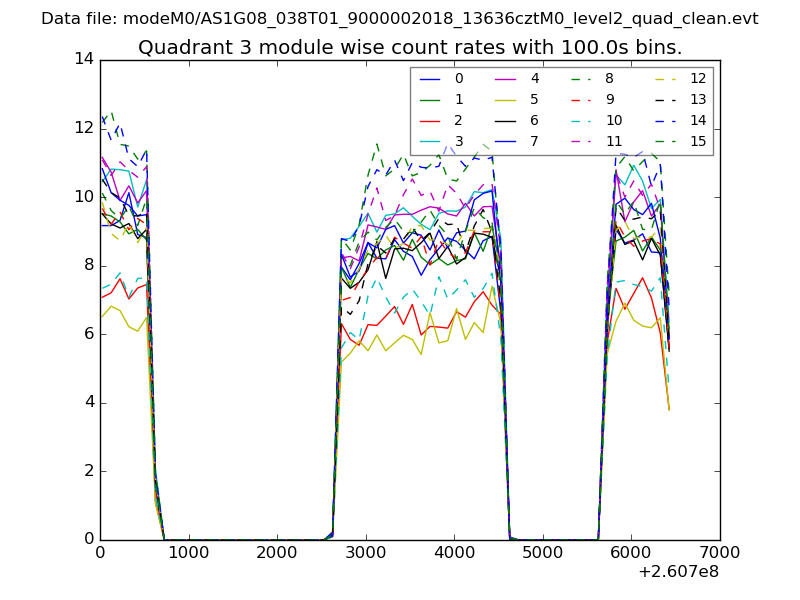
| Module-wise count rates for Quadrant C Data is divided into 100 sec bins |
 |
 |
| Module-wise count rates for Quadrant D Data is divided into 100 sec bins |
 |
 |
| Parameter | Plot |
|---|---|
| CZT HV Monitor | 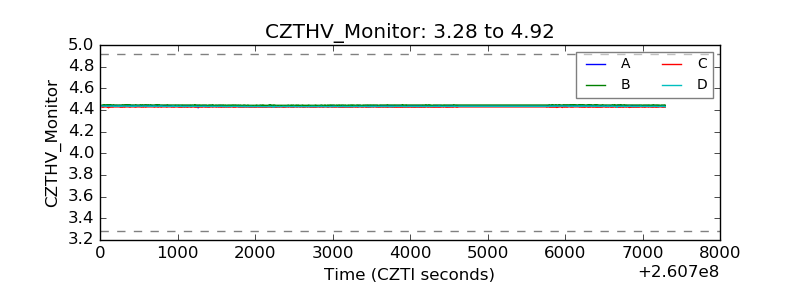 |
| D_VDD | 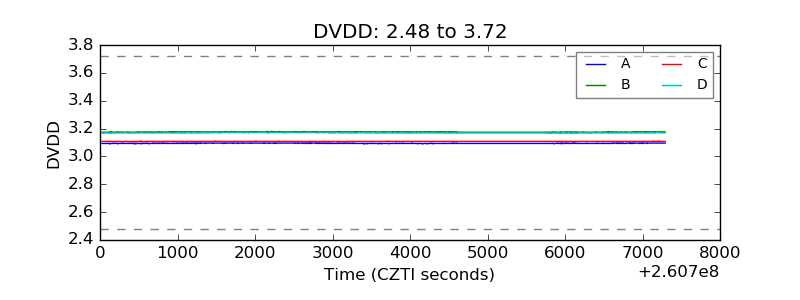 |
| Temperature 1 | 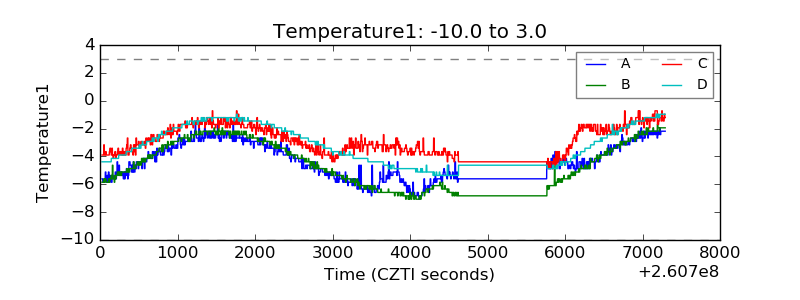 |
| Veto HV Monitor | 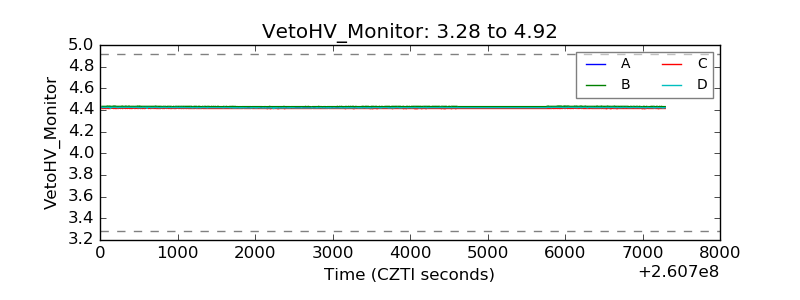 |
| Veto LLD | 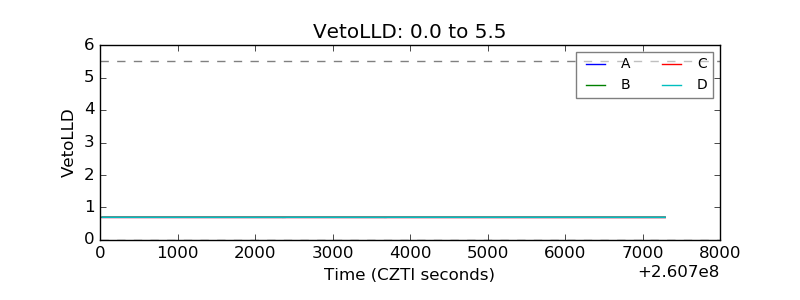 |
| Alpha Counter | 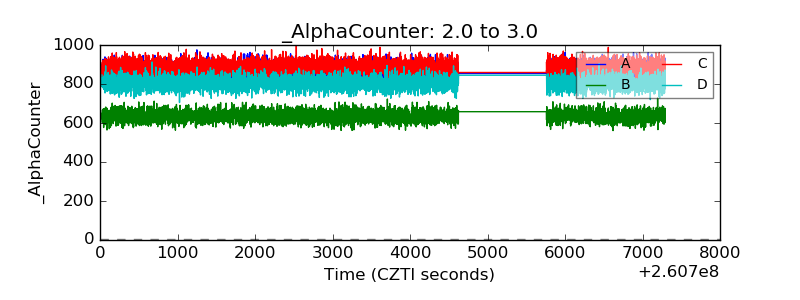 |
| _CPM_Rate | 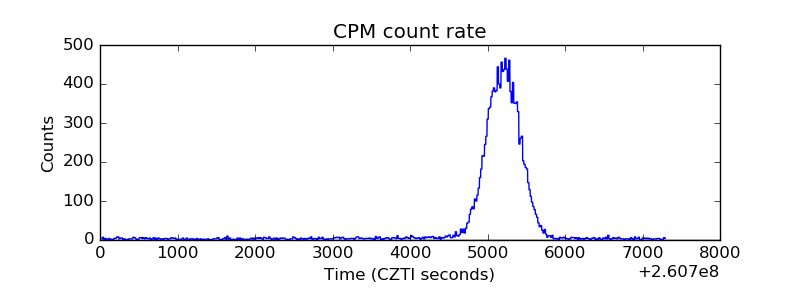 |
| CZT Counter | 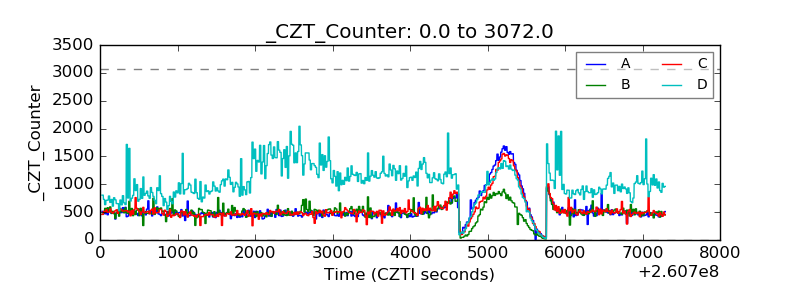 |
| +2.5 Volts monitor |  |
| +5 Volts monitor | 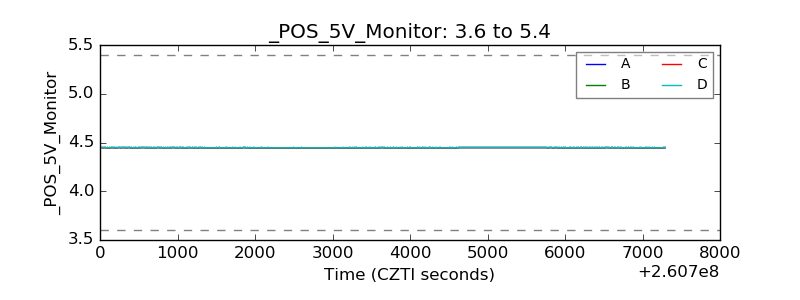 |
| _ROLL_ROT | 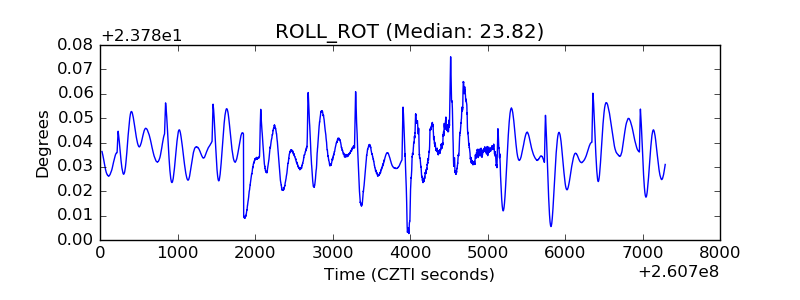 |
| _Roll_DEC | 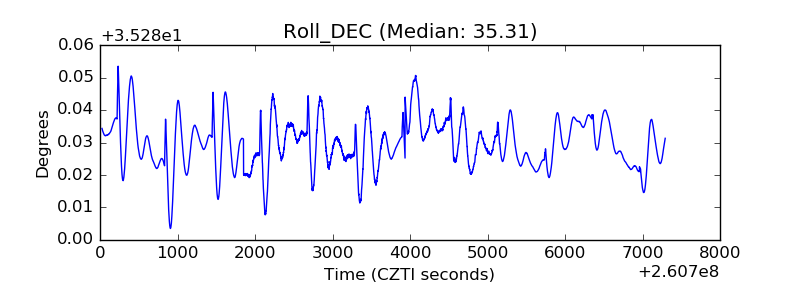 |
| _Roll_RA | 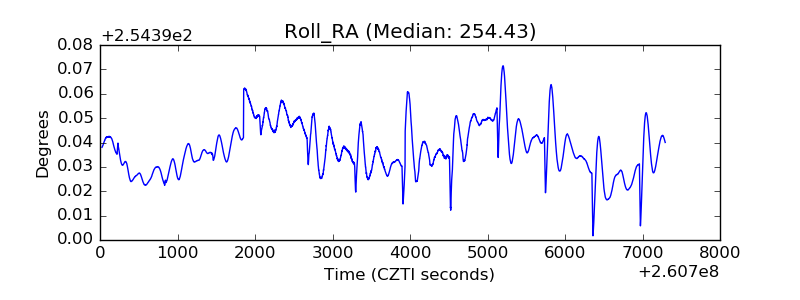 |
| Veto Counter | 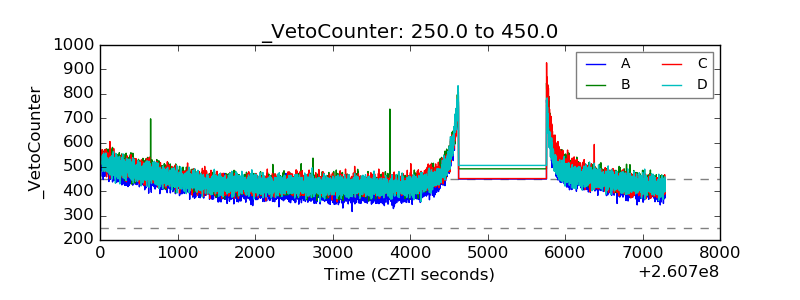 |