| Param | Original file | Final file |
|---|---|---|
| Filename | modeM0/AS1G08_038T01_9000002018_13637cztM0_level2.evt | modeM0/AS1G08_038T01_9000002018_13637cztM0_level2_quad_clean.evt |
| Size (bytes) | 579,337,920 | 82,463,040 |
| Size | 552.5 MB | 78.6 MB |
| Events in quadrant A | 3,339,495 | 487,217 |
| Events in quadrant B | 3,612,130 | 497,341 |
| Events in quadrant C | 3,476,621 | 536,089 |
| Events in quadrant D | 6,651,396 | 497,077 |
| Mode M0 | |||
|---|---|---|---|
| Quadrant | BADHDUFLAG | Total packets | Discarded packets |
| A | 0 | 14268 | 3 |
| B | 0 | 14851 | 2 |
| C | 0 | 14271 | 2 |
| D | 0 | 24703 | 2 |
| Mode SS | |||
|---|---|---|---|
| Quadrant | BADHDUFLAG | Total packets | Discarded packets |
| A | 0 | 142 | 0 |
| B | 0 | 142 | 0 |
| C | 0 | 142 | 0 |
| D | 0 | 142 | 0 |
| Mode M9 | |||
|---|---|---|---|
| Quadrant | BADHDUFLAG | Total packets | Discarded packets |
| A | 0 | 11 | 0 |
| B | 0 | 11 | 0 |
| C | 0 | 11 | 0 |
| D | 0 | 12 | 0 |
| Quadrant | Total seconds | Saturated seconds | Saturation percentage |
|---|---|---|---|
| A | 6872 | 73 | 1.062282% |
| B | 6872 | 119 | 1.731665% |
| C | 6872 | 57 | 0.829453% |
| D | 6872 | 146 | 2.124563% |
Noise dominated data is calculated using 1-second bins in cleaned event files. If a bin has >2000 counts, and if more than 50% of those come from <1% of pixels, then it is considered to be noise-dominated and hence unusable.
| Quadrant | # 1 sec bins | Bins with >0 counts | Bins with >2000 counts | High rate bins dominated by noise | Noise dominated (total time) | Noise dominated (detector-on time) | Marked lightcurve |
|---|---|---|---|---|---|---|---|
| A | 7738 | 6874 | 0 | 0 | 0.00% | 0.00% | 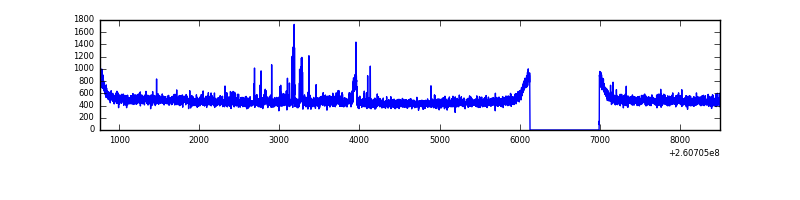 |
| B | 7738 | 6874 | 14 | 14 | 0.18% | 0.20% | 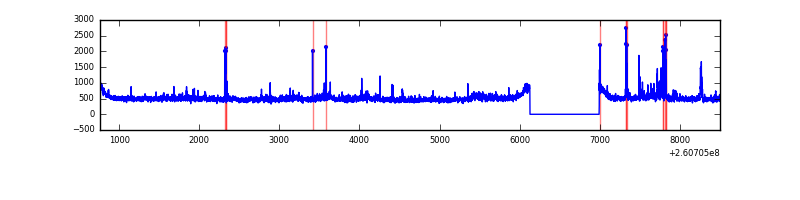 |
| C | 7738 | 6874 | 2 | 2 | 0.03% | 0.03% | 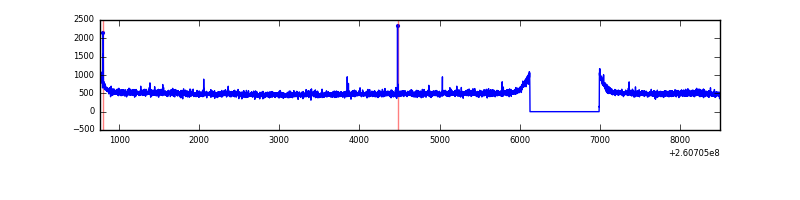 |
| D | 7738 | 6874 | 51 | 51 | 0.66% | 0.74% | 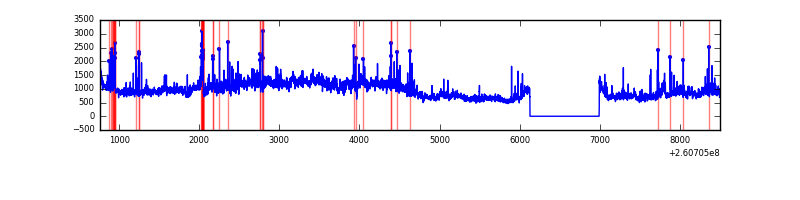 |
Top three noisy pixels from each quadrant. If the there are fewer than three noisy pixels in the level2.evt file, extra rows are filled as -1
| Pixel properties | Quadrant properties | ||||||
|---|---|---|---|---|---|---|---|
| Quadrant | DetID | PixID | Counts | Sigma | Mean | Median | Sigma |
| A | 9 | 143 | 35707 | 202.94 | 850 | 830 | 171.9 |
| A | 15 | 157 | 16497 | 91.16 | 850 | 830 | 171.9 |
| A | 1 | 162 | 10262 | 54.88 | 850 | 830 | 171.9 |
| B | 0 | 219 | 173271 | 1081.78 | 845 | 825 | 159.4 |
| B | 0 | 214 | 51137 | 315.61 | 845 | 825 | 159.4 |
| B | 0 | 245 | 28811 | 175.56 | 845 | 825 | 159.4 |
| C | 3 | 233 | 214141 | 1119.4 | 833 | 841 | 190.5 |
| C | 0 | 207 | 13995 | 69.03 | 833 | 841 | 190.5 |
| C | 13 | 61 | 6018 | 27.17 | 833 | 841 | 190.5 |
| D | 13 | 122 | 2698510 | 13686.89 | 826 | 805 | 197.1 |
| D | 8 | 195 | 530120 | 2685.5 | 826 | 805 | 197.1 |
| D | 5 | 222 | 176281 | 890.28 | 826 | 805 | 197.1 |
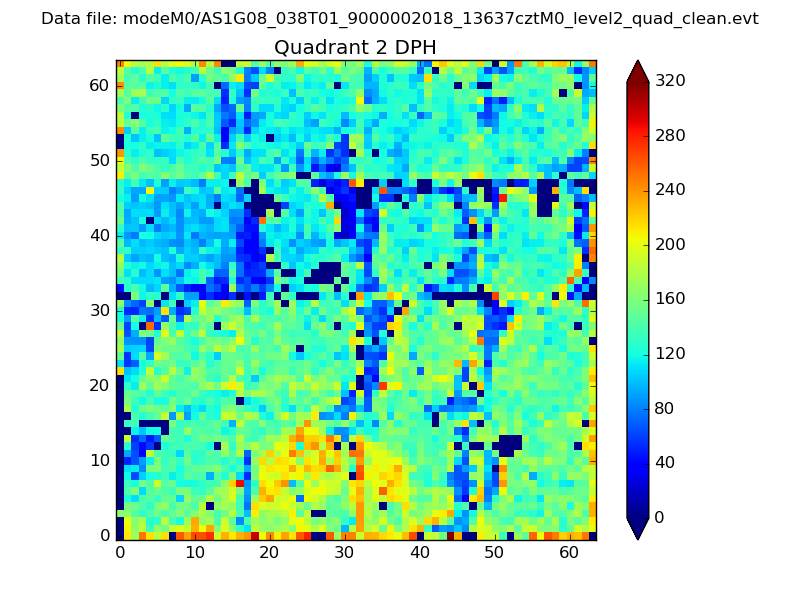
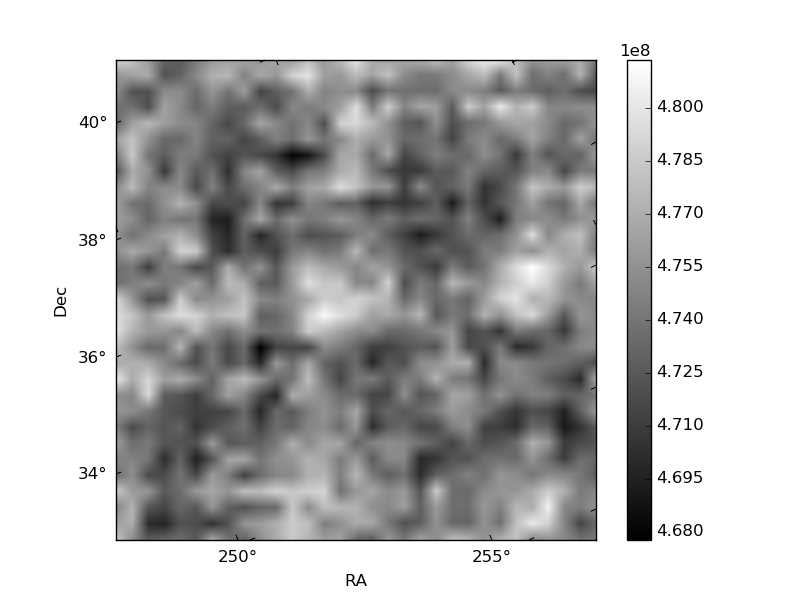
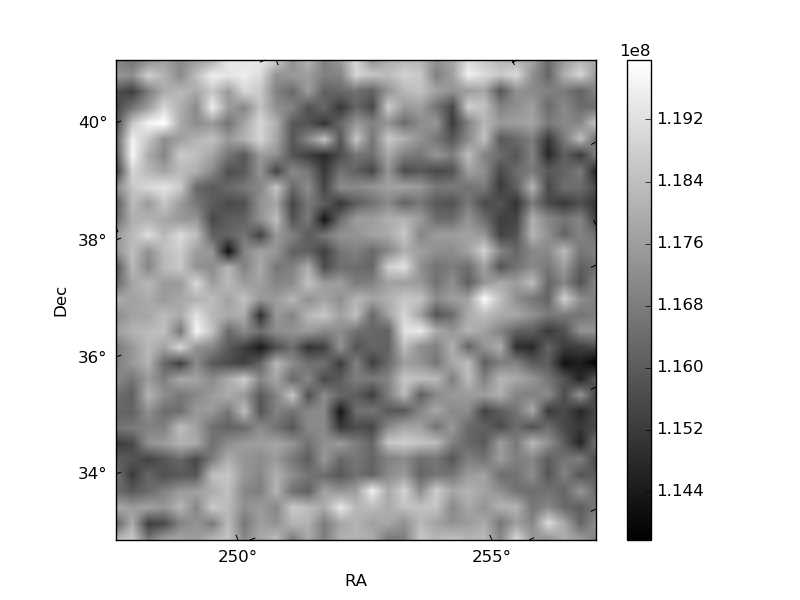
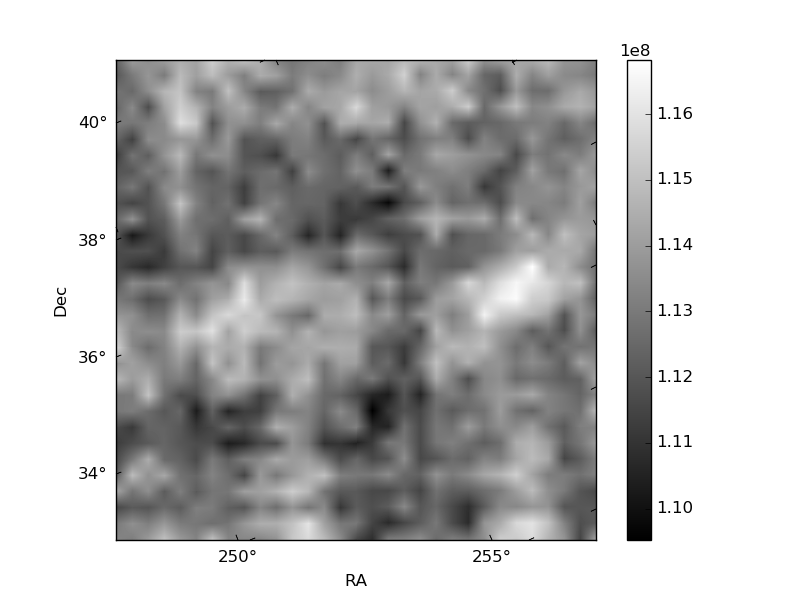
Histogram calculated using DETX and DETY for each event in the final _common_clean file
| Quadrant A | 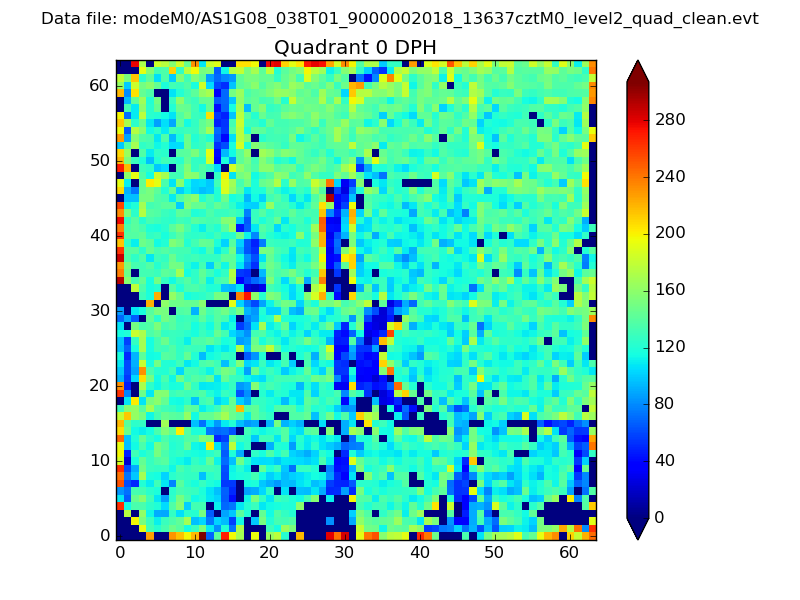 |
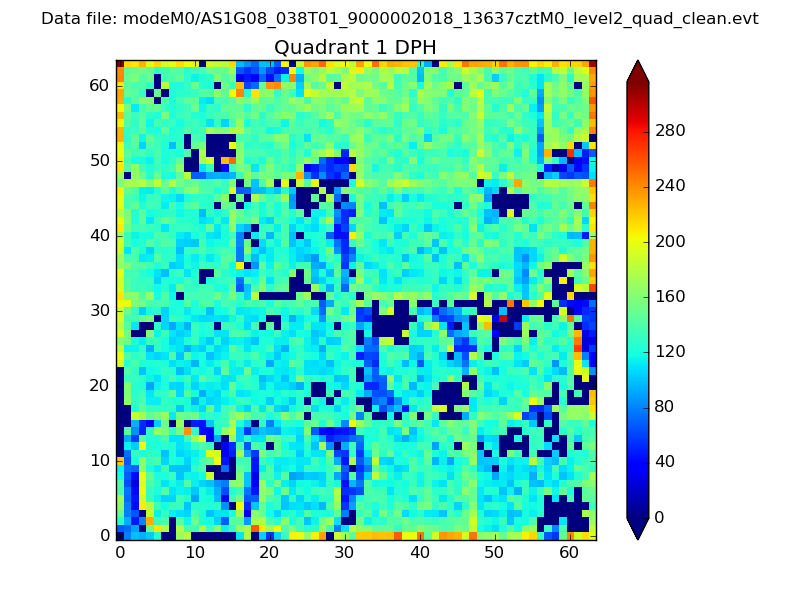 |
Quadrant B |
|---|---|---|---|
| Quadrant D | 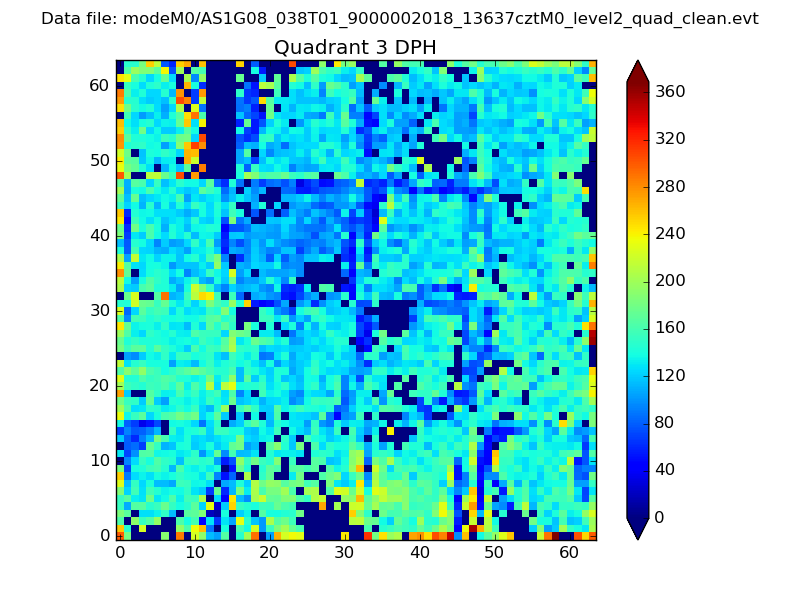 |
 |
Quadrant C |
| Plot type | Count rate plots | Images |
|---|---|---|
| Comparison with Poisson distribution Blue bars denote a histogram of data divided into 1 sec bins. Red curve is a Poisson curve with rate = median count rate of data. |
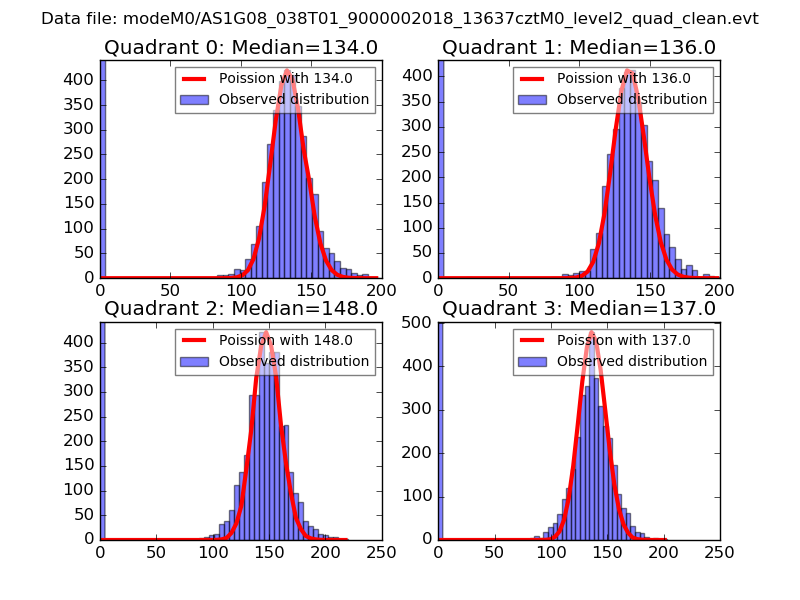 |
 |
| Quadrant-wise count rates Data is divided into 100 sec bins |
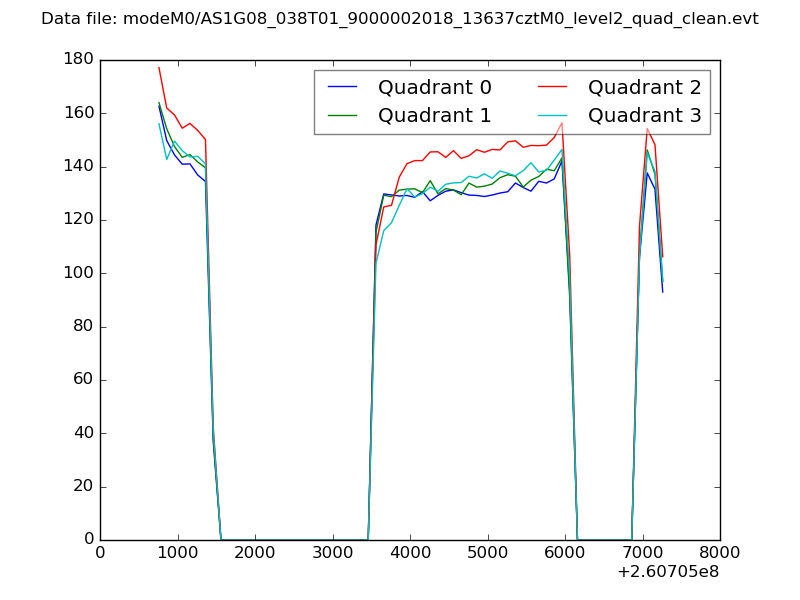 |
|
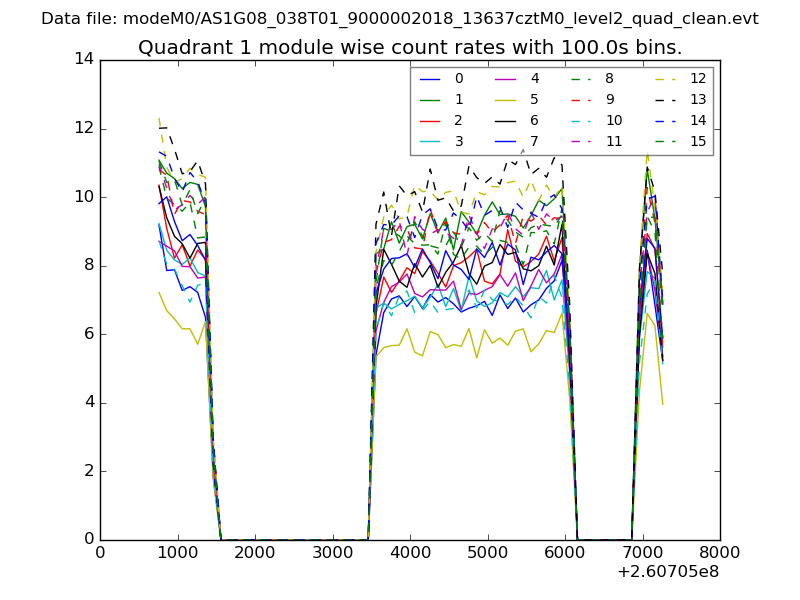
| Module-wise count rates for Quadrant A Data is divided into 100 sec bins |
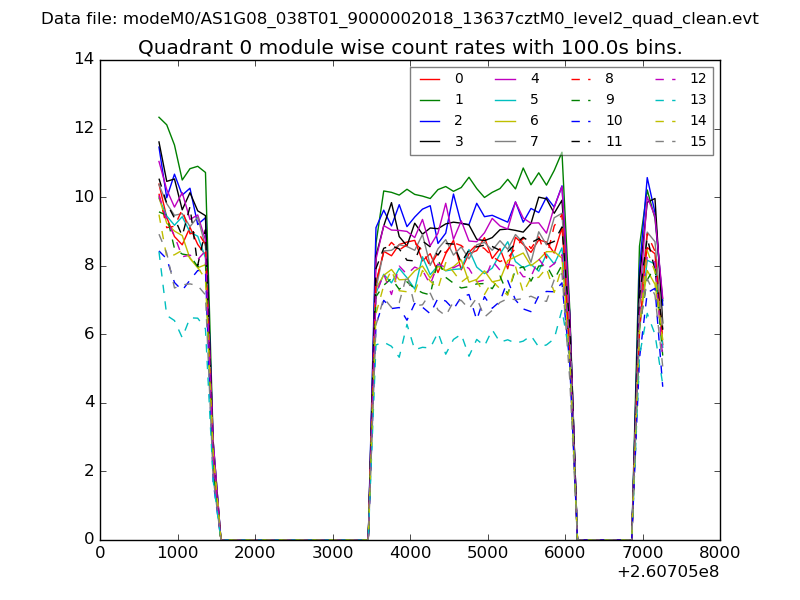 |
 |
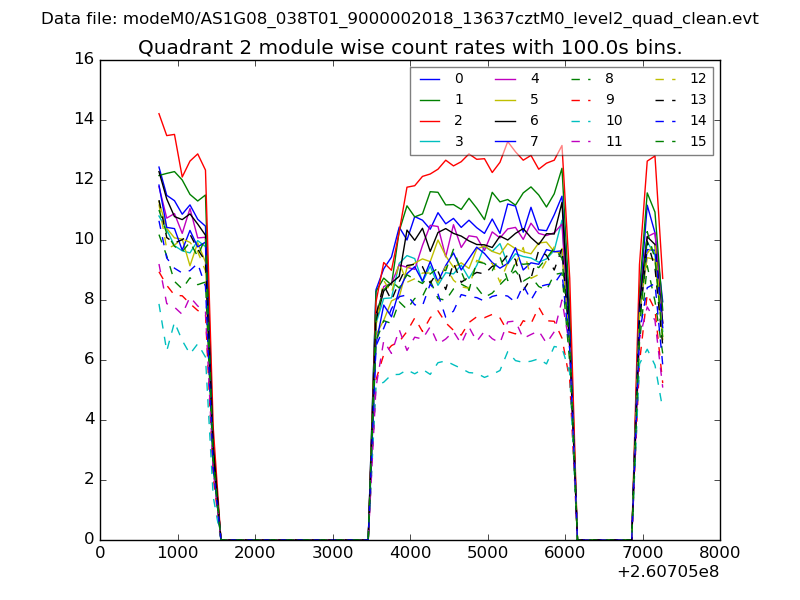
| Module-wise count rates for Quadrant B Data is divided into 100 sec bins |
 |
 |
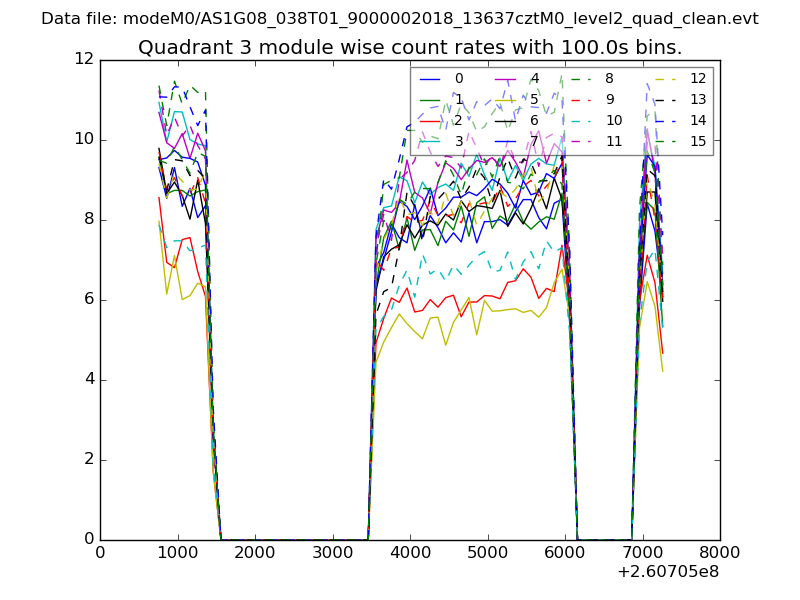
| Module-wise count rates for Quadrant C Data is divided into 100 sec bins |
 |
 |
| Module-wise count rates for Quadrant D Data is divided into 100 sec bins |
 |
 |
| Parameter | Plot |
|---|---|
| CZT HV Monitor | 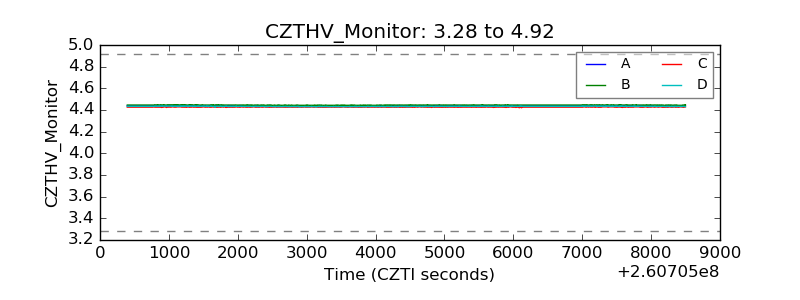 |
| D_VDD | 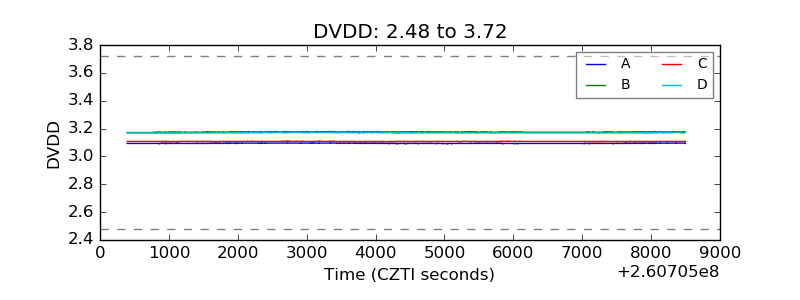 |
| Temperature 1 | 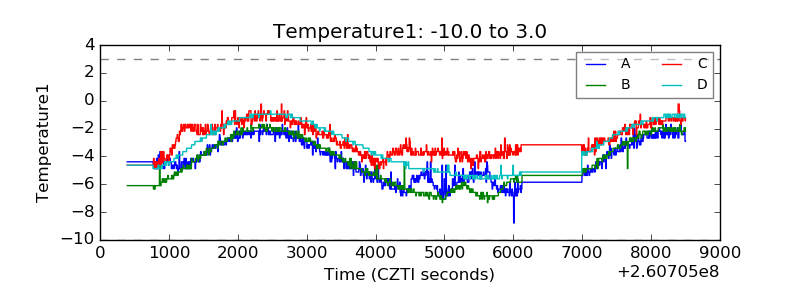 |
| Veto HV Monitor | 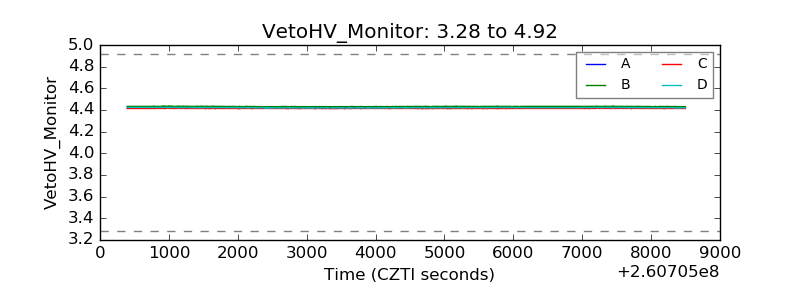 |
| Veto LLD | 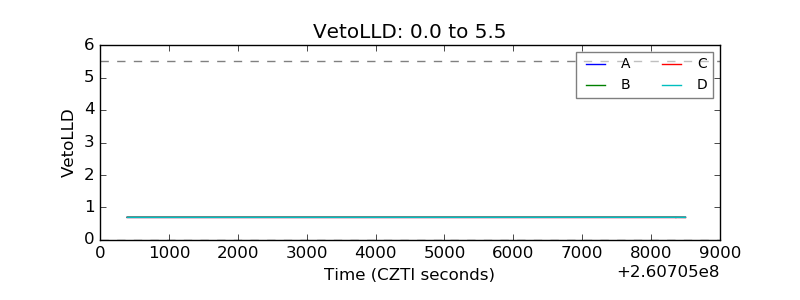 |
| Alpha Counter | 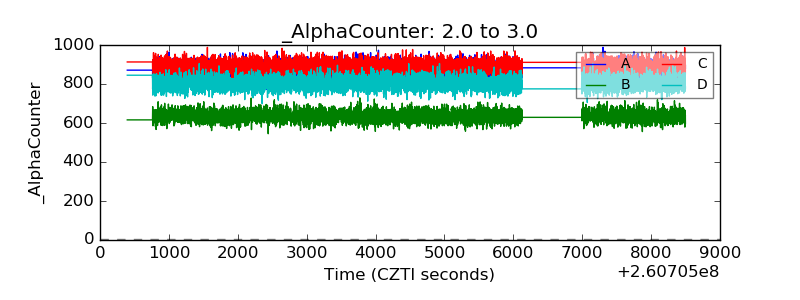 |
| _CPM_Rate | 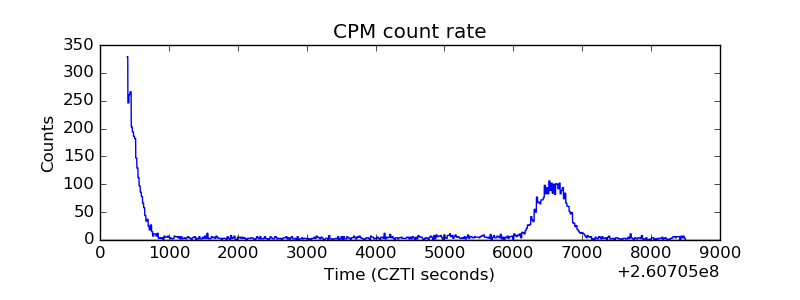 |
| CZT Counter | 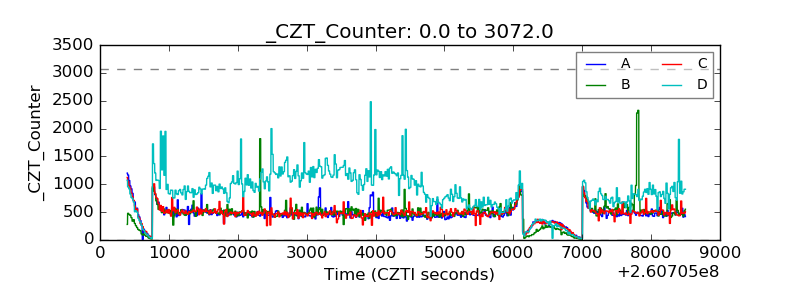 |
| +2.5 Volts monitor |  |
| +5 Volts monitor |  |
| _ROLL_ROT | 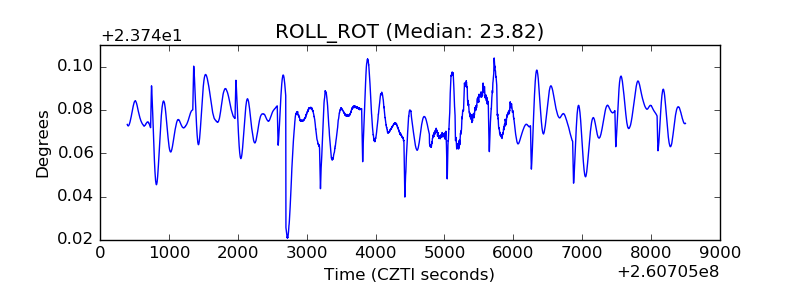 |
| _Roll_DEC |  |
| _Roll_RA | 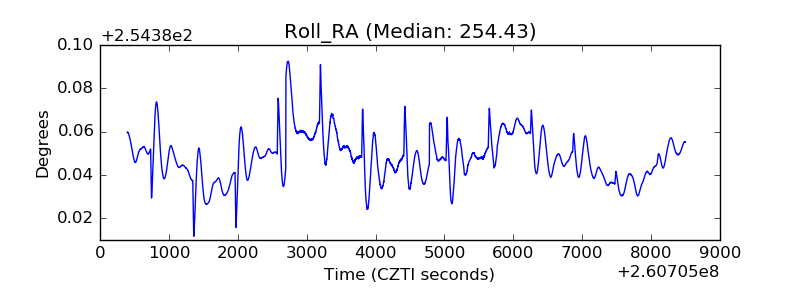 |
| Veto Counter | 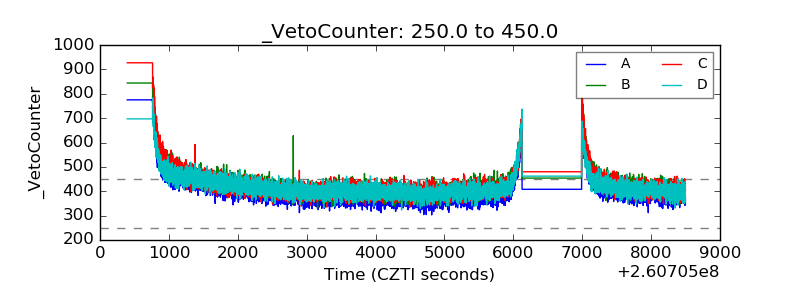 |