| Param | Original file | Final file |
|---|---|---|
| Filename | modeM0/AS1G08_038T01_9000002018_13638cztM0_level2.evt | modeM0/AS1G08_038T01_9000002018_13638cztM0_level2_quad_clean.evt |
| Size (bytes) | 369,429,120 | 53,164,800 |
| Size | 352.3 MB | 50.7 MB |
| Events in quadrant A | 2,120,857 | 310,125 |
| Events in quadrant B | 2,348,683 | 318,256 |
| Events in quadrant C | 2,259,838 | 342,707 |
| Events in quadrant D | 4,150,065 | 319,148 |
| Mode M0 | |||
|---|---|---|---|
| Quadrant | BADHDUFLAG | Total packets | Discarded packets |
| A | 0 | 9377 | 1 |
| B | 0 | 9843 | 1 |
| C | 0 | 9270 | 1 |
| D | 0 | 15654 | 1 |
| Mode SS | |||
|---|---|---|---|
| Quadrant | BADHDUFLAG | Total packets | Discarded packets |
| A | 0 | 92 | 0 |
| B | 0 | 92 | 0 |
| C | 0 | 92 | 0 |
| D | 0 | 92 | 0 |
| Mode M9 | |||
|---|---|---|---|
| Quadrant | BADHDUFLAG | Total packets | Discarded packets |
| A | 0 | 3 | 0 |
| B | 0 | 3 | 0 |
| C | 0 | 3 | 0 |
| D | 0 | 4 | 0 |
| Quadrant | Total seconds | Saturated seconds | Saturation percentage |
|---|---|---|---|
| A | 4539 | 25 | 0.550782% |
| B | 4539 | 31 | 0.682970% |
| C | 4539 | 9 | 0.198282% |
| D | 4539 | 43 | 0.947345% |
Noise dominated data is calculated using 1-second bins in cleaned event files. If a bin has >2000 counts, and if more than 50% of those come from <1% of pixels, then it is considered to be noise-dominated and hence unusable.
| Quadrant | # 1 sec bins | Bins with >0 counts | Bins with >2000 counts | High rate bins dominated by noise | Noise dominated (total time) | Noise dominated (detector-on time) | Marked lightcurve |
|---|---|---|---|---|---|---|---|
| A | 4540 | 4540 | 10 | 10 | 0.22% | 0.22% |  |
| B | 4540 | 4540 | 12 | 12 | 0.26% | 0.26% |  |
| C | 4540 | 4540 | 0 | 0 | 0.00% | 0.00% | 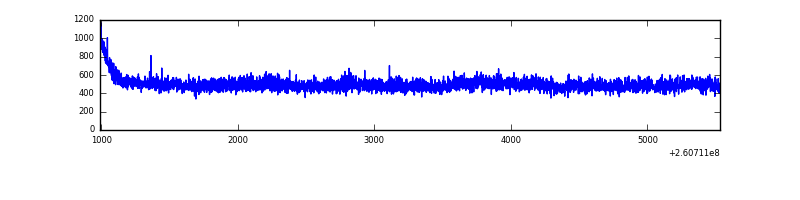 |
| D | 4540 | 4540 | 9 | 9 | 0.20% | 0.20% |  |
Top three noisy pixels from each quadrant. If the there are fewer than three noisy pixels in the level2.evt file, extra rows are filled as -1
| Pixel properties | Quadrant properties | ||||||
|---|---|---|---|---|---|---|---|
| Quadrant | DetID | PixID | Counts | Sigma | Mean | Median | Sigma |
| A | 15 | 69 | 65965 | 596.89 | 533 | 521 | 109.6 |
| A | 0 | 226 | 4846 | 39.45 | 533 | 521 | 109.6 |
| A | 9 | 143 | 4071 | 32.38 | 533 | 521 | 109.6 |
| B | 0 | 219 | 175182 | 1719.52 | 531 | 519 | 101.6 |
| B | 3 | 64 | 35712 | 346.46 | 531 | 519 | 101.6 |
| B | 0 | 245 | 19535 | 187.2 | 531 | 519 | 101.6 |
| C | 3 | 233 | 205777 | 1691.6 | 526 | 531 | 121.3 |
| C | 13 | 61 | 3828 | 27.17 | 526 | 531 | 121.3 |
| C | 12 | 4 | 1437 | 7.47 | 526 | 531 | 121.3 |
| D | 13 | 122 | 1744612 | 13927.5 | 521 | 507 | 125.2 |
| D | 5 | 222 | 223261 | 1778.8 | 521 | 507 | 125.2 |
| D | 8 | 195 | 162255 | 1291.63 | 521 | 507 | 125.2 |
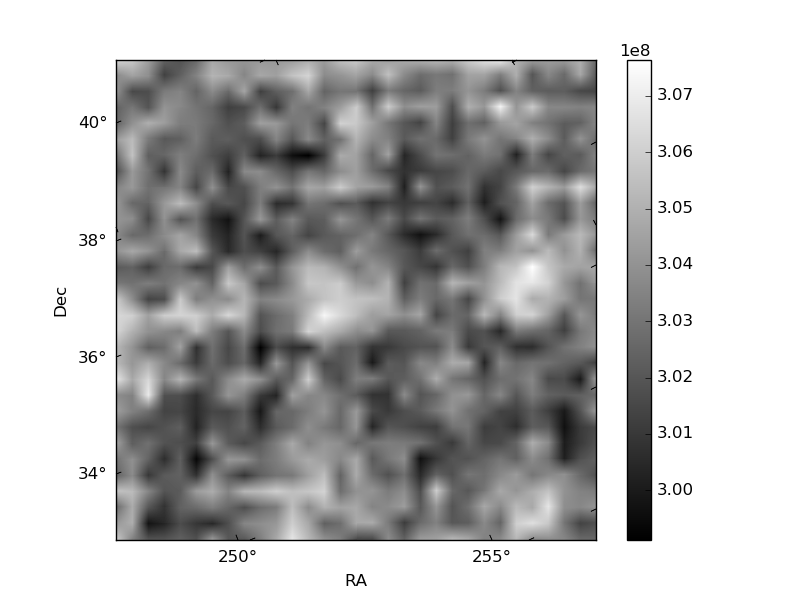
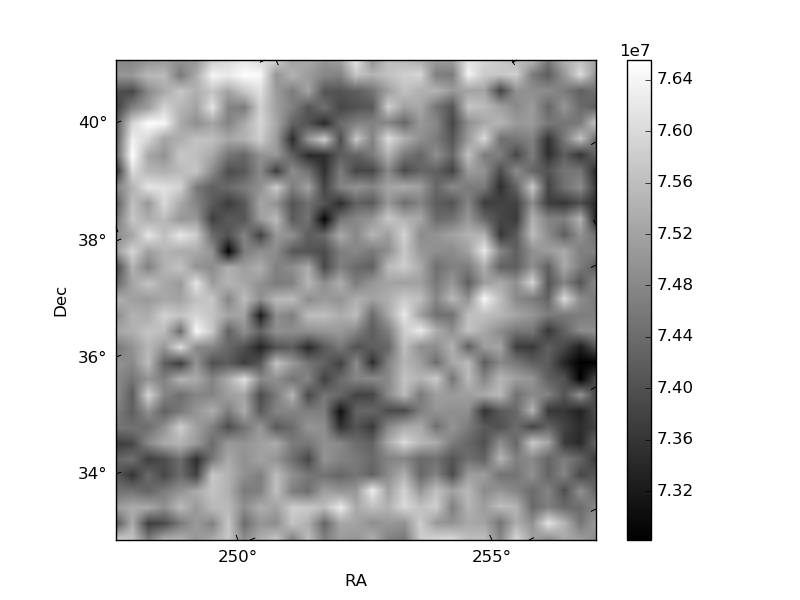
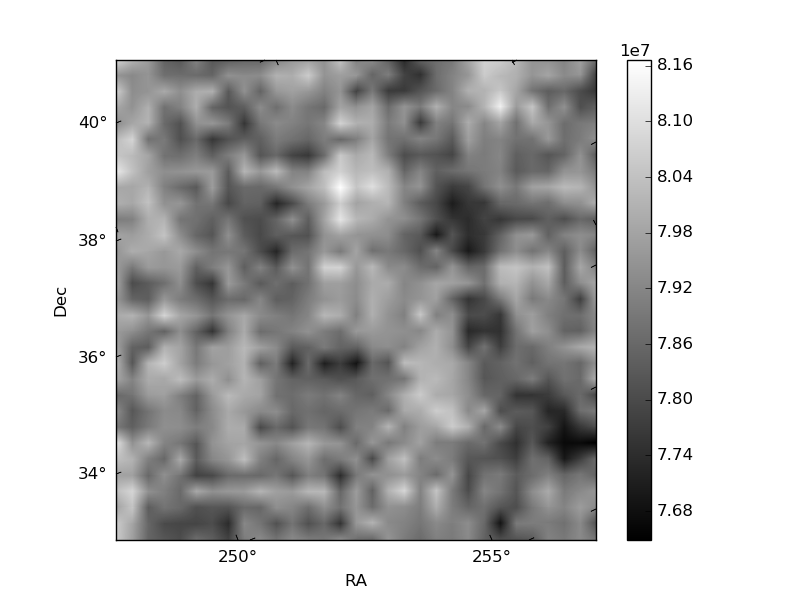
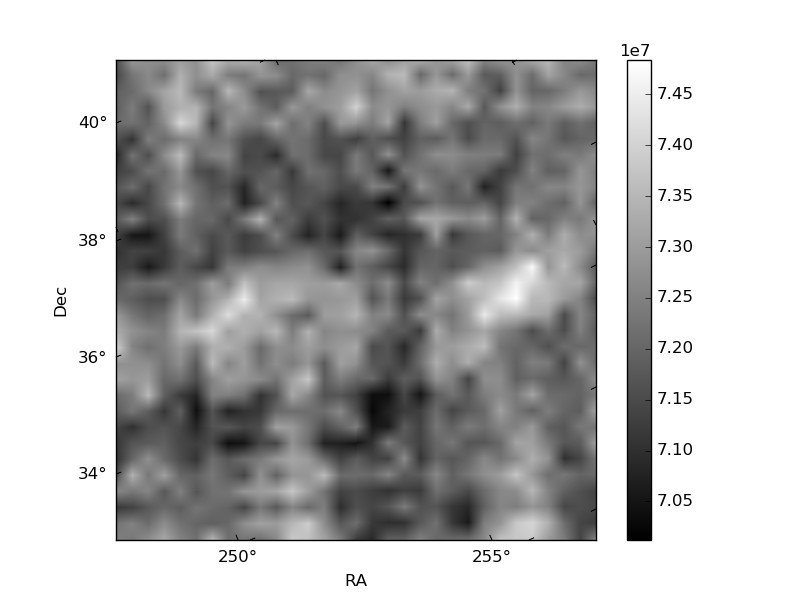
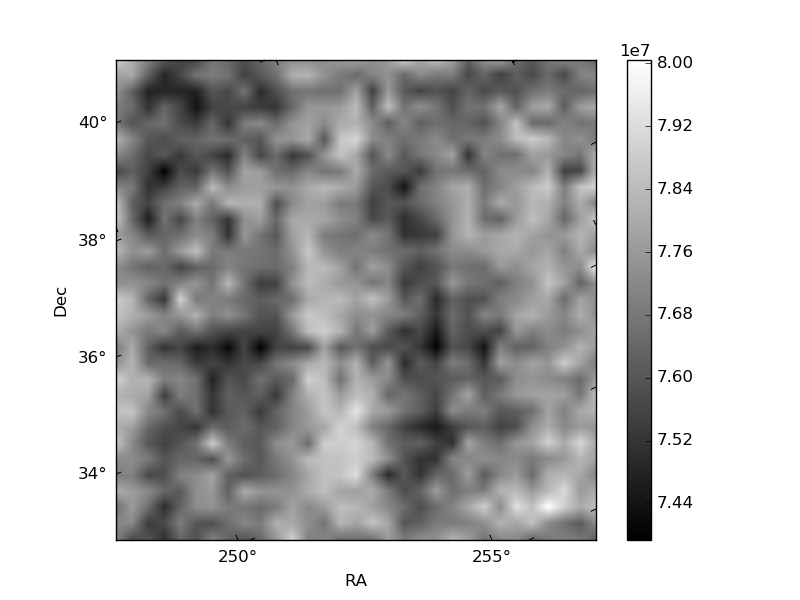
Histogram calculated using DETX and DETY for each event in the final _common_clean file
| Quadrant A | 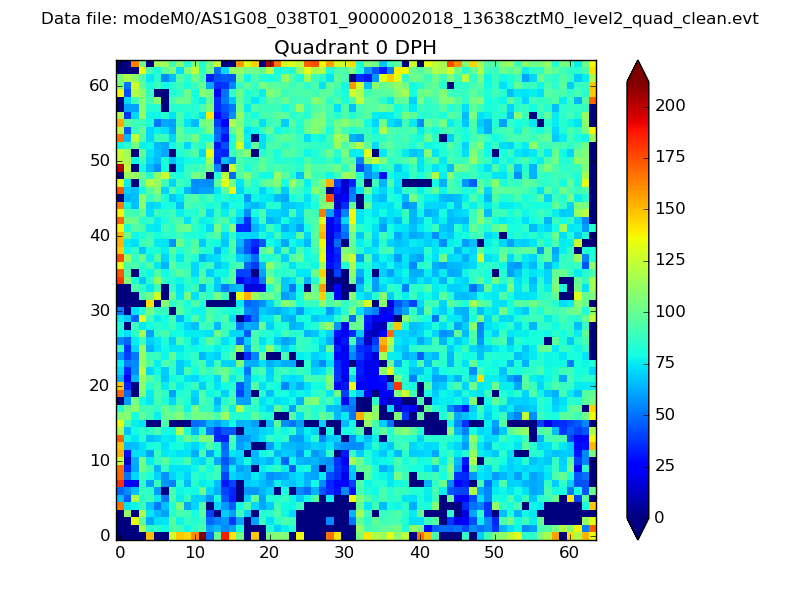 |
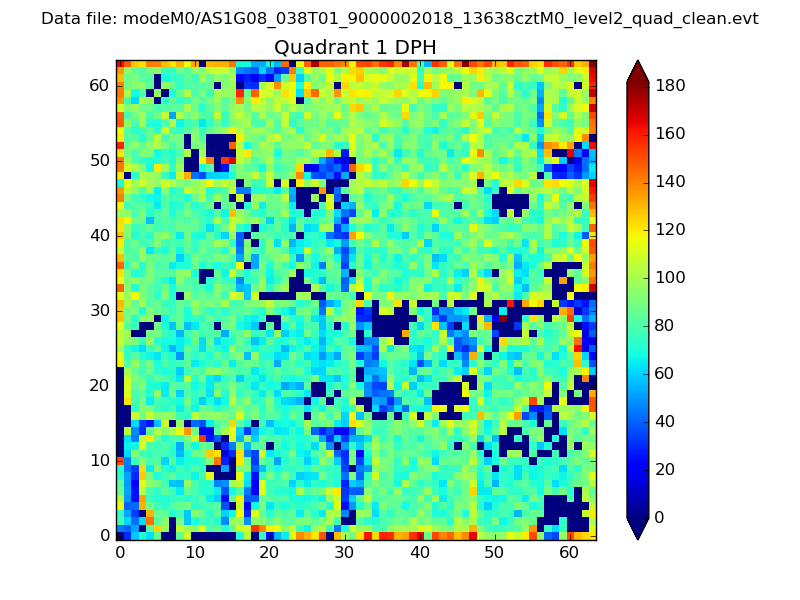 |
Quadrant B |
|---|---|---|---|
| Quadrant D |  |
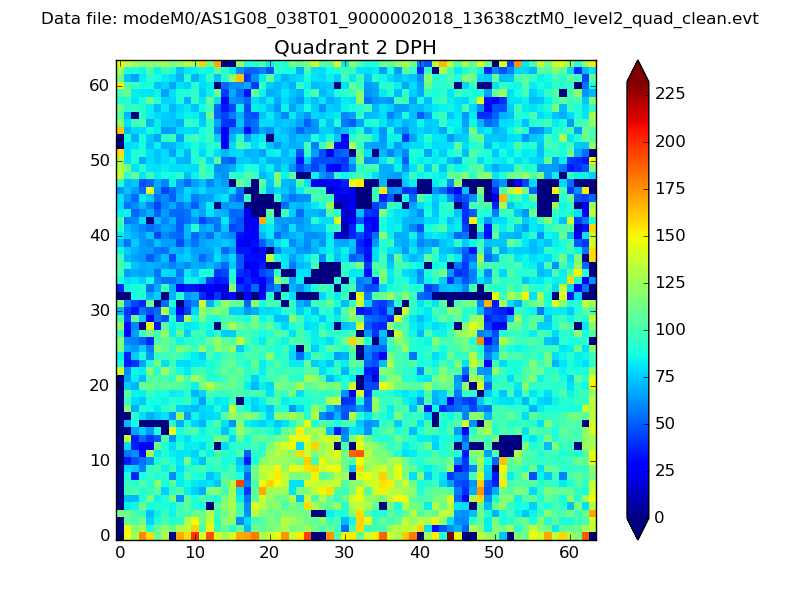 |
Quadrant C |
| Plot type | Count rate plots | Images |
|---|---|---|
| Comparison with Poisson distribution Blue bars denote a histogram of data divided into 1 sec bins. Red curve is a Poisson curve with rate = median count rate of data. |
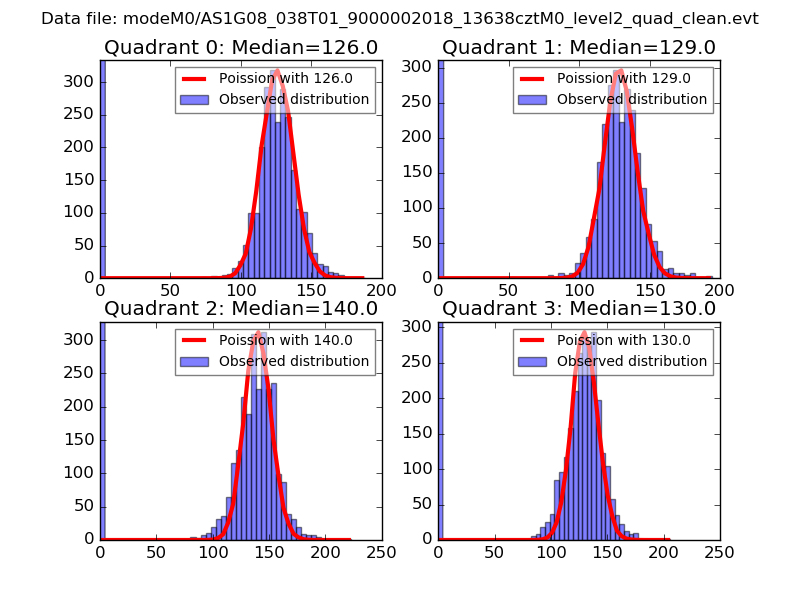 |
 |
| Quadrant-wise count rates Data is divided into 100 sec bins |
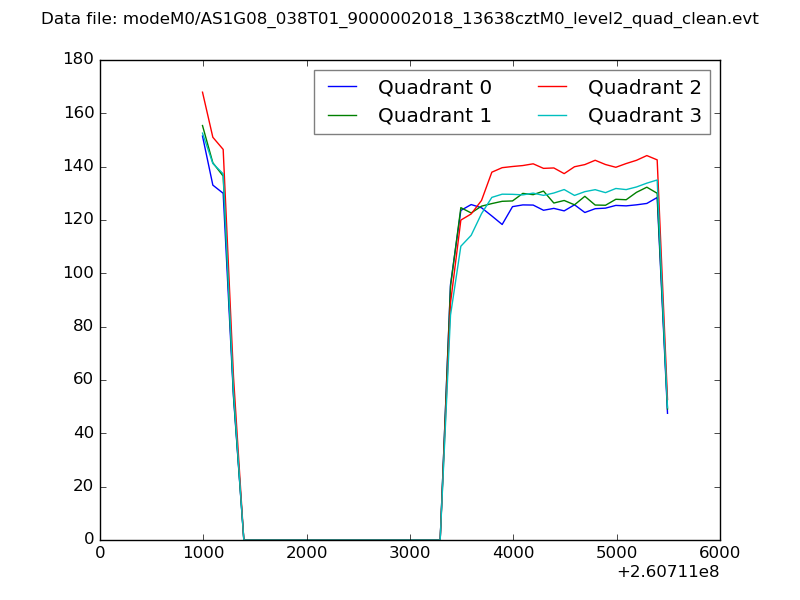 |
|
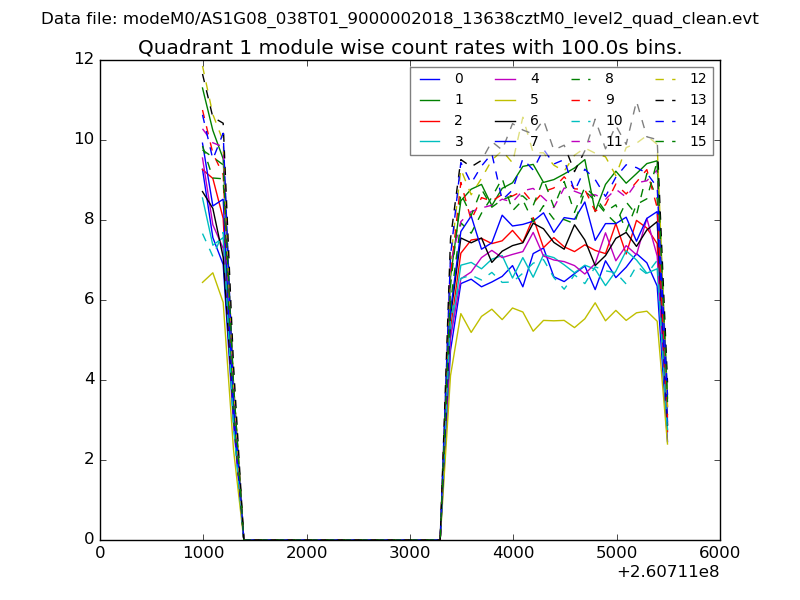
| Module-wise count rates for Quadrant A Data is divided into 100 sec bins |
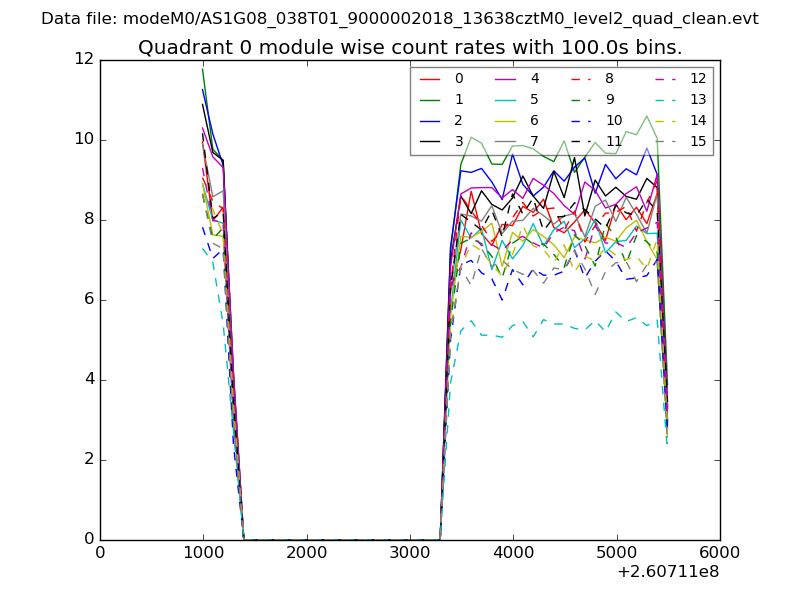 |
 |
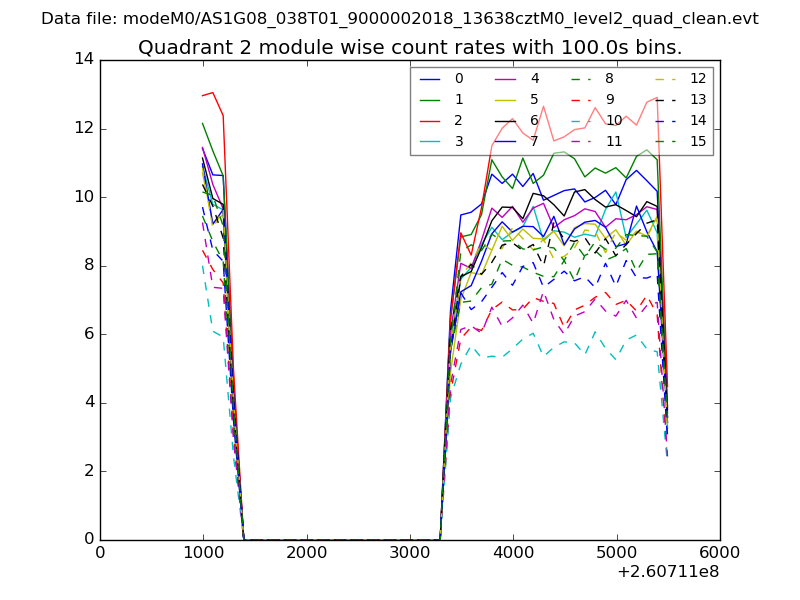
| Module-wise count rates for Quadrant B Data is divided into 100 sec bins |
 |
 |
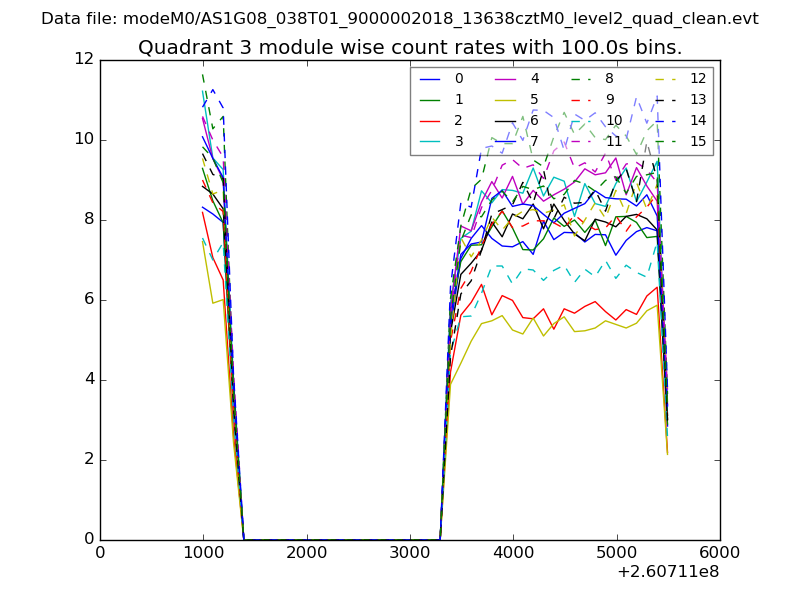
| Module-wise count rates for Quadrant C Data is divided into 100 sec bins |
 |
 |
| Module-wise count rates for Quadrant D Data is divided into 100 sec bins |
 |
 |
| Parameter | Plot |
|---|---|
| CZT HV Monitor | 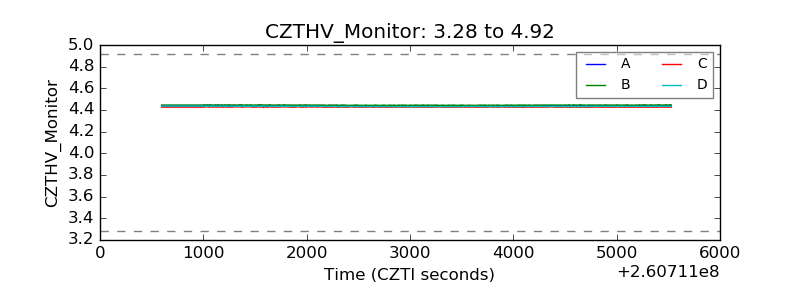 |
| D_VDD | 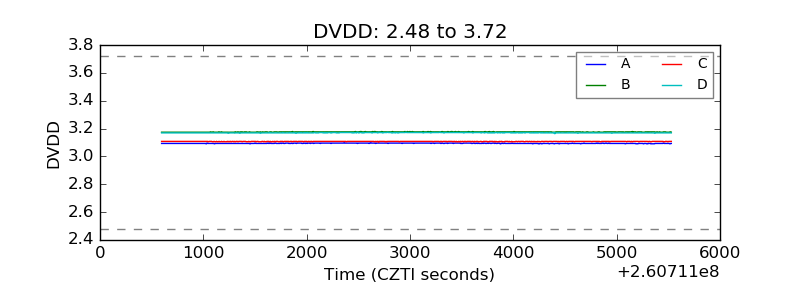 |
| Temperature 1 |  |
| Veto HV Monitor | 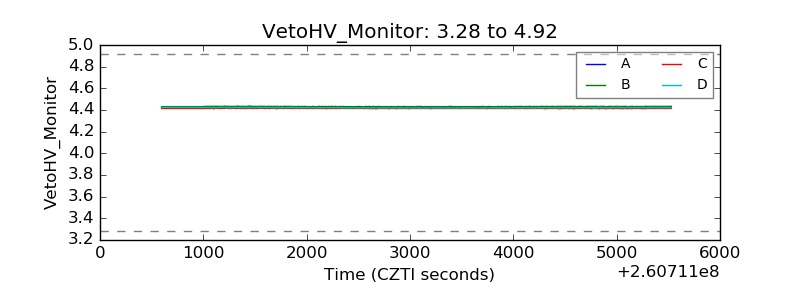 |
| Veto LLD |  |
| Alpha Counter | 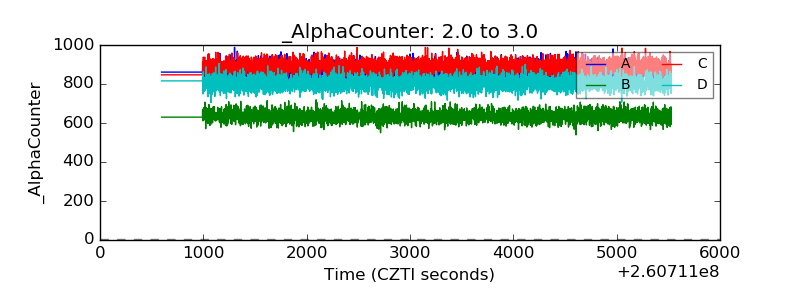 |
| _CPM_Rate | 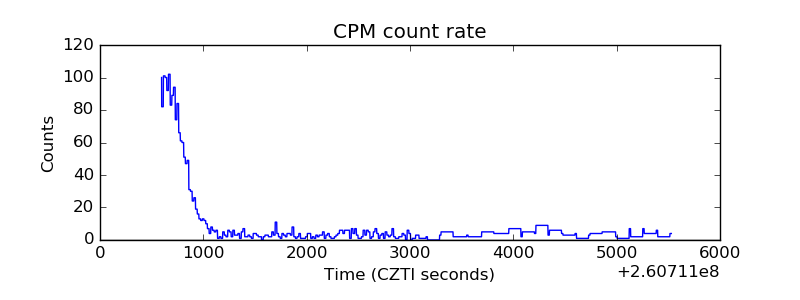 |
| CZT Counter | 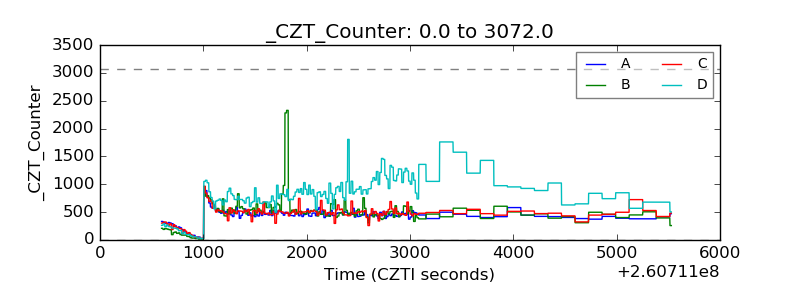 |
| +2.5 Volts monitor |  |
| +5 Volts monitor |  |
| _ROLL_ROT | 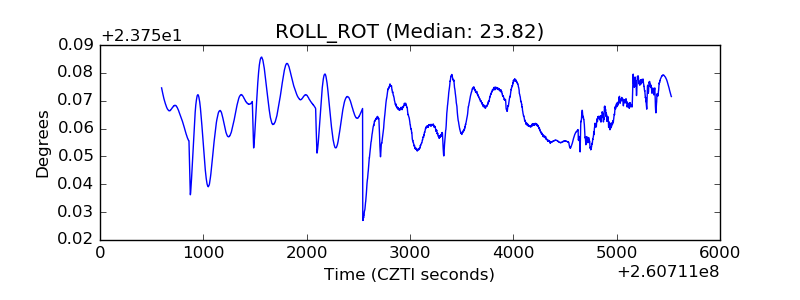 |
| _Roll_DEC | 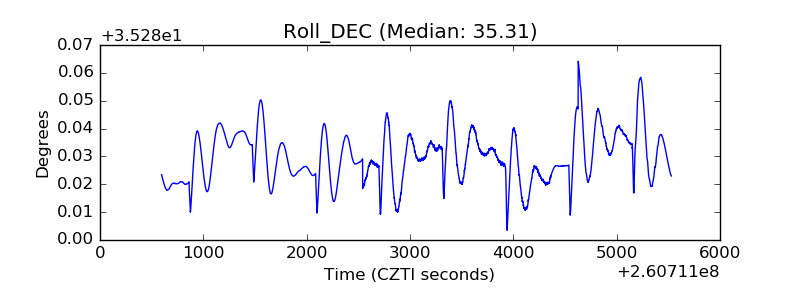 |
| _Roll_RA | 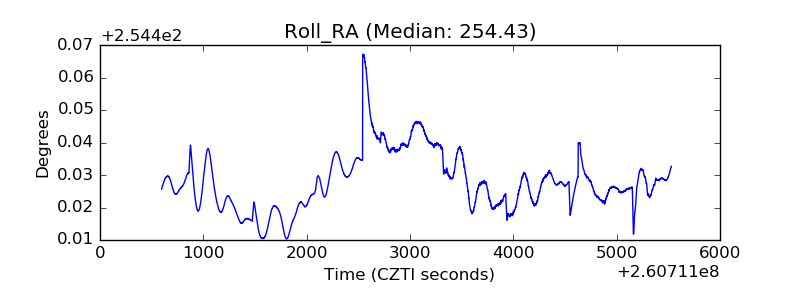 |
| Veto Counter | 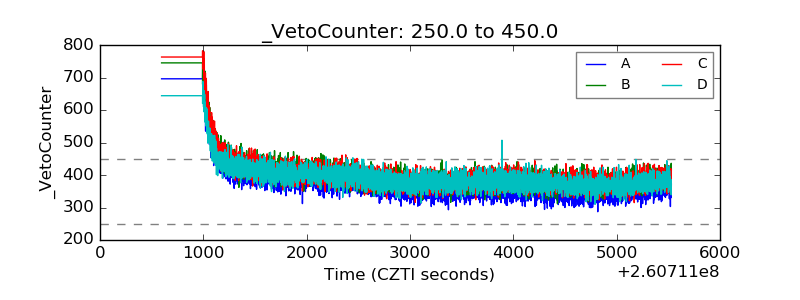 |