| Param | Original file | Final file |
|---|---|---|
| Filename | modeM0/AS1G08_044T01_9000002014cztM0_level2.fits | modeM0/AS1G08_044T01_9000002014cztM0_level2_quad_clean.evt |
| Size (bytes) | 187,151,040 | 130,731,840 |
| Size | 178.5 MB | 124.7 MB |
| Events in quadrant A | 1,166,468 | 705,691 |
| Events in quadrant B | 1,105,104 | 687,207 |
| Events in quadrant C | 1,126,762 | 652,773 |
| Events in quadrant D | 968,802 | 610,909 |
| Mode SS | |||
|---|---|---|---|
| Quadrant | BADHDUFLAG | Total packets | Discarded packets |
| A | 0 | 386 | 0 |
| B | 0 | 386 | 0 |
| C | 0 | 386 | 0 |
| D | 0 | 386 | 0 |
| Mode M9 | |||
|---|---|---|---|
| Quadrant | BADHDUFLAG | Total packets | Discarded packets |
| A | 0 | 46 | 0 |
| B | 0 | 46 | 0 |
| C | 0 | 46 | 0 |
| D | 0 | 46 | 0 |
| Mode M0 | |||
|---|---|---|---|
| Quadrant | BADHDUFLAG | Total packets | Discarded packets |
| A | 0 | 39594 | 0 |
| B | 0 | 44566 | 0 |
| C | 0 | 39497 | 0 |
| D | 0 | 47212 | 0 |
| Quadrant | Total seconds | Saturated seconds | Saturation percentage |
|---|---|---|---|
| A | 18883 | 150 | 0.794365% |
| B | 18883 | 363 | 1.922364% |
| C | 18883 | 87 | 0.460732% |
| D | 18883 | 363 | 1.922364% |
Noise dominated data is calculated using 1-second bins in cleaned event files. If a bin has >2000 counts, and if more than 50% of those come from <1% of pixels, then it is considered to be noise-dominated and hence unusable.
| Quadrant | # 1 sec bins | Bins with >0 counts | Bins with >2000 counts | High rate bins dominated by noise | Noise dominated (total time) | Noise dominated (detector-on time) | Marked lightcurve |
|---|---|---|---|---|---|---|---|
| A | 23558 | 18882 | 0 | 0 | 0.00% | 0.00% | 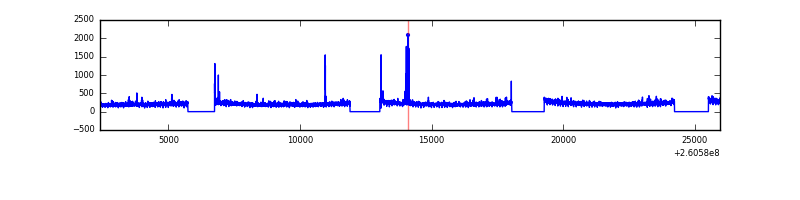 |
| B | 23558 | 18882 | 0 | 0 | 0.00% | 0.00% | 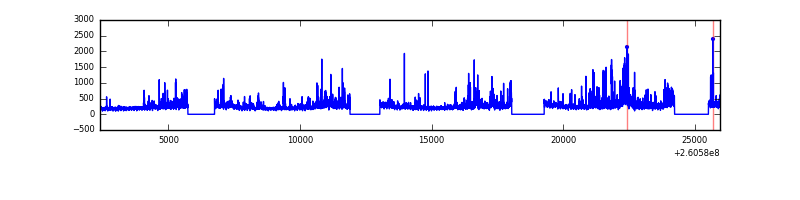 |
| C | 23558 | 18883 | 0 | 0 | 0.00% | 0.00% | 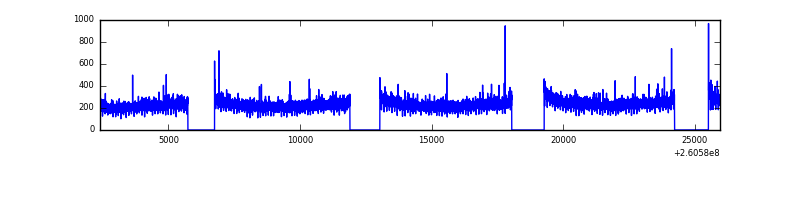 |
| D | 23557 | 18881 | 0 | 0 | 0.00% | 0.00% |  |
Top three noisy pixels from each quadrant. If the there are fewer than three noisy pixels in the level2.evt file, extra rows are filled as -1
| Pixel properties | Quadrant properties | ||||||
|---|---|---|---|---|---|---|---|
| Quadrant | DetID | PixID | Counts | Sigma | Mean | Median | Sigma |
| A | 0 | 29 | 1125 | 10.99 | 303 | 284 | 76.5 |
| A | 7 | 110 | 998 | 9.33 | 303 | 284 | 76.5 |
| A | 9 | 19 | 837 | 7.22 | 303 | 284 | 76.5 |
| B | 2 | 9 | 925 | 10.97 | 291 | 278 | 59.0 |
| B | 5 | 232 | 746 | 7.94 | 291 | 278 | 59.0 |
| B | 5 | 128 | 724 | 7.56 | 291 | 278 | 59.0 |
| C | 1 | 81 | 839 | 7.18 | 297 | 277 | 78.3 |
| C | 1 | 80 | 798 | 6.66 | 297 | 277 | 78.3 |
| C | 1 | 65 | 798 | 6.66 | 297 | 277 | 78.3 |
| D | 6 | 231 | 720 | 6.23 | 277 | 253 | 74.9 |
| D | 3 | 14 | 711 | 6.11 | 277 | 253 | 74.9 |
| D | 10 | 189 | 693 | 5.87 | 277 | 253 | 74.9 |
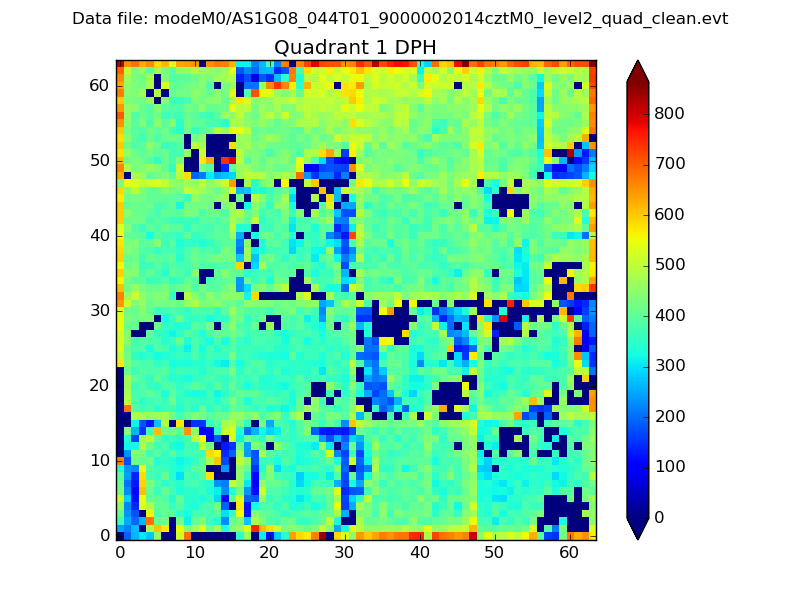
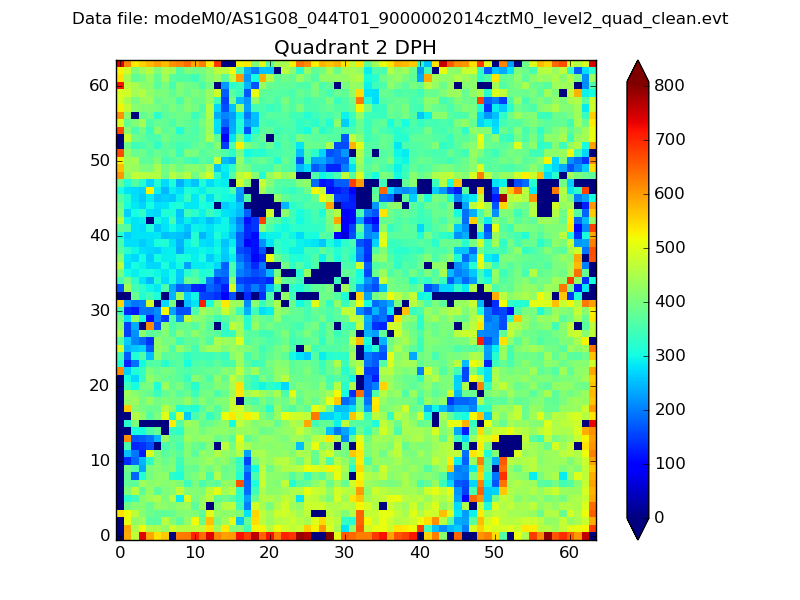
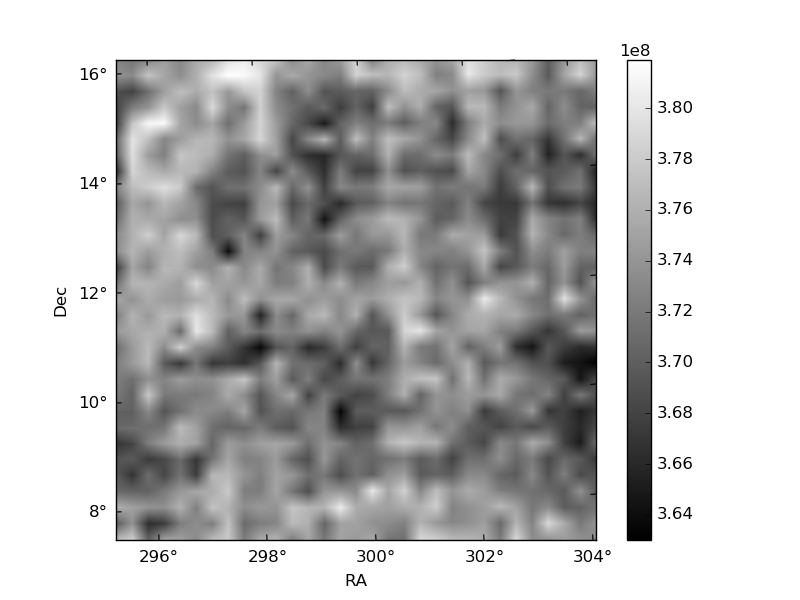
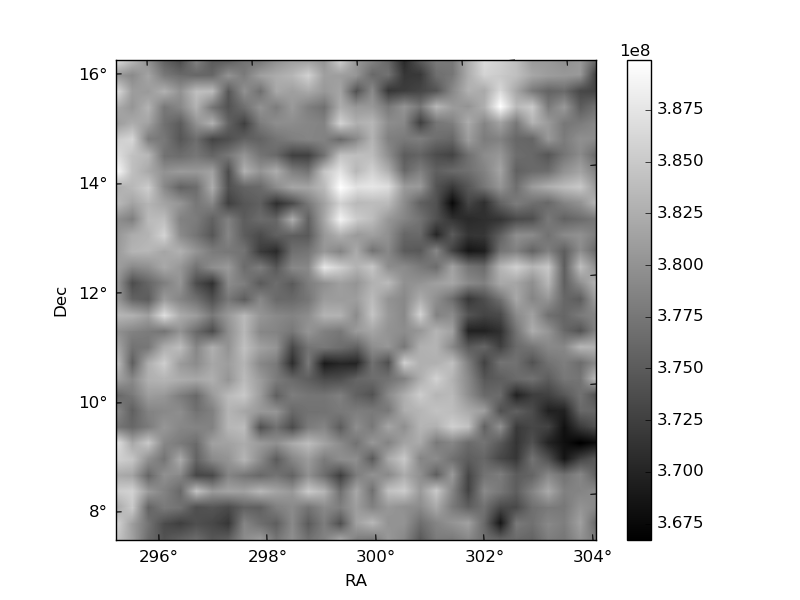
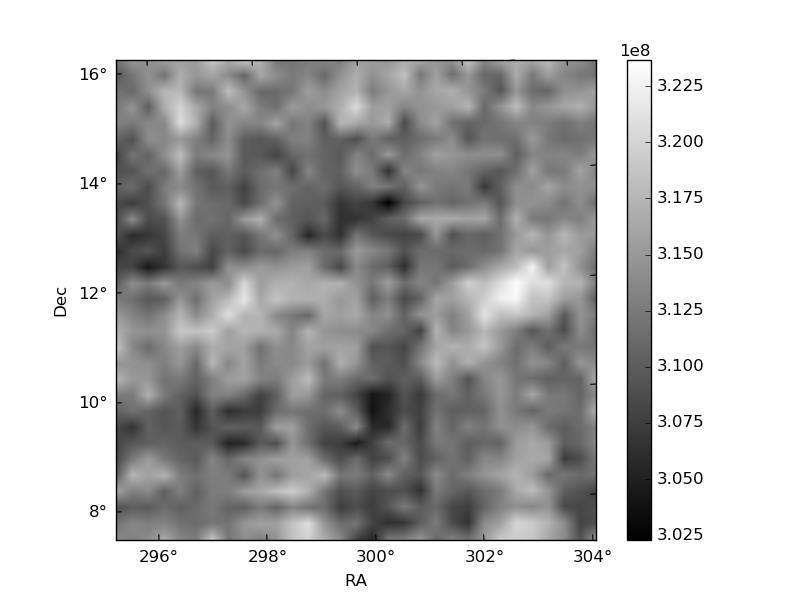
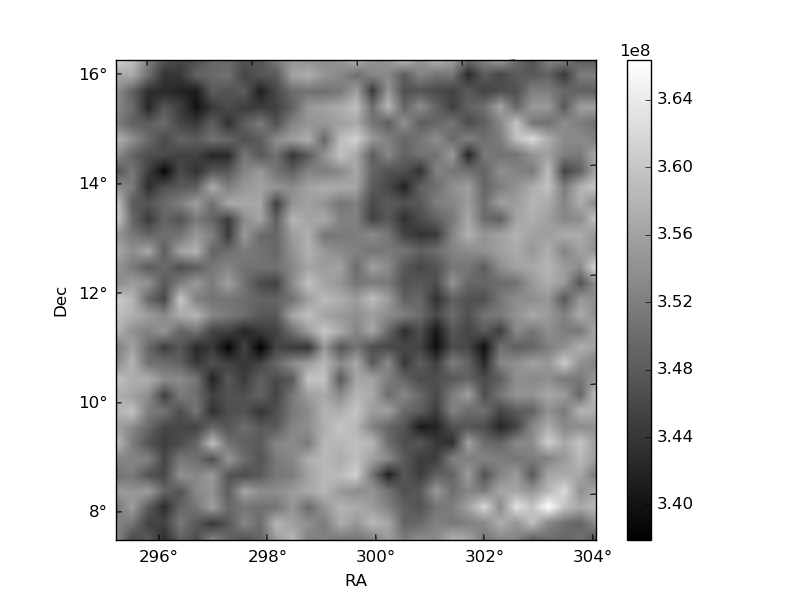
Histogram calculated using DETX and DETY for each event in the final _common_clean file
| Quadrant A | 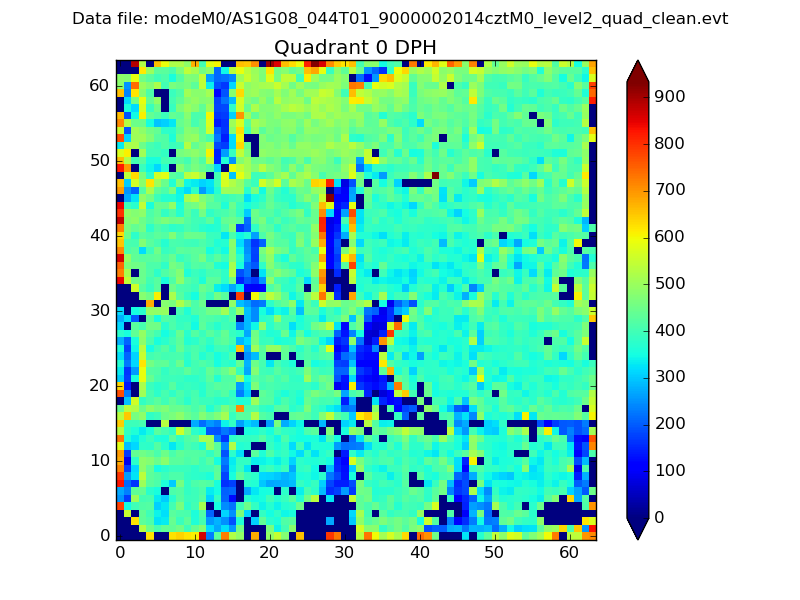 |
 |
Quadrant B |
|---|---|---|---|
| Quadrant D | 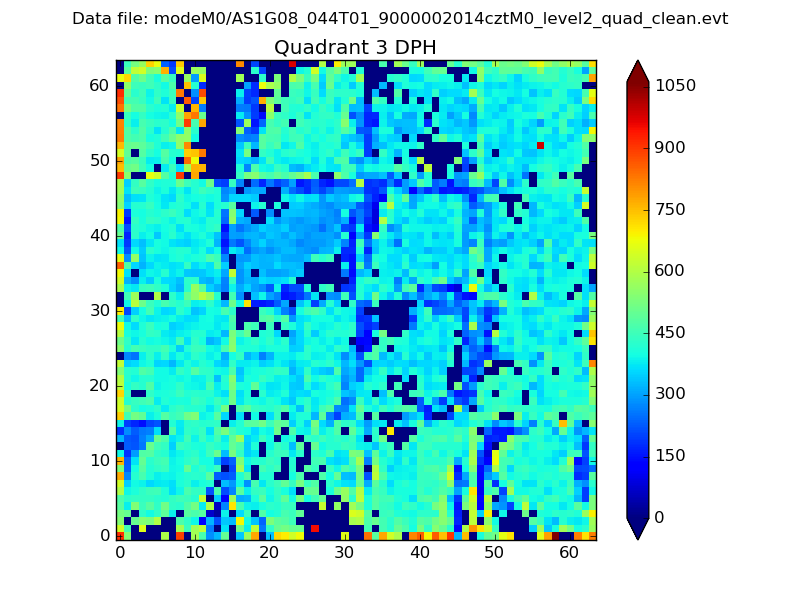 |
 |
Quadrant C |
| Plot type | Count rate plots | Images |
|---|---|---|
| Comparison with Poisson distribution Blue bars denote a histogram of data divided into 1 sec bins. Red curve is a Poisson curve with rate = median count rate of data. |
 |
 |
| Quadrant-wise count rates Data is divided into 100 sec bins |
 |
|
| Module-wise count rates for Quadrant A Data is divided into 100 sec bins |
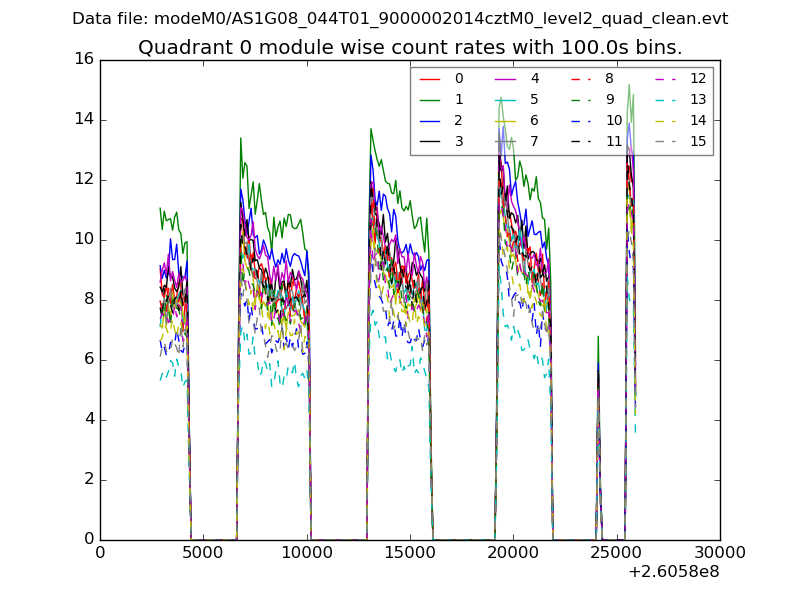 |
 |
| Module-wise count rates for Quadrant B Data is divided into 100 sec bins |
 |
 |
| Module-wise count rates for Quadrant C Data is divided into 100 sec bins |
 |
 |
| Module-wise count rates for Quadrant D Data is divided into 100 sec bins |
 |
 |
| Parameter | Plot |
|---|---|
| CZT HV Monitor | 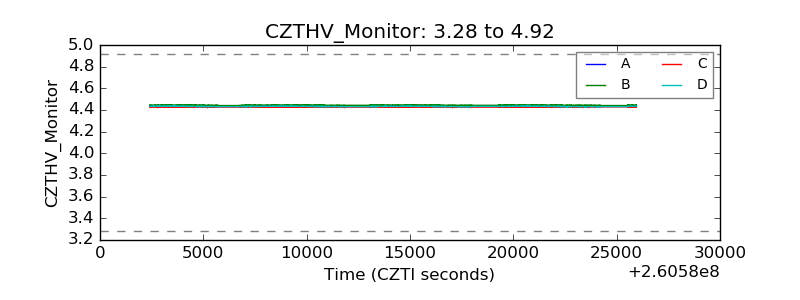 |
| D_VDD | 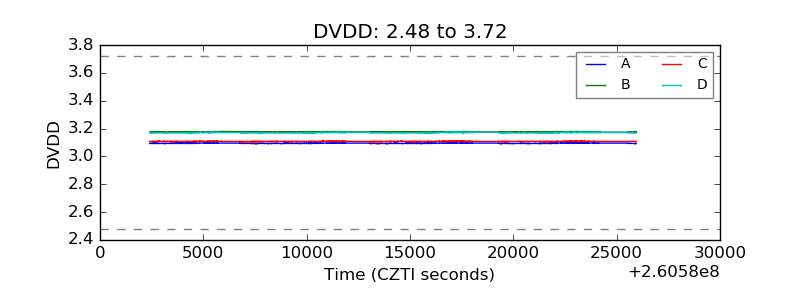 |
| Temperature 1 | 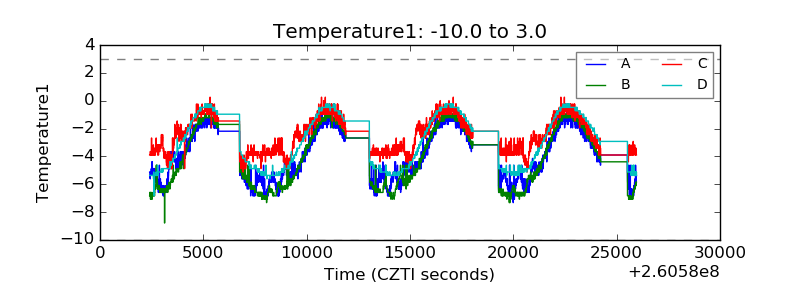 |
| Veto HV Monitor |  |
| Veto LLD | 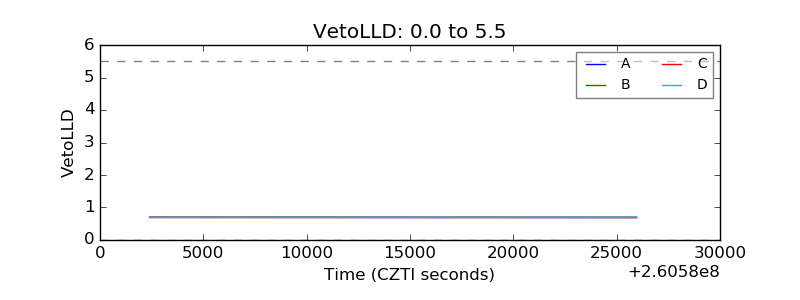 |
| Alpha Counter |  |
| _CPM_Rate | 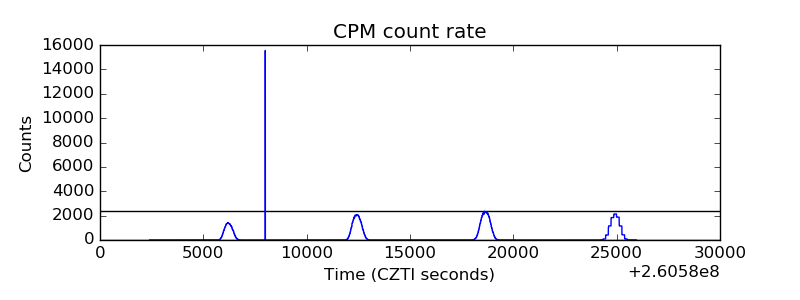 |
| CZT Counter |  |
| +2.5 Volts monitor |  |
| +5 Volts monitor | 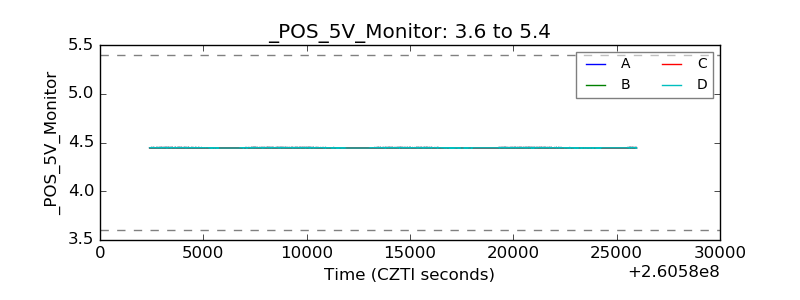 |
| _ROLL_ROT | 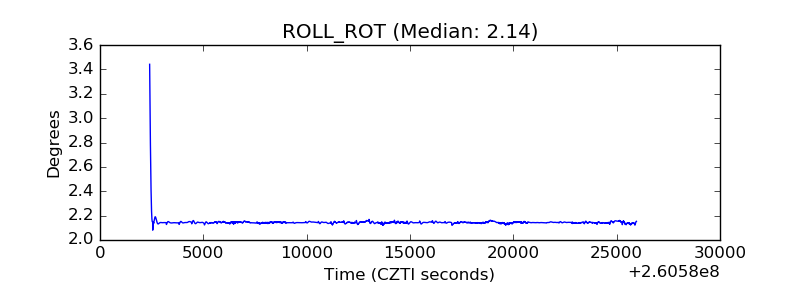 |
| _Roll_DEC | 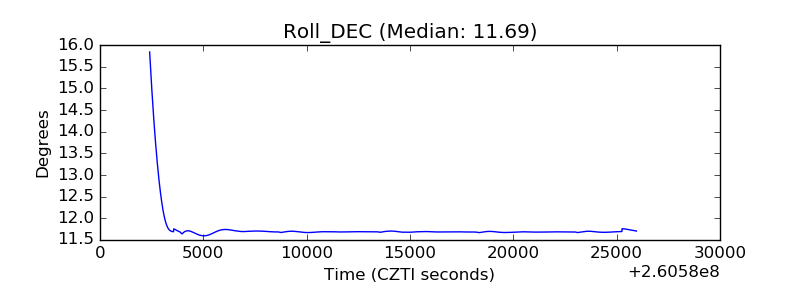 |
| _Roll_RA |  |
| Veto Counter |  |