| Param | Original file | Final file |
|---|---|---|
| Filename | modeM0/AS1G08_044T01_9000002014_13615cztM0_level2.evt | modeM0/AS1G08_044T01_9000002014_13615cztM0_level2_quad_clean.evt |
| Size (bytes) | 325,425,600 | 67,616,640 |
| Size | 310.4 MB | 64.5 MB |
| Events in quadrant A | 2,255,639 | 440,042 |
| Events in quadrant B | 2,474,154 | 431,356 |
| Events in quadrant C | 2,298,442 | 422,877 |
| Events in quadrant D | 2,502,317 | 418,397 |
| Mode SS | |||
|---|---|---|---|
| Quadrant | BADHDUFLAG | Total packets | Discarded packets |
| A | 0 | 96 | 0 |
| B | 0 | 96 | 0 |
| C | 0 | 96 | 0 |
| D | 0 | 96 | 0 |
| Mode M9 | |||
|---|---|---|---|
| Quadrant | BADHDUFLAG | Total packets | Discarded packets |
| A | 0 | 10 | 0 |
| B | 0 | 10 | 0 |
| C | 0 | 10 | 0 |
| D | 0 | 10 | 0 |
| Mode M0 | |||
|---|---|---|---|
| Quadrant | BADHDUFLAG | Total packets | Discarded packets |
| A | 0 | 9865 | 2 |
| B | 0 | 10641 | 1 |
| C | 0 | 9886 | 1 |
| D | 0 | 10650 | 1 |
| Quadrant | Total seconds | Saturated seconds | Saturation percentage |
|---|---|---|---|
| A | 4771 | 11 | 0.230560% |
| B | 4771 | 31 | 0.649759% |
| C | 4771 | 9 | 0.188640% |
| D | 4771 | 31 | 0.649759% |
Noise dominated data is calculated using 1-second bins in cleaned event files. If a bin has >2000 counts, and if more than 50% of those come from <1% of pixels, then it is considered to be noise-dominated and hence unusable.
| Quadrant | # 1 sec bins | Bins with >0 counts | Bins with >2000 counts | High rate bins dominated by noise | Noise dominated (total time) | Noise dominated (detector-on time) | Marked lightcurve |
|---|---|---|---|---|---|---|---|
| A | 5787 | 4773 | 0 | 0 | 0.00% | 0.00% | 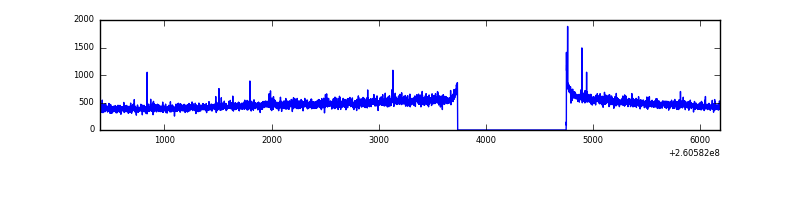 |
| B | 5787 | 4773 | 0 | 0 | 0.00% | 0.00% | 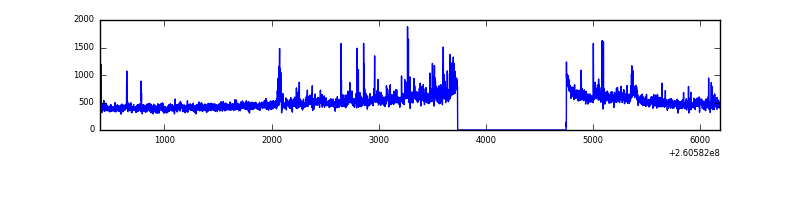 |
| C | 5787 | 4773 | 0 | 0 | 0.00% | 0.00% | 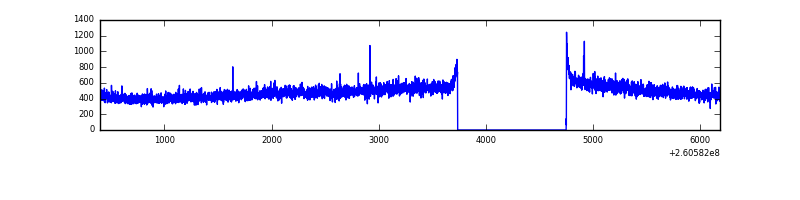 |
| D | 5787 | 4773 | 18 | 18 | 0.31% | 0.38% | 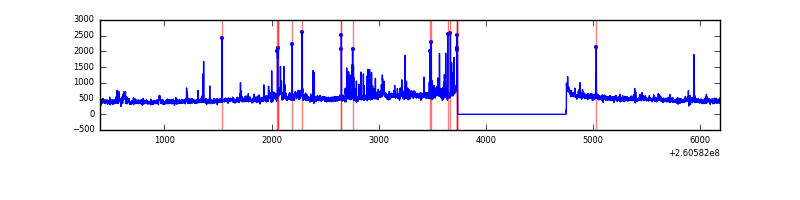 |
Top three noisy pixels from each quadrant. If the there are fewer than three noisy pixels in the level2.evt file, extra rows are filled as -1
| Pixel properties | Quadrant properties | ||||||
|---|---|---|---|---|---|---|---|
| Quadrant | DetID | PixID | Counts | Sigma | Mean | Median | Sigma |
| A | 1 | 162 | 14758 | 119.49 | 578 | 565 | 118.8 |
| A | 15 | 69 | 7390 | 57.46 | 578 | 565 | 118.8 |
| A | 0 | 226 | 5231 | 39.28 | 578 | 565 | 118.8 |
| B | 0 | 219 | 74597 | 665.92 | 574 | 561 | 111.2 |
| B | 0 | 189 | 72958 | 651.18 | 574 | 561 | 111.2 |
| B | 0 | 214 | 32528 | 287.53 | 574 | 561 | 111.2 |
| C | 3 | 233 | 134974 | 1036.7 | 554 | 557 | 129.7 |
| C | 13 | 61 | 3961 | 26.25 | 554 | 557 | 129.7 |
| C | 14 | 234 | 3075 | 19.42 | 554 | 557 | 129.7 |
| D | 8 | 195 | 177871 | 1323.08 | 555 | 539 | 134.0 |
| D | 5 | 222 | 134547 | 999.84 | 555 | 539 | 134.0 |
| D | 13 | 249 | 30382 | 222.66 | 555 | 539 | 134.0 |
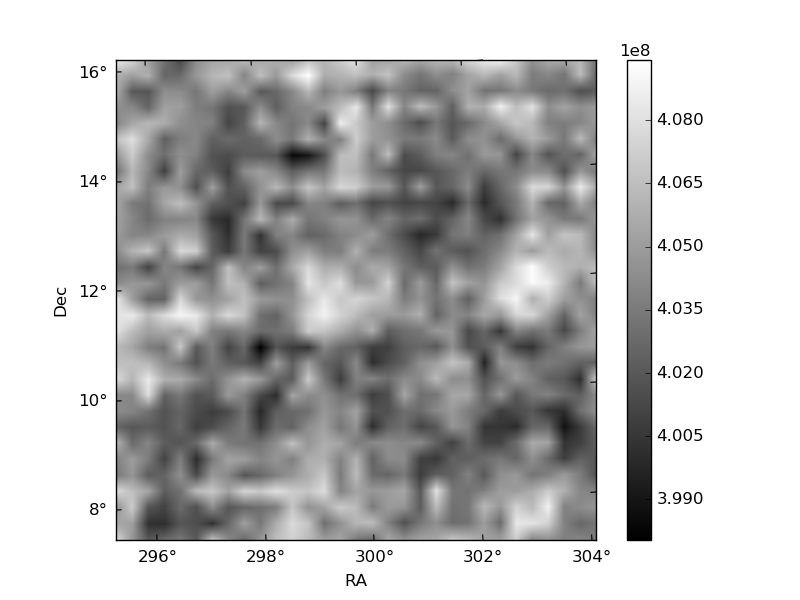
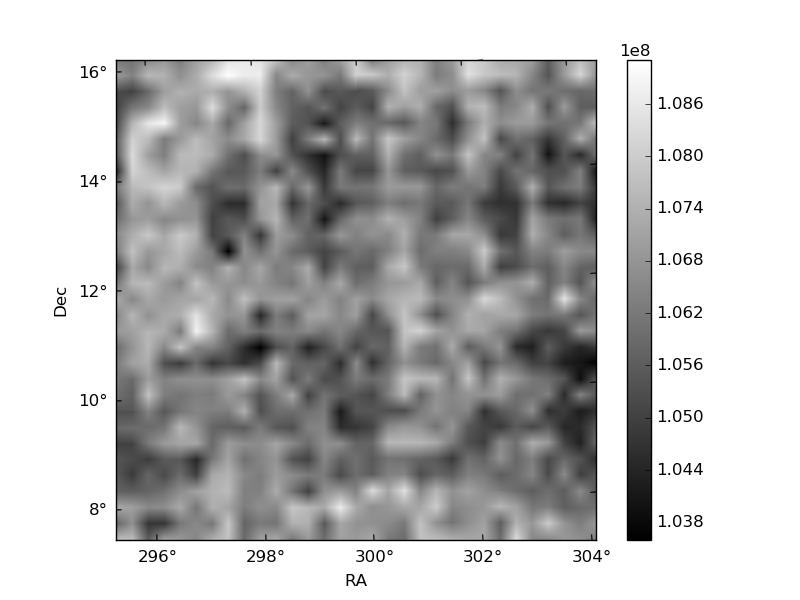
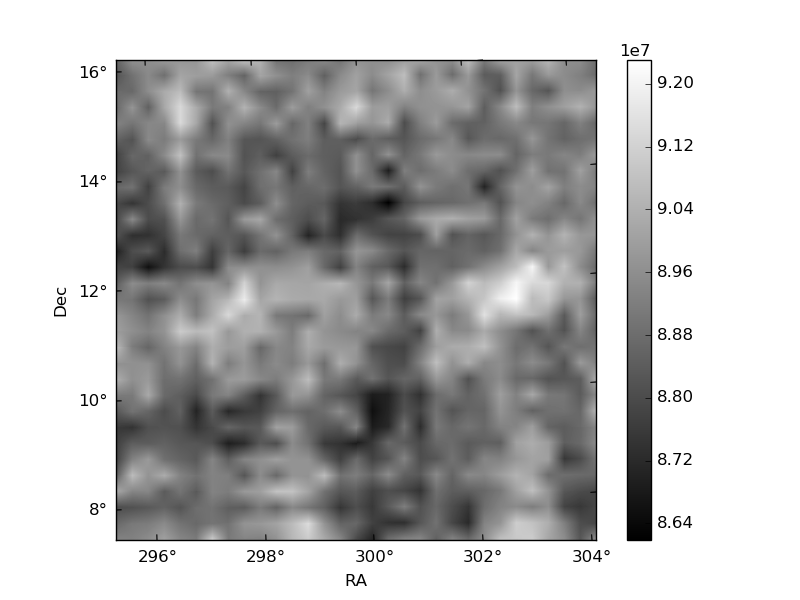
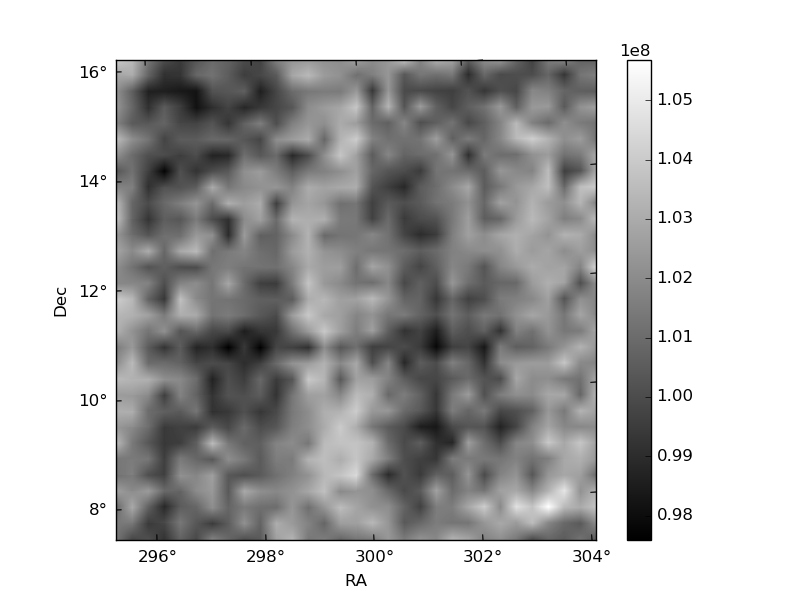
Histogram calculated using DETX and DETY for each event in the final _common_clean file
| Quadrant A | 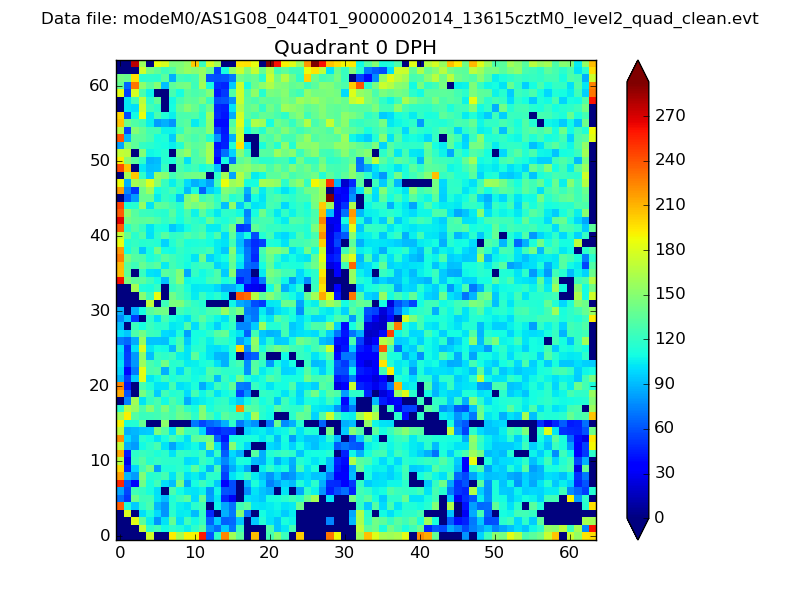 |
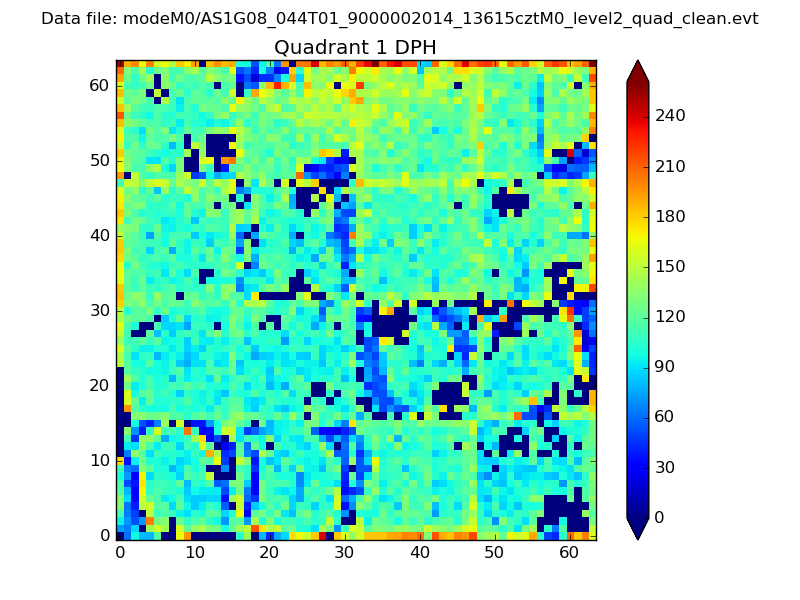 |
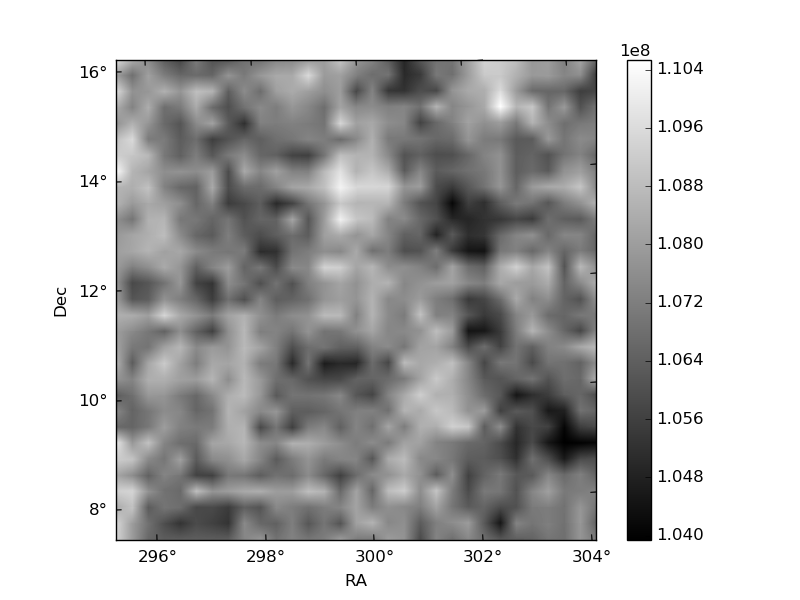
Quadrant B |
|---|---|---|---|
| Quadrant D | 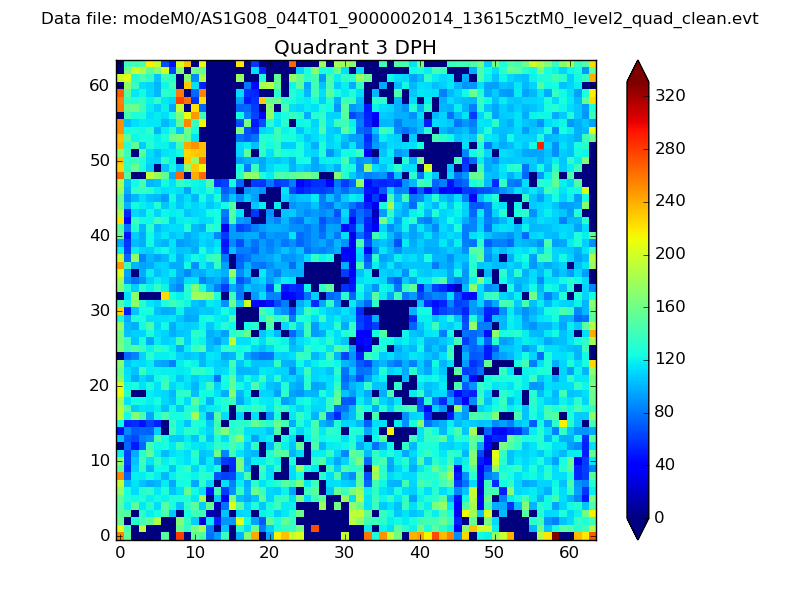 |
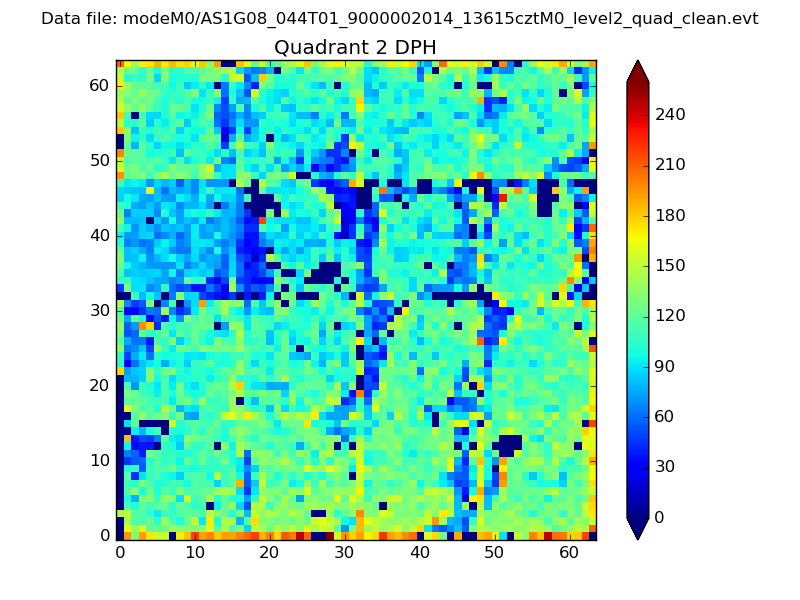 |
Quadrant C |
| Plot type | Count rate plots | Images |
|---|---|---|
| Comparison with Poisson distribution Blue bars denote a histogram of data divided into 1 sec bins. Red curve is a Poisson curve with rate = median count rate of data. |
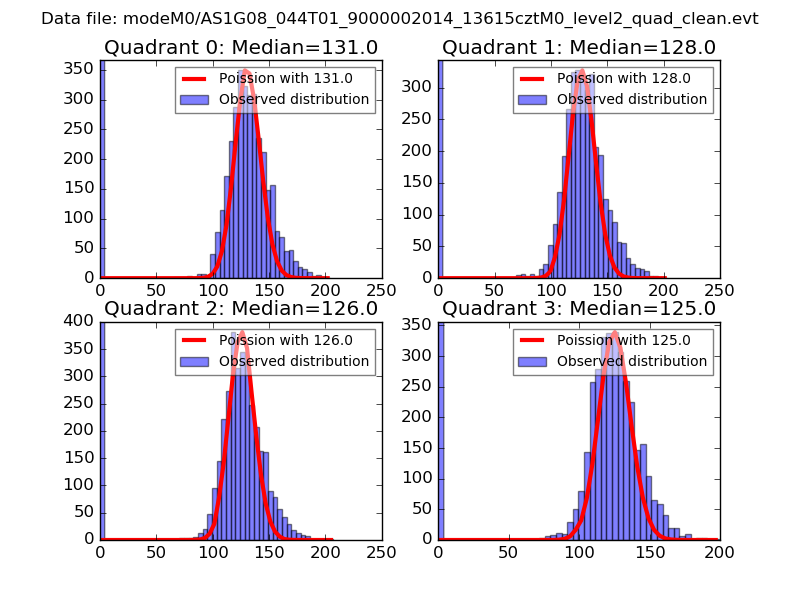 |
 |
| Quadrant-wise count rates Data is divided into 100 sec bins |
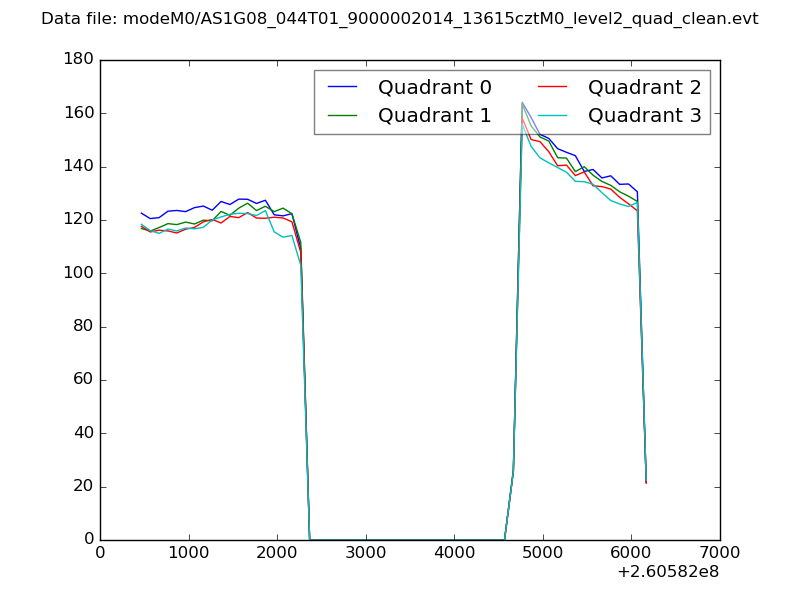 |
|
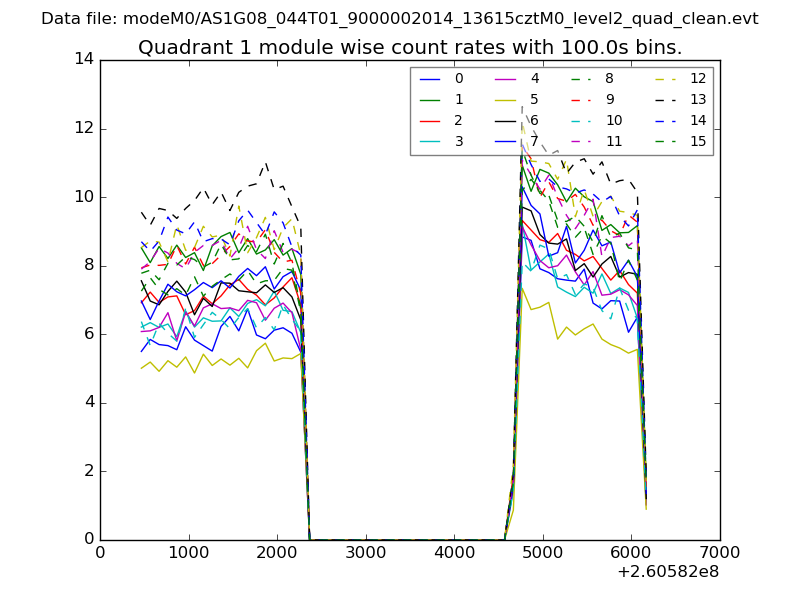
| Module-wise count rates for Quadrant A Data is divided into 100 sec bins |
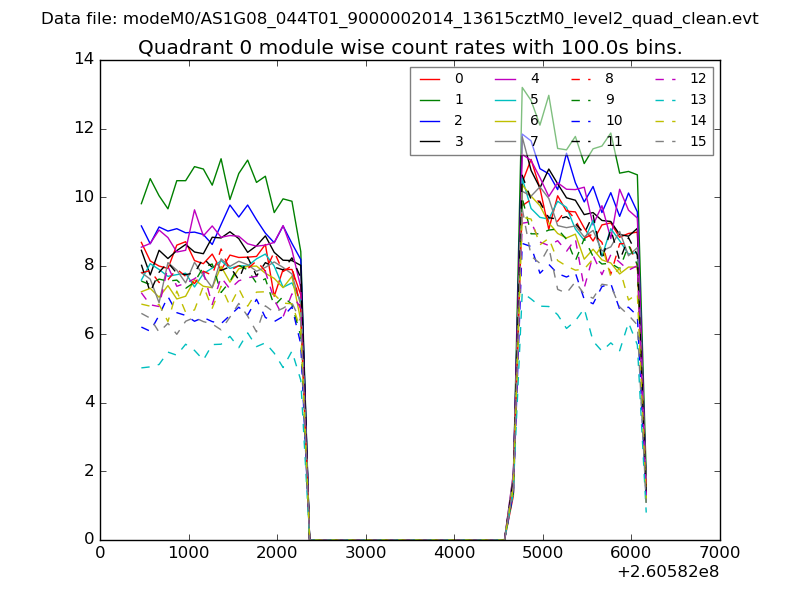 |
 |
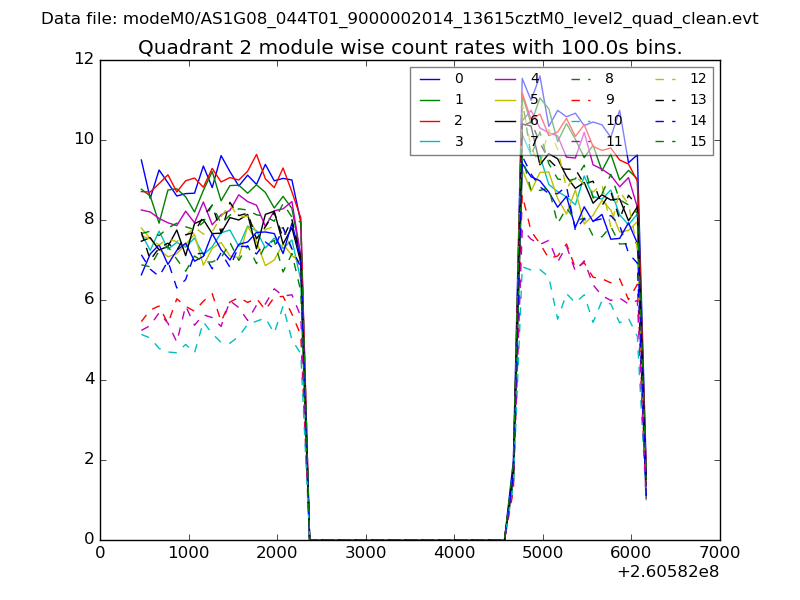
| Module-wise count rates for Quadrant B Data is divided into 100 sec bins |
 |
 |
| Module-wise count rates for Quadrant C Data is divided into 100 sec bins |
 |
 |
| Module-wise count rates for Quadrant D Data is divided into 100 sec bins |
 |
 |
| Parameter | Plot |
|---|---|
| CZT HV Monitor | 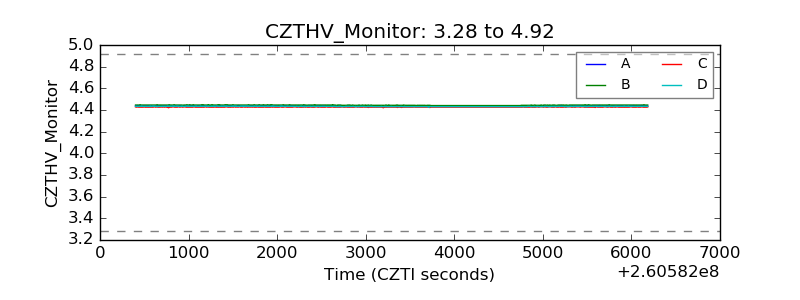 |
| D_VDD | 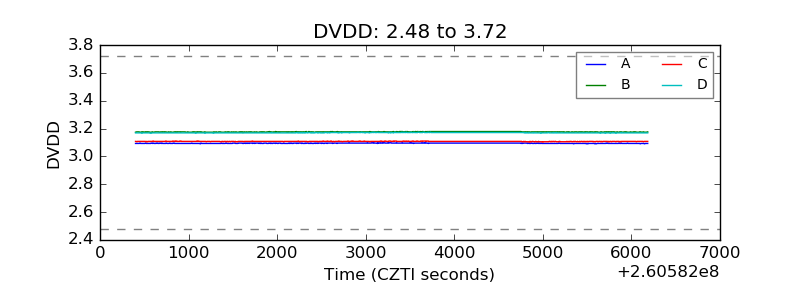 |
| Temperature 1 | 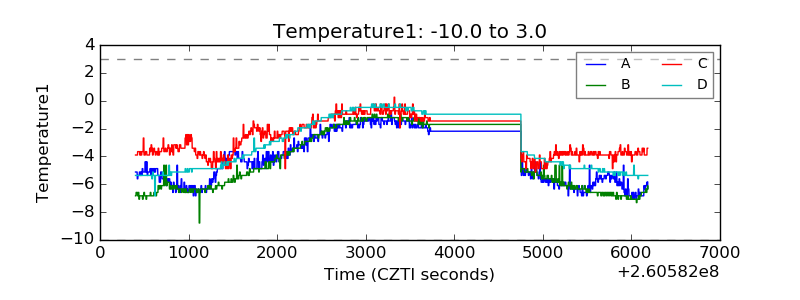 |
| Veto HV Monitor | 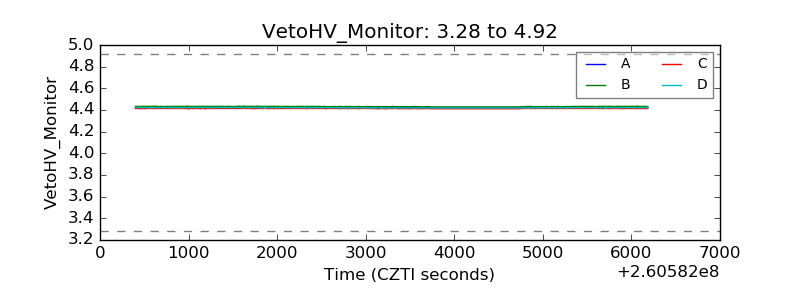 |
| Veto LLD | 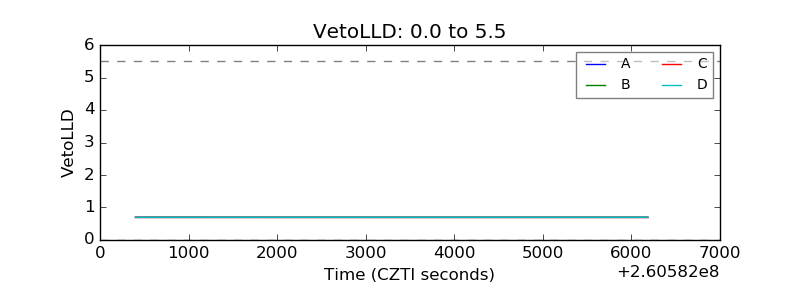 |
| Alpha Counter | 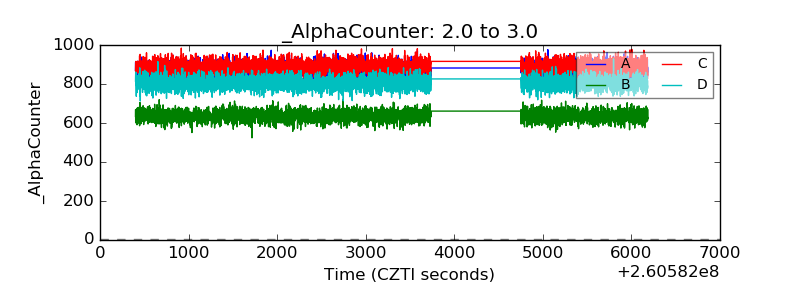 |
| _CPM_Rate | 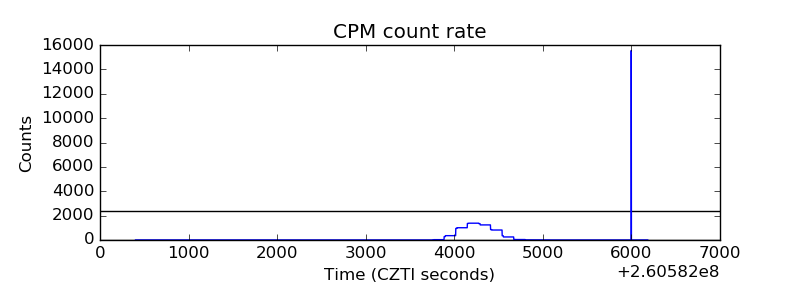 |
| CZT Counter | 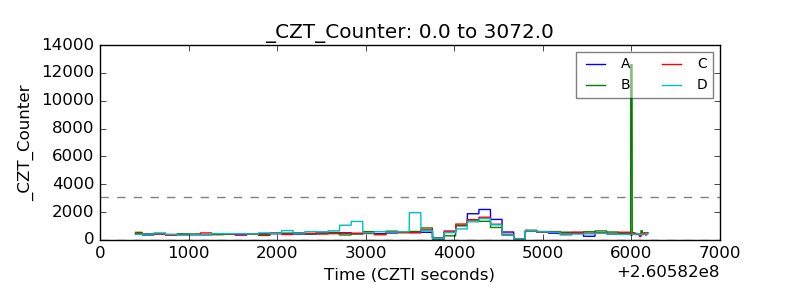 |
| +2.5 Volts monitor |  |
| +5 Volts monitor | 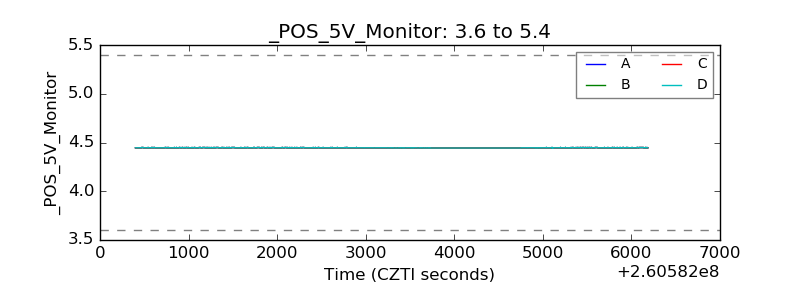 |
| _ROLL_ROT | 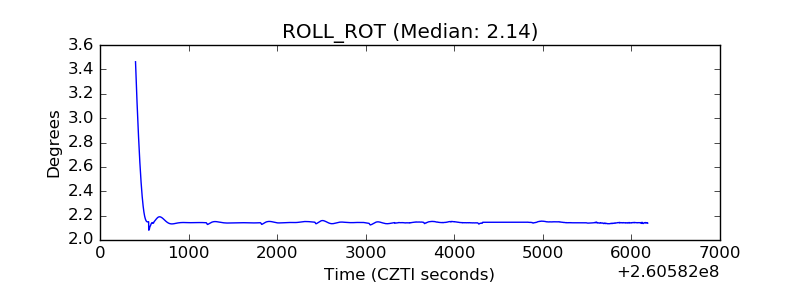 |
| _Roll_DEC | 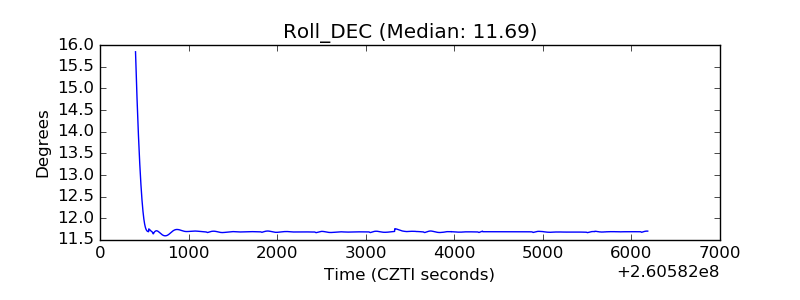 |
| _Roll_RA | 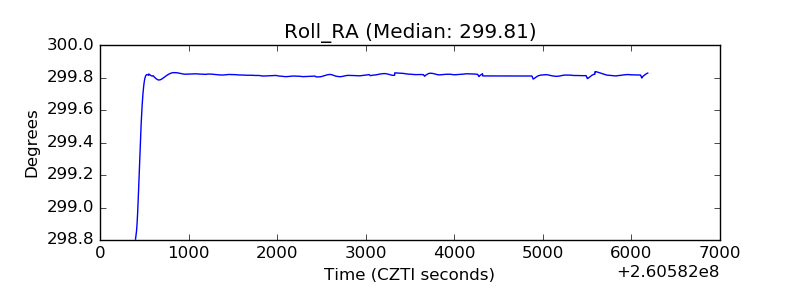 |
| Veto Counter |  |