| Param | Original file | Final file |
|---|---|---|
| Filename | modeM0/AS1G08_044T01_9000002014_13617cztM0_level2.evt | modeM0/AS1G08_044T01_9000002014_13617cztM0_level2_quad_clean.evt |
| Size (bytes) | 453,850,560 | 98,461,440 |
| Size | 432.8 MB | 93.9 MB |
| Events in quadrant A | 3,164,299 | 649,630 |
| Events in quadrant B | 3,482,045 | 644,145 |
| Events in quadrant C | 3,151,434 | 628,963 |
| Events in quadrant D | 3,512,634 | 613,080 |
| Mode SS | |||
|---|---|---|---|
| Quadrant | BADHDUFLAG | Total packets | Discarded packets |
| A | 0 | 130 | 0 |
| B | 0 | 130 | 0 |
| C | 0 | 130 | 0 |
| D | 0 | 130 | 0 |
| Mode M9 | |||
|---|---|---|---|
| Quadrant | BADHDUFLAG | Total packets | Discarded packets |
| A | 0 | 16 | 0 |
| B | 0 | 16 | 0 |
| C | 0 | 16 | 0 |
| D | 0 | 17 | 0 |
| Mode M0 | |||
|---|---|---|---|
| Quadrant | BADHDUFLAG | Total packets | Discarded packets |
| A | 0 | 13584 | 3 |
| B | 0 | 14667 | 2 |
| C | 0 | 13389 | 2 |
| D | 0 | 14630 | 2 |
| Quadrant | Total seconds | Saturated seconds | Saturation percentage |
|---|---|---|---|
| A | 6395 | 61 | 0.953870% |
| B | 6395 | 80 | 1.250977% |
| C | 6395 | 26 | 0.406568% |
| D | 6395 | 42 | 0.656763% |
Noise dominated data is calculated using 1-second bins in cleaned event files. If a bin has >2000 counts, and if more than 50% of those come from <1% of pixels, then it is considered to be noise-dominated and hence unusable.
| Quadrant | # 1 sec bins | Bins with >0 counts | Bins with >2000 counts | High rate bins dominated by noise | Noise dominated (total time) | Noise dominated (detector-on time) | Marked lightcurve |
|---|---|---|---|---|---|---|---|
| A | 7531 | 6397 | 17 | 17 | 0.23% | 0.27% | 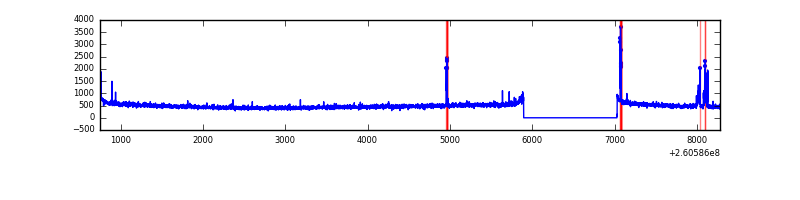 |
| B | 7531 | 6397 | 6 | 6 | 0.08% | 0.09% | 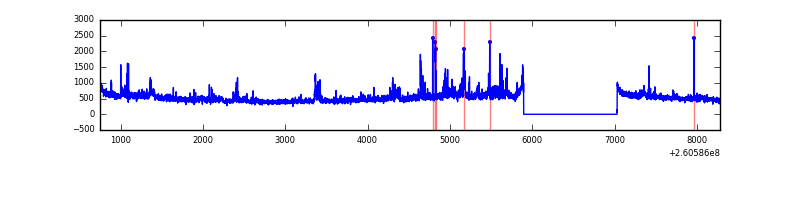 |
| C | 7531 | 6397 | 0 | 0 | 0.00% | 0.00% | 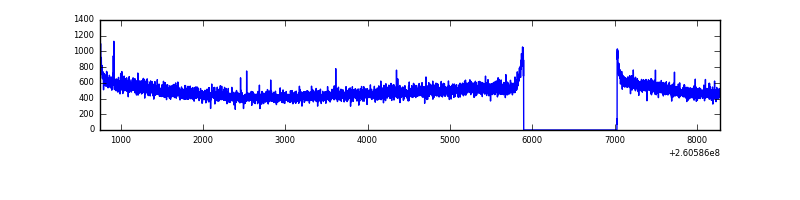 |
| D | 7531 | 6397 | 17 | 17 | 0.23% | 0.27% | 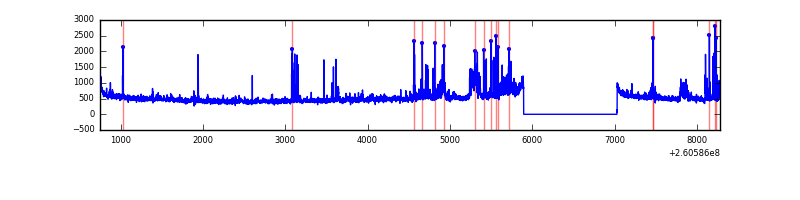 |
Top three noisy pixels from each quadrant. If the there are fewer than three noisy pixels in the level2.evt file, extra rows are filled as -1
| Pixel properties | Quadrant properties | ||||||
|---|---|---|---|---|---|---|---|
| Quadrant | DetID | PixID | Counts | Sigma | Mean | Median | Sigma |
| A | 3 | 0 | 55287 | 341.77 | 790 | 775 | 159.5 |
| A | 15 | 69 | 54069 | 334.14 | 790 | 775 | 159.5 |
| A | 1 | 162 | 13537 | 80.01 | 790 | 775 | 159.5 |
| B | 0 | 219 | 209142 | 1385.39 | 791 | 771 | 150.4 |
| B | 0 | 85 | 62907 | 413.12 | 791 | 771 | 150.4 |
| B | 0 | 214 | 41380 | 270.0 | 791 | 771 | 150.4 |
| C | 3 | 233 | 170151 | 959.65 | 764 | 770 | 176.5 |
| C | 13 | 61 | 5492 | 26.75 | 764 | 770 | 176.5 |
| C | 14 | 234 | 3358 | 14.66 | 764 | 770 | 176.5 |
| D | 8 | 195 | 201835 | 1112.55 | 761 | 743 | 180.7 |
| D | 5 | 222 | 162868 | 896.96 | 761 | 743 | 180.7 |
| D | 12 | 6 | 112323 | 617.32 | 761 | 743 | 180.7 |
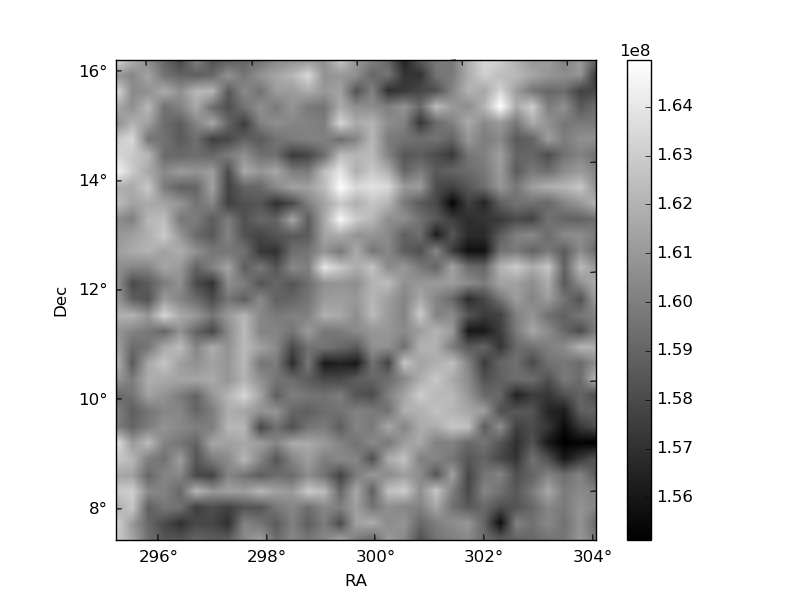
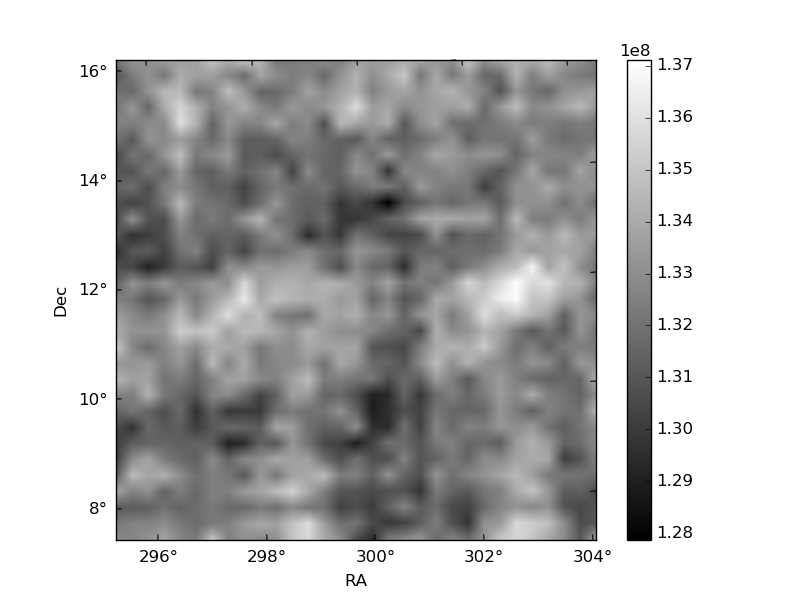
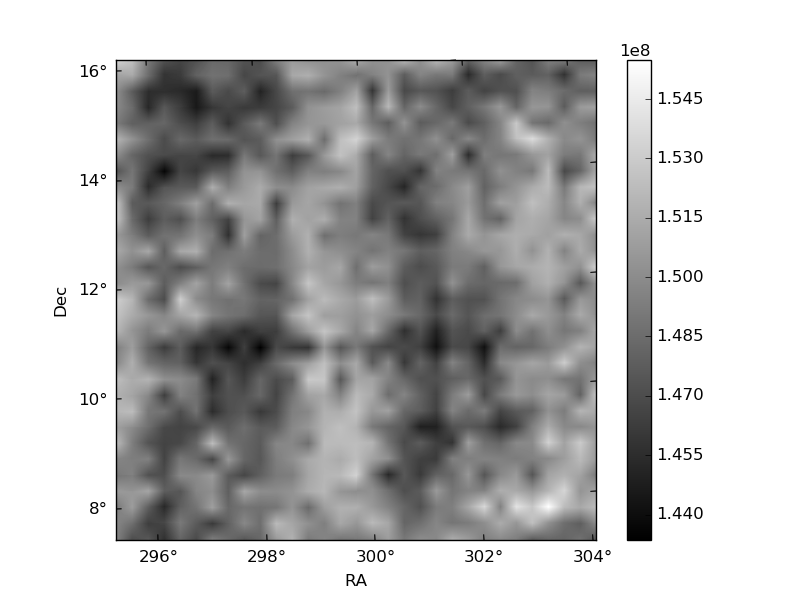
Histogram calculated using DETX and DETY for each event in the final _common_clean file
| Quadrant A | 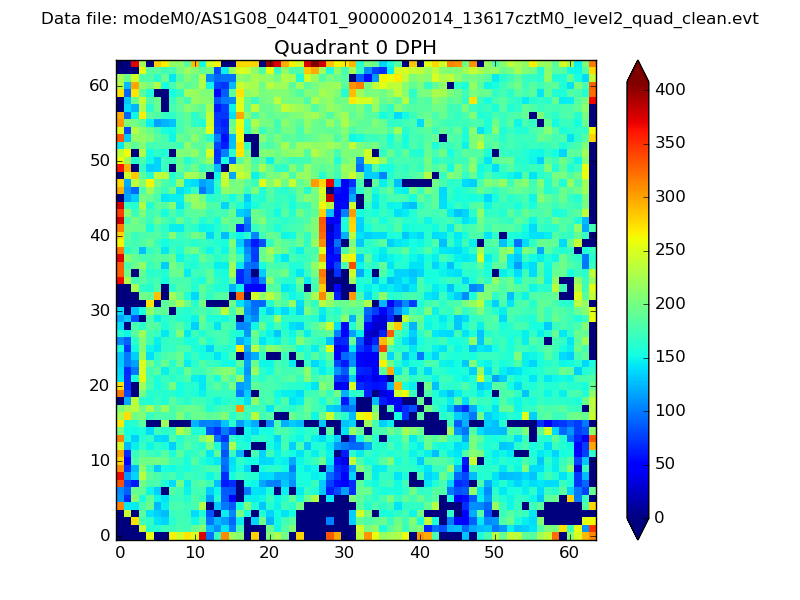 |
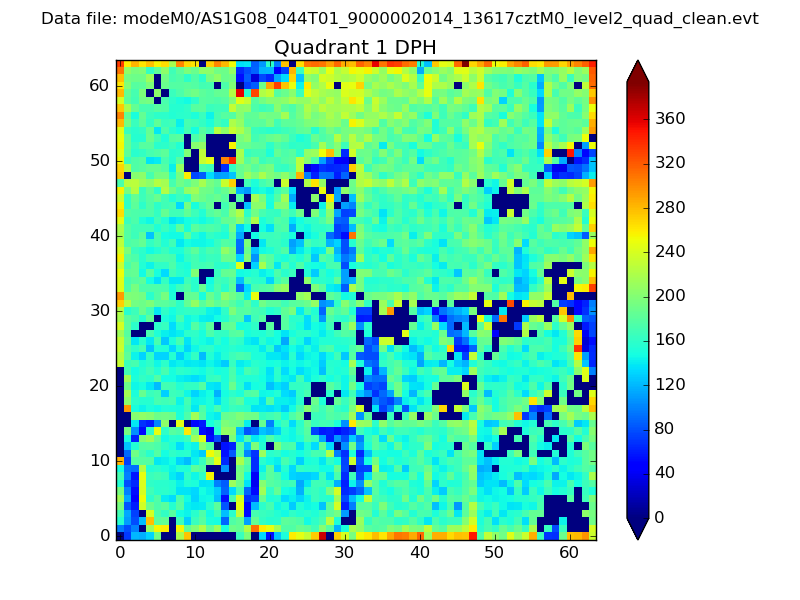 |
Quadrant B |
|---|---|---|---|
| Quadrant D | 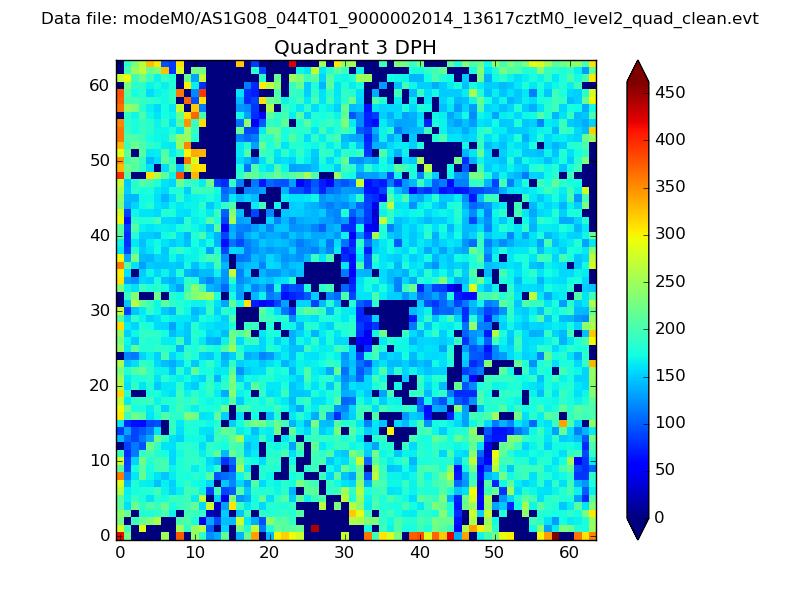 |
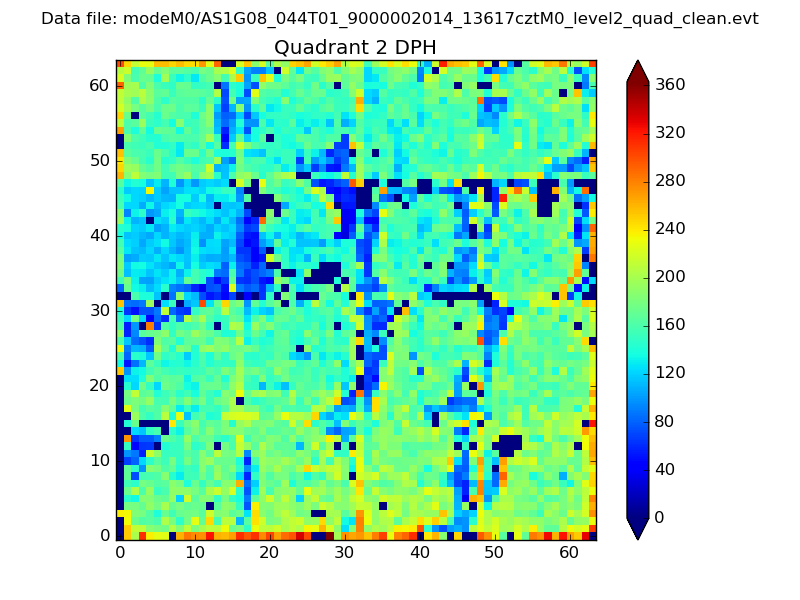 |
Quadrant C |
| Plot type | Count rate plots | Images |
|---|---|---|
| Comparison with Poisson distribution Blue bars denote a histogram of data divided into 1 sec bins. Red curve is a Poisson curve with rate = median count rate of data. |
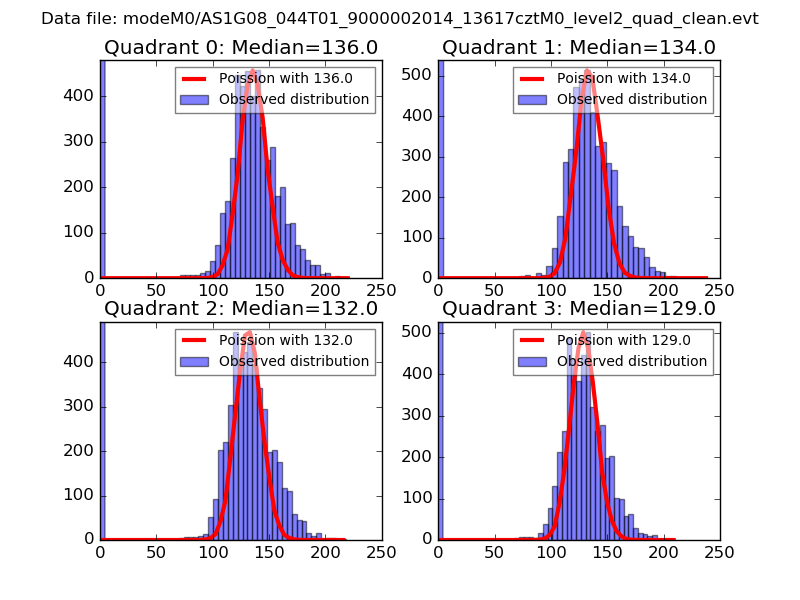 |
 |
| Quadrant-wise count rates Data is divided into 100 sec bins |
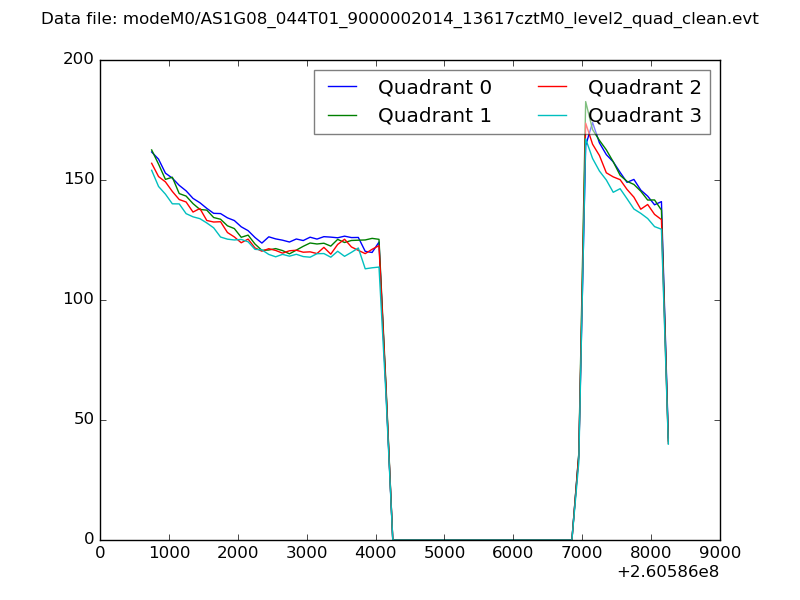 |
|
| Module-wise count rates for Quadrant A Data is divided into 100 sec bins |
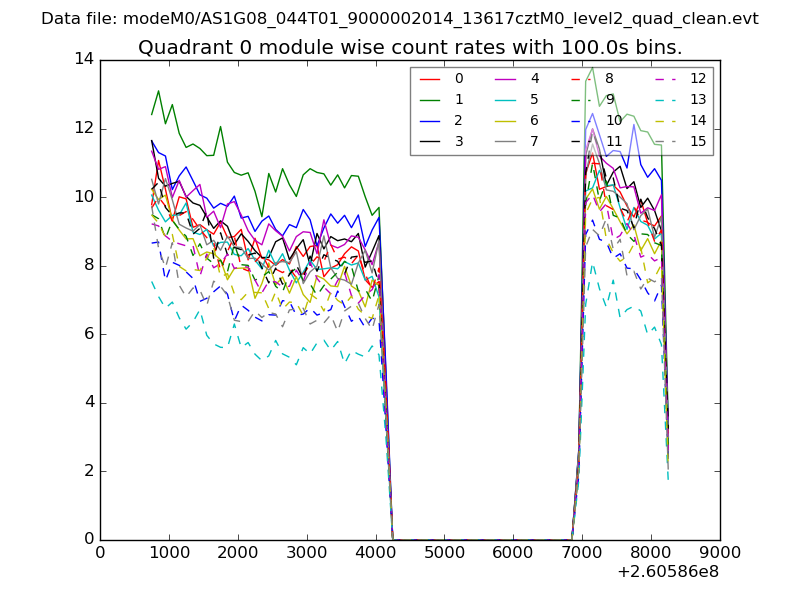 |
 |
| Module-wise count rates for Quadrant B Data is divided into 100 sec bins |
 |
 |
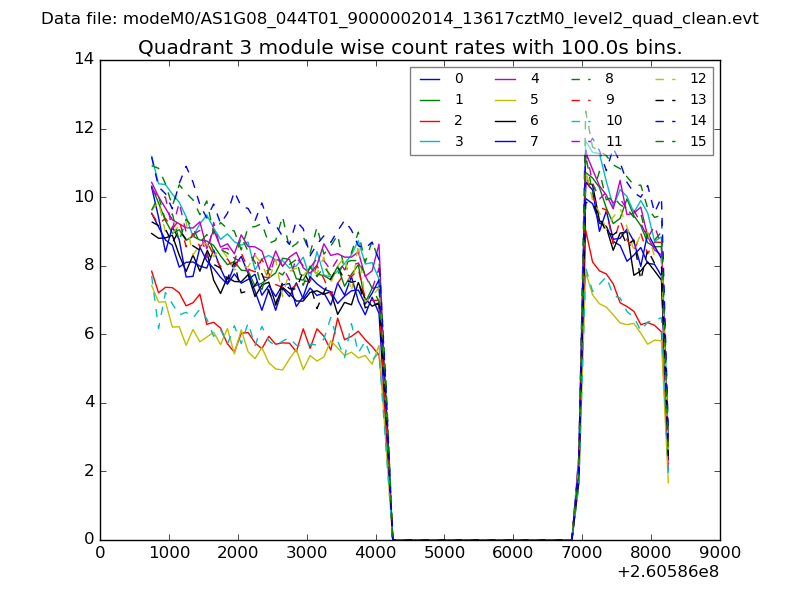
| Module-wise count rates for Quadrant C Data is divided into 100 sec bins |
 |
 |
| Module-wise count rates for Quadrant D Data is divided into 100 sec bins |
 |
 |
| Parameter | Plot |
|---|---|
| CZT HV Monitor | 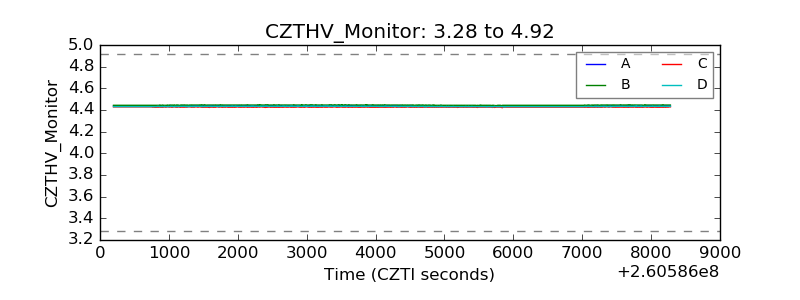 |
| D_VDD | 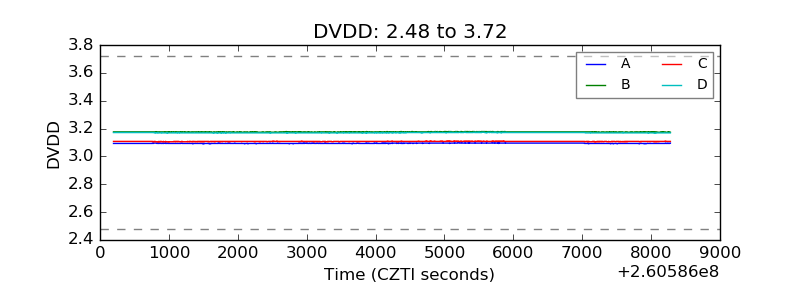 |
| Temperature 1 |  |
| Veto HV Monitor | 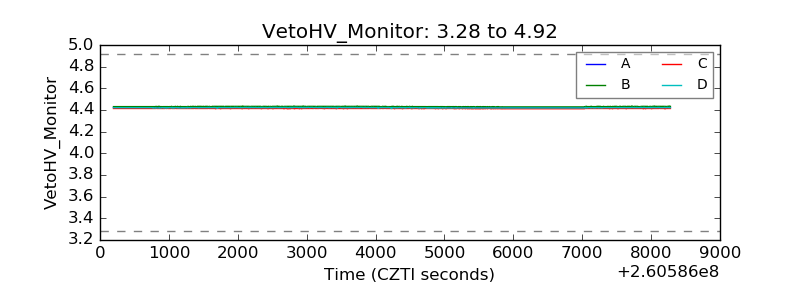 |
| Veto LLD | 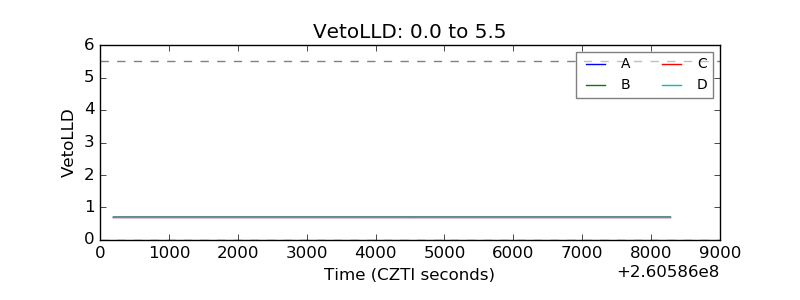 |
| Alpha Counter |  |
| _CPM_Rate | 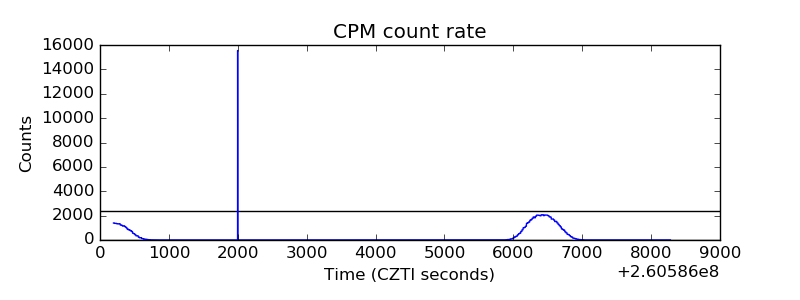 |
| CZT Counter |  |
| +2.5 Volts monitor |  |
| +5 Volts monitor | 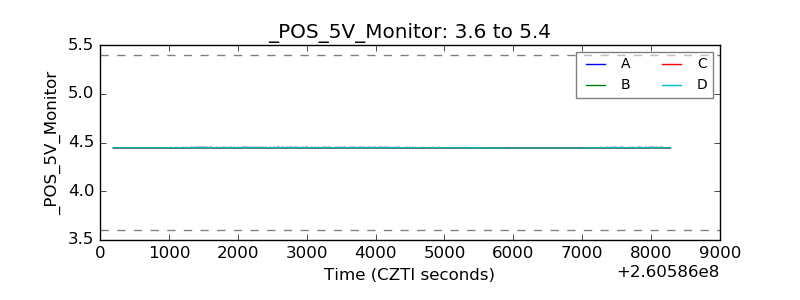 |
| _ROLL_ROT | 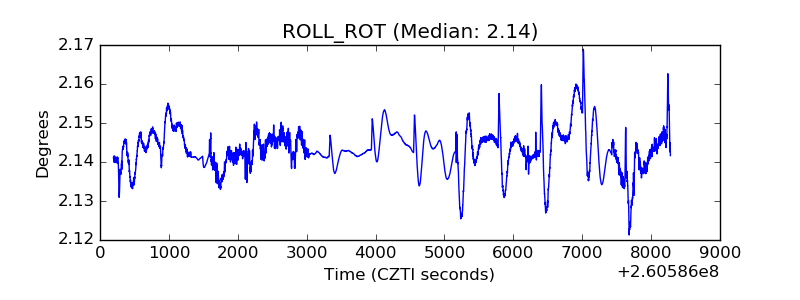 |
| _Roll_DEC | 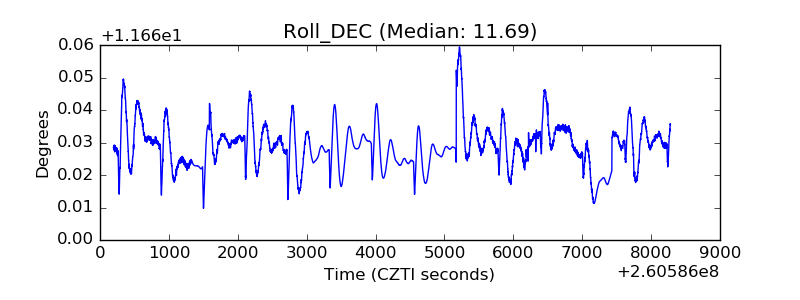 |
| _Roll_RA | 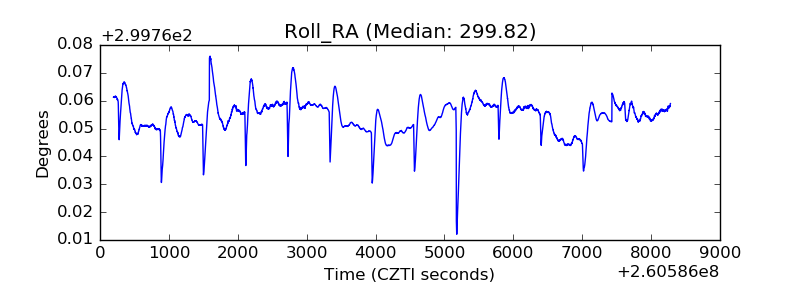 |
| Veto Counter | 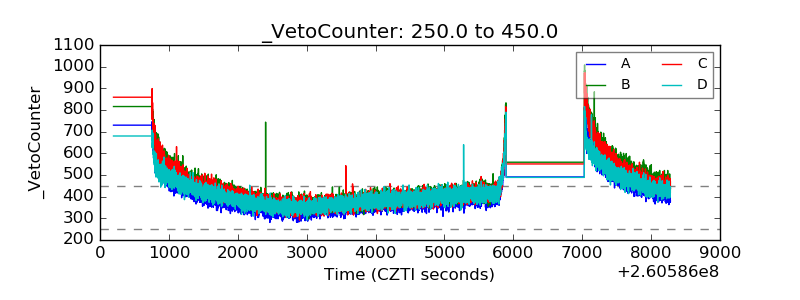 |