| Param | Original file | Final file |
|---|---|---|
| Filename | modeM0/AS1G08_044T01_9000002014_13619cztM0_level2.evt | modeM0/AS1G08_044T01_9000002014_13619cztM0_level2_quad_clean.evt |
| Size (bytes) | 393,805,440 | 58,806,720 |
| Size | 375.6 MB | 56.1 MB |
| Events in quadrant A | 2,412,851 | 375,261 |
| Events in quadrant B | 3,156,181 | 367,633 |
| Events in quadrant C | 2,437,504 | 358,908 |
| Events in quadrant D | 3,596,056 | 344,217 |
| Mode SS | |||
|---|---|---|---|
| Quadrant | BADHDUFLAG | Total packets | Discarded packets |
| A | 0 | 96 | 0 |
| B | 0 | 96 | 0 |
| C | 0 | 96 | 0 |
| D | 0 | 96 | 0 |
| Mode M9 | |||
|---|---|---|---|
| Quadrant | BADHDUFLAG | Total packets | Discarded packets |
| A | 0 | 13 | 0 |
| B | 0 | 13 | 0 |
| C | 0 | 13 | 0 |
| D | 0 | 13 | 0 |
| Mode M0 | |||
|---|---|---|---|
| Quadrant | BADHDUFLAG | Total packets | Discarded packets |
| A | 0 | 10066 | 1 |
| B | 0 | 12476 | 1 |
| C | 0 | 10065 | 1 |
| D | 0 | 13927 | 1 |
| Quadrant | Total seconds | Saturated seconds | Saturation percentage |
|---|---|---|---|
| A | 4767 | 50 | 1.048878% |
| B | 4767 | 186 | 3.901825% |
| C | 4767 | 32 | 0.671282% |
| D | 4767 | 234 | 4.908748% |
Noise dominated data is calculated using 1-second bins in cleaned event files. If a bin has >2000 counts, and if more than 50% of those come from <1% of pixels, then it is considered to be noise-dominated and hence unusable.
| Quadrant | # 1 sec bins | Bins with >0 counts | Bins with >2000 counts | High rate bins dominated by noise | Noise dominated (total time) | Noise dominated (detector-on time) | Marked lightcurve |
|---|---|---|---|---|---|---|---|
| A | 6058 | 4769 | 0 | 0 | 0.00% | 0.00% | 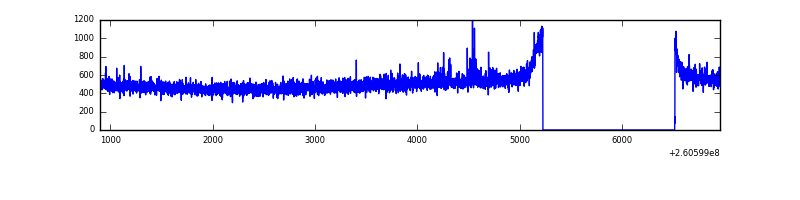 |
| B | 6058 | 4769 | 29 | 29 | 0.48% | 0.61% | 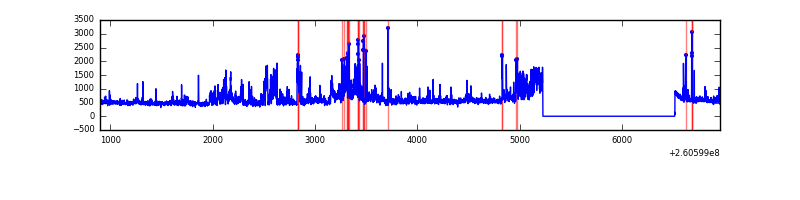 |
| C | 6058 | 4769 | 0 | 0 | 0.00% | 0.00% | 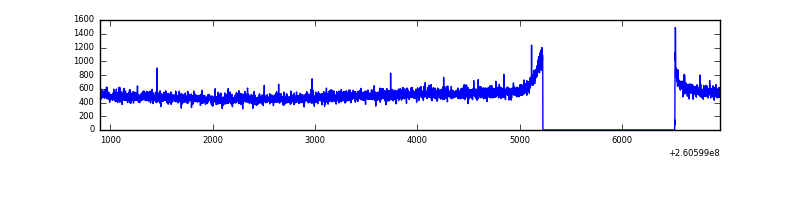 |
| D | 6058 | 4769 | 148 | 148 | 2.44% | 3.10% | 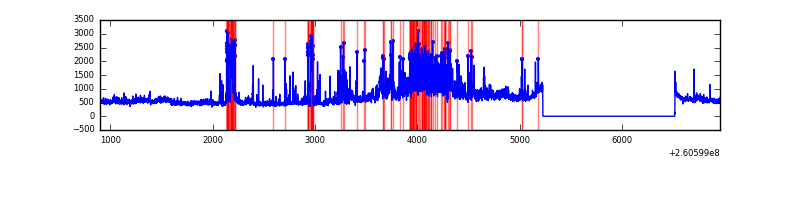 |
Top three noisy pixels from each quadrant. If the there are fewer than three noisy pixels in the level2.evt file, extra rows are filled as -1
| Pixel properties | Quadrant properties | ||||||
|---|---|---|---|---|---|---|---|
| Quadrant | DetID | PixID | Counts | Sigma | Mean | Median | Sigma |
| A | 1 | 162 | 18492 | 142.06 | 619 | 607 | 125.9 |
| A | 1 | 178 | 6618 | 47.74 | 619 | 607 | 125.9 |
| A | 1 | 161 | 6142 | 43.96 | 619 | 607 | 125.9 |
| B | 0 | 85 | 313953 | 2771.31 | 605 | 592 | 113.1 |
| B | 0 | 219 | 266547 | 2352.06 | 605 | 592 | 113.1 |
| B | 3 | 64 | 81789 | 718.09 | 605 | 592 | 113.1 |
| C | 3 | 233 | 123660 | 895.65 | 591 | 596 | 137.4 |
| C | 13 | 61 | 4370 | 27.47 | 591 | 596 | 137.4 |
| C | 12 | 4 | 3593 | 21.81 | 591 | 596 | 137.4 |
| D | 12 | 6 | 578620 | 4100.2 | 583 | 566 | 141.0 |
| D | 5 | 222 | 460610 | 3263.14 | 583 | 566 | 141.0 |
| D | 8 | 195 | 264072 | 1869.08 | 583 | 566 | 141.0 |
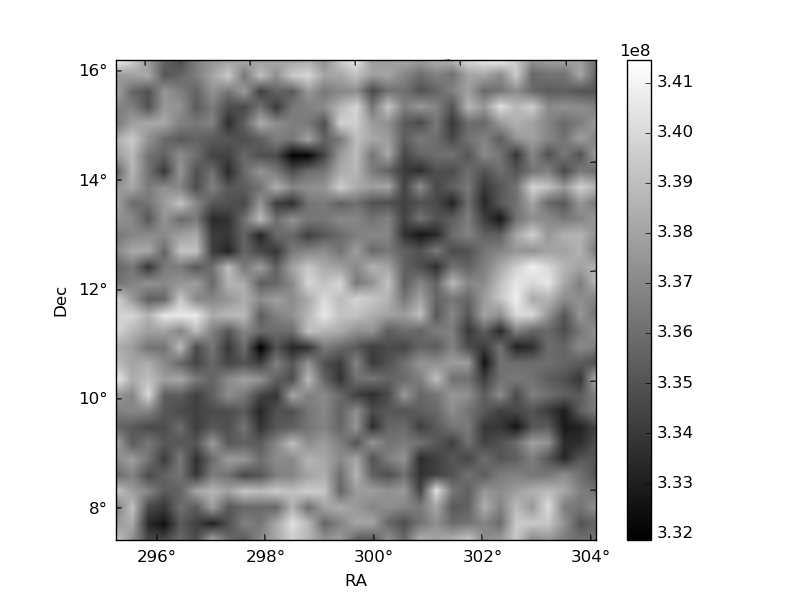
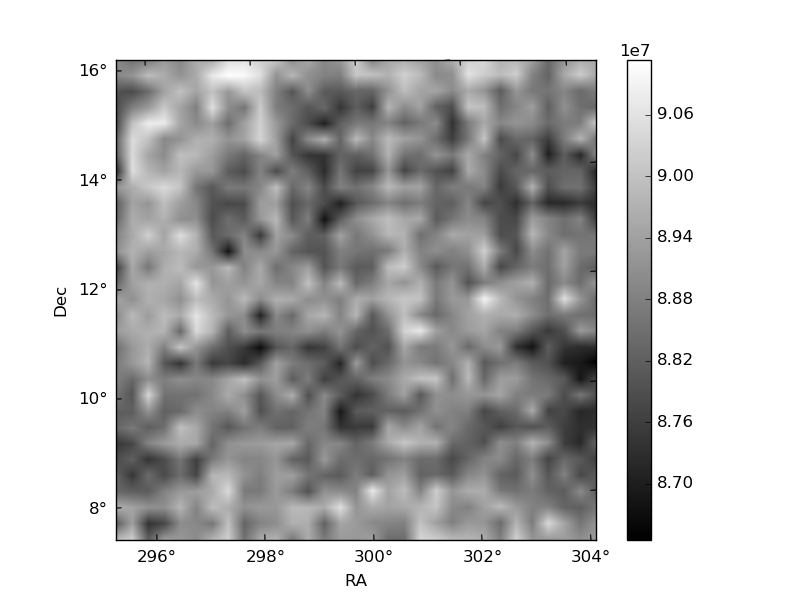
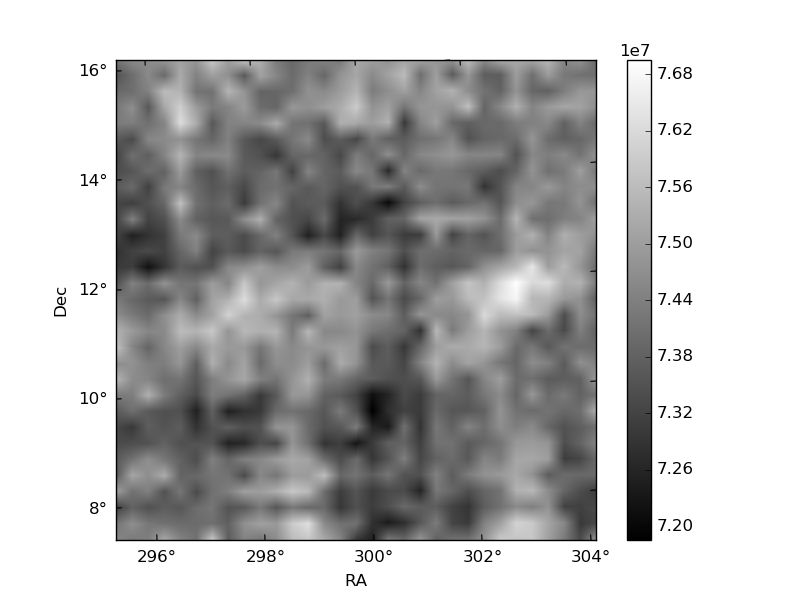
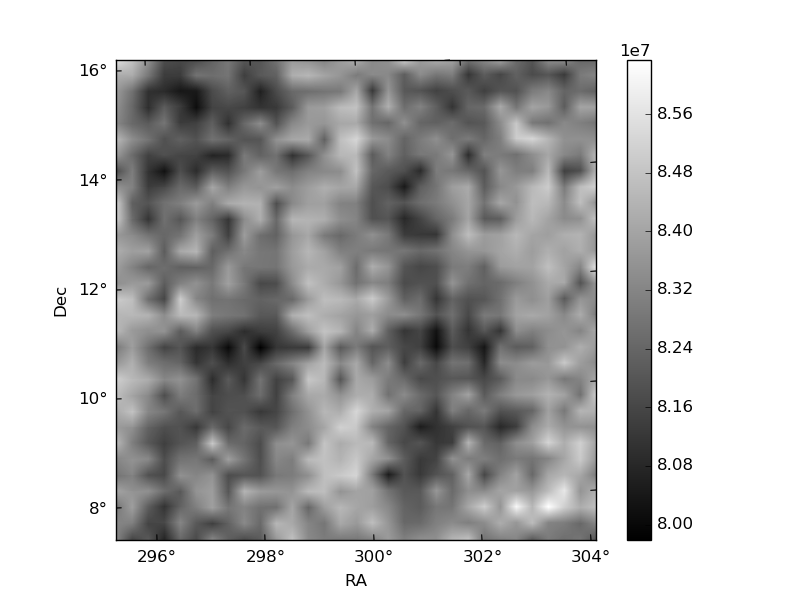
Histogram calculated using DETX and DETY for each event in the final _common_clean file
| Quadrant A | 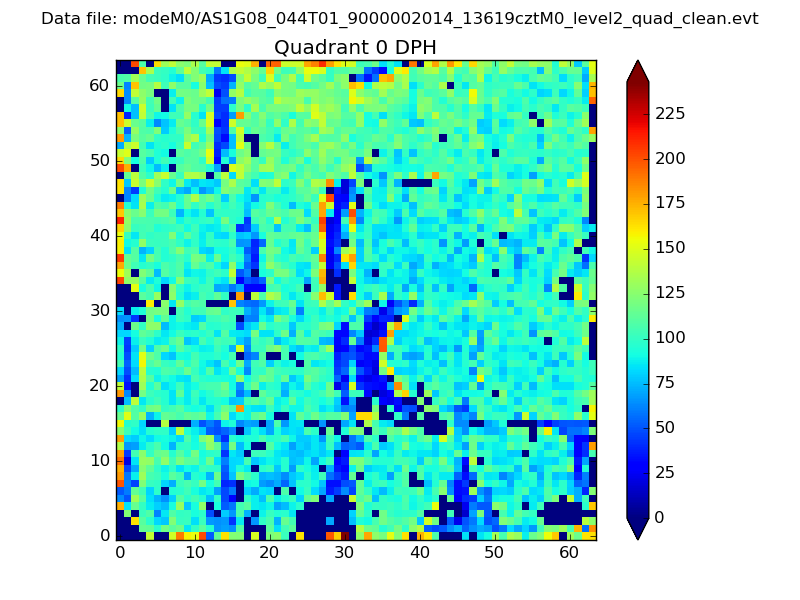 |
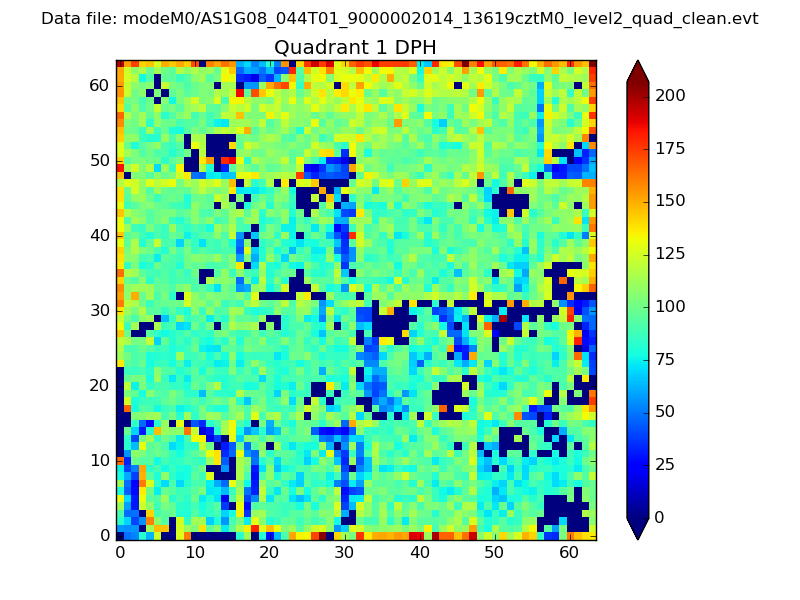 |
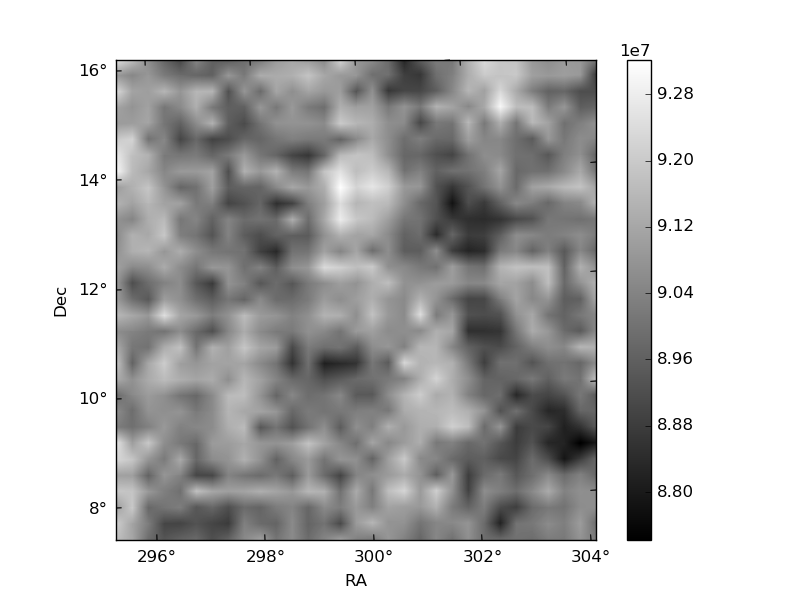
Quadrant B |
|---|---|---|---|
| Quadrant D | 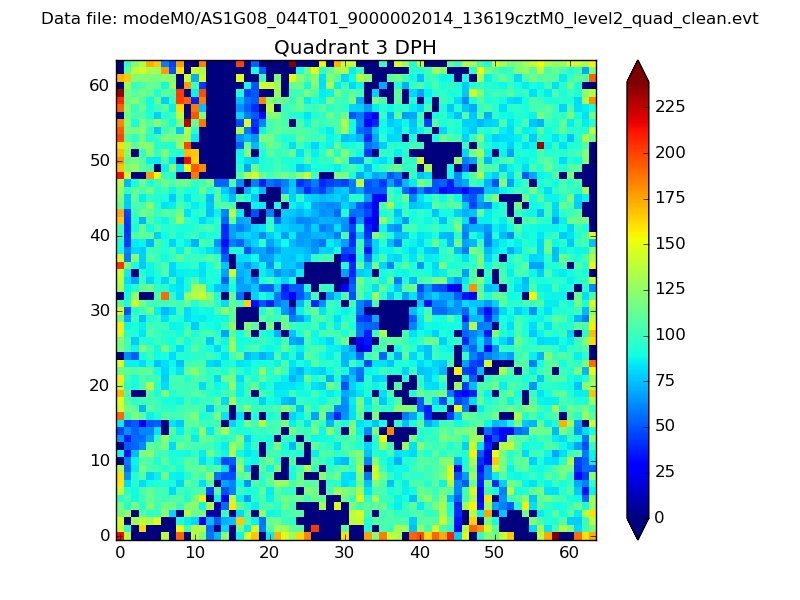 |
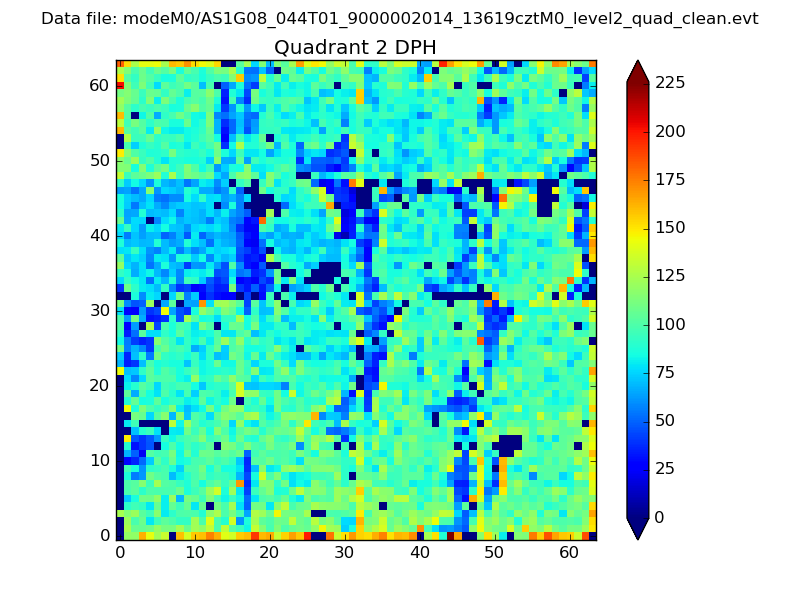 |
Quadrant C |
| Plot type | Count rate plots | Images |
|---|---|---|
| Comparison with Poisson distribution Blue bars denote a histogram of data divided into 1 sec bins. Red curve is a Poisson curve with rate = median count rate of data. |
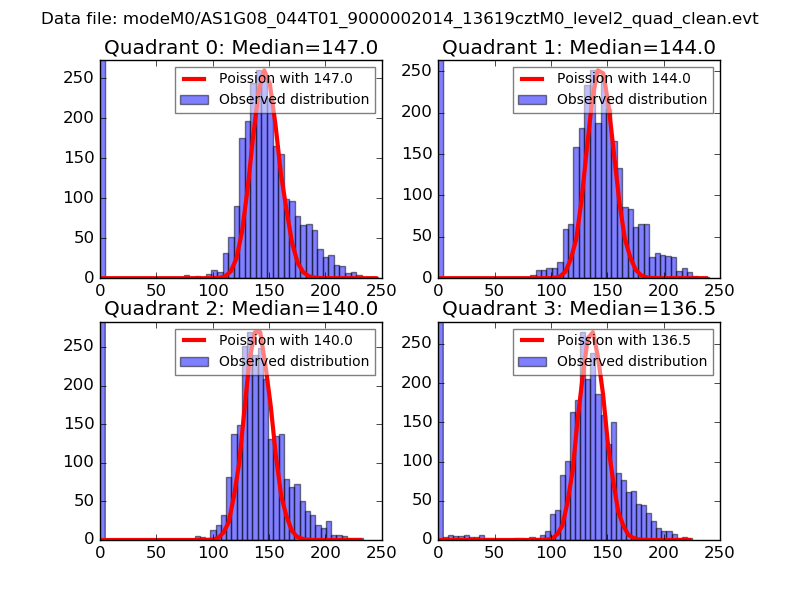 |
 |
| Quadrant-wise count rates Data is divided into 100 sec bins |
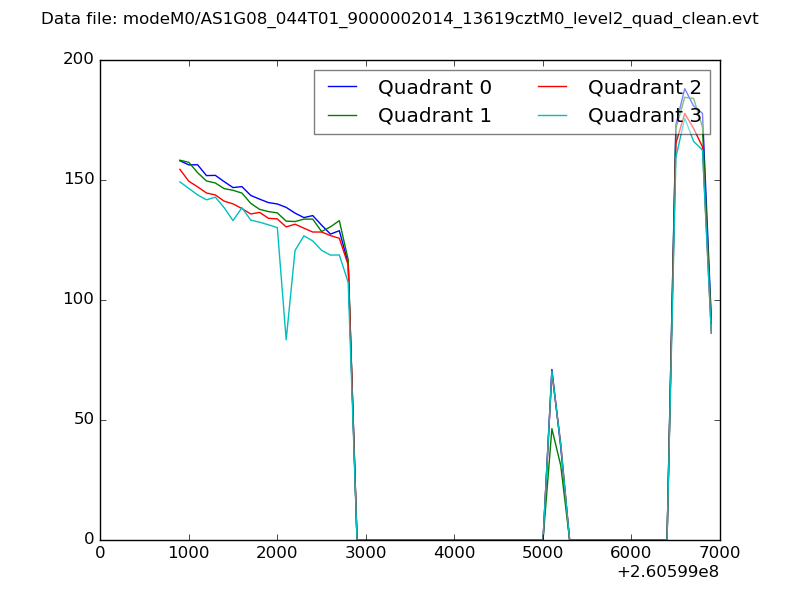 |
|
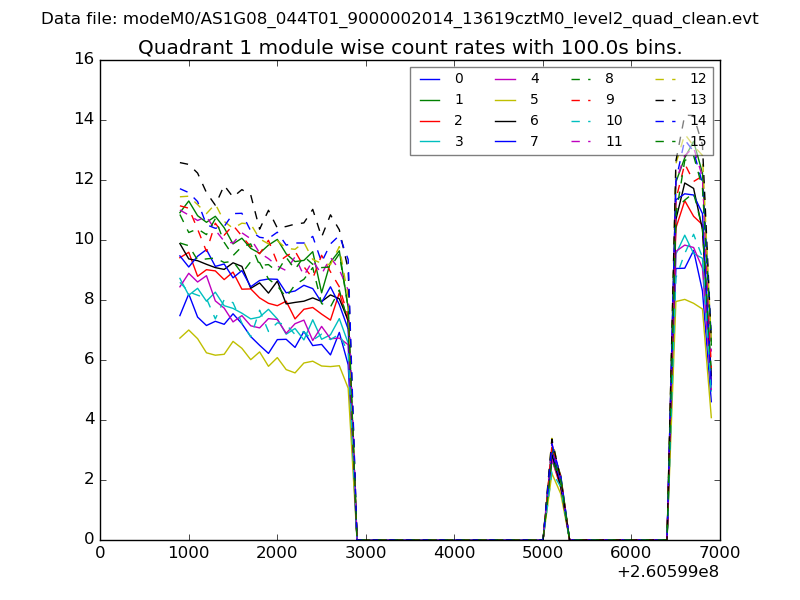
| Module-wise count rates for Quadrant A Data is divided into 100 sec bins |
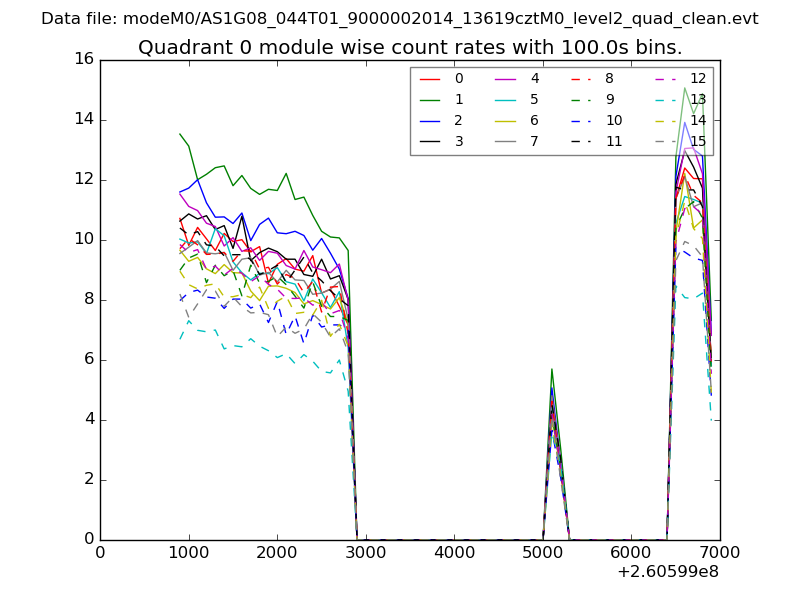 |
 |
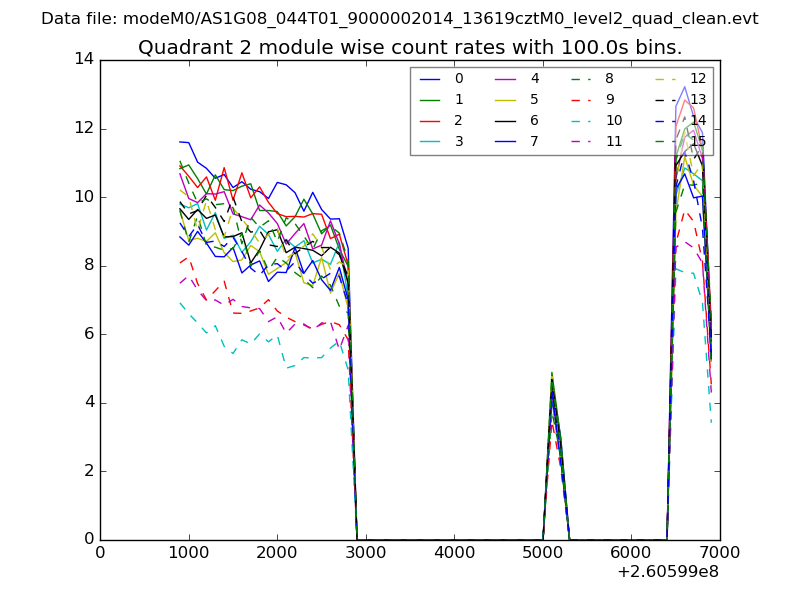
| Module-wise count rates for Quadrant B Data is divided into 100 sec bins |
 |
 |
| Module-wise count rates for Quadrant C Data is divided into 100 sec bins |
 |
 |
| Module-wise count rates for Quadrant D Data is divided into 100 sec bins |
 |
 |
| Parameter | Plot |
|---|---|
| CZT HV Monitor | 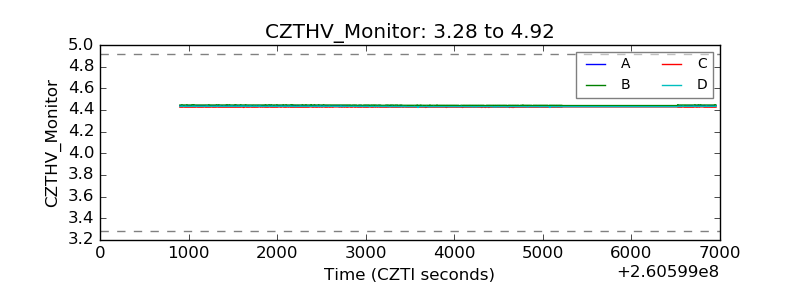 |
| D_VDD | 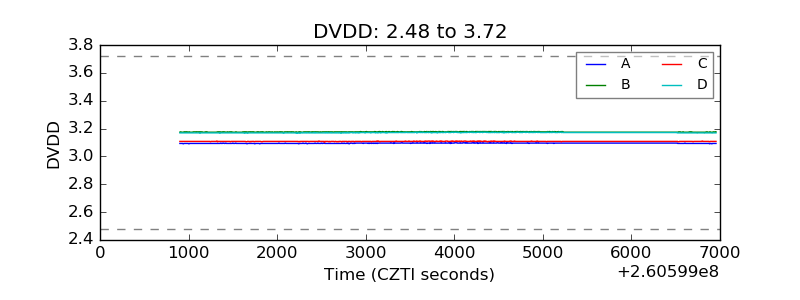 |
| Temperature 1 | 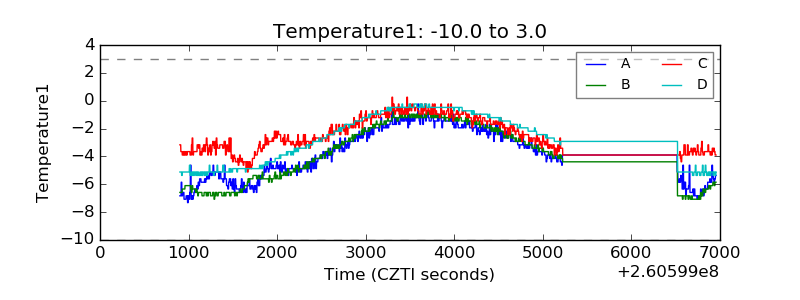 |
| Veto HV Monitor | 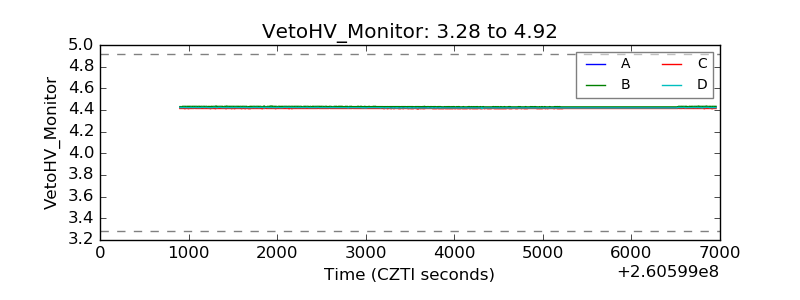 |
| Veto LLD | 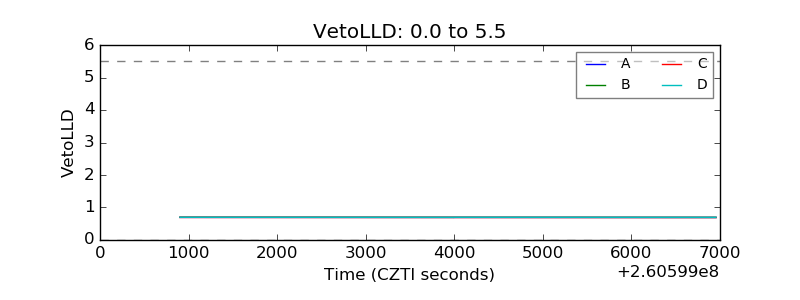 |
| Alpha Counter | 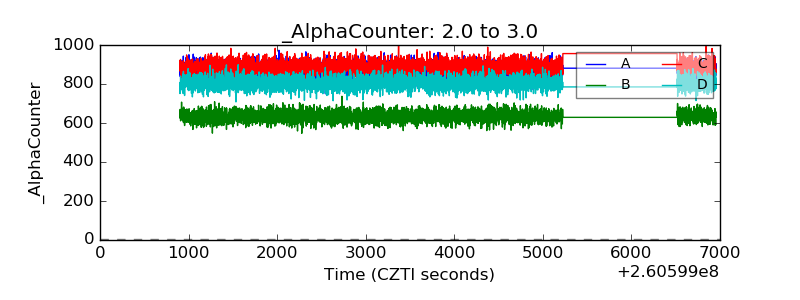 |
| _CPM_Rate | 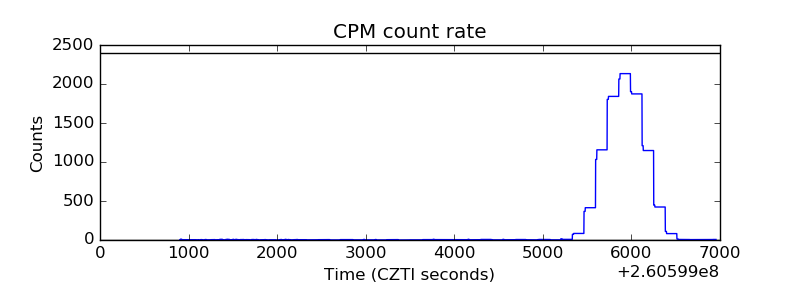 |
| CZT Counter | 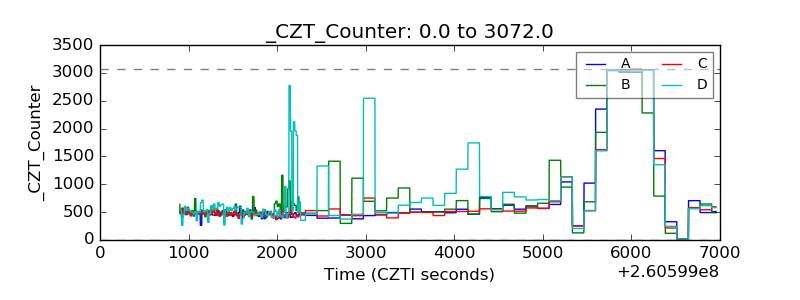 |
| +2.5 Volts monitor |  |
| +5 Volts monitor |  |
| _ROLL_ROT |  |
| _Roll_DEC | 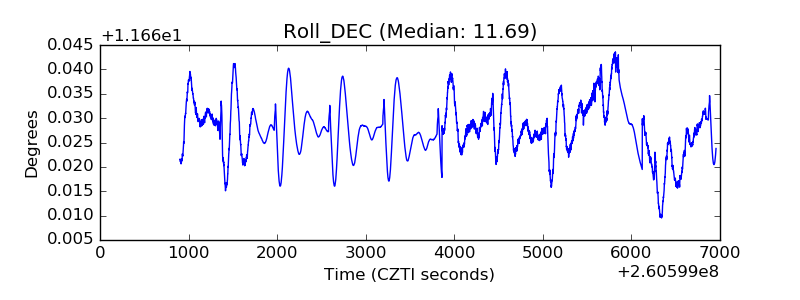 |
| _Roll_RA | 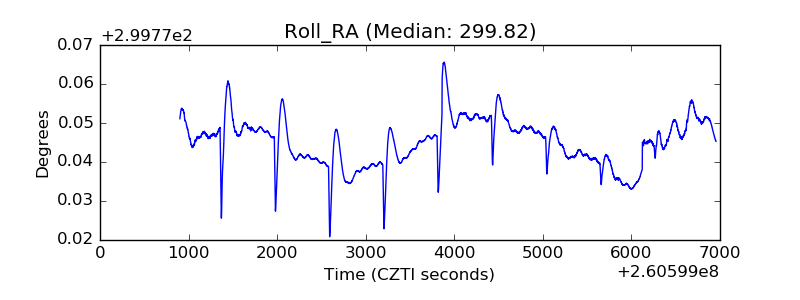 |
| Veto Counter |  |