| Param | Original file | Final file |
|---|---|---|
| Filename | modeM0/AS1G08_038T02_9000002020cztM0_level2.fits | modeM0/AS1G08_038T02_9000002020cztM0_level2_quad_clean.evt |
| Size (bytes) | 233,925,120 | 256,711,680 |
| Size | 223.1 MB | 244.8 MB |
| Events in quadrant A | 1,403,950 | 1,476,043 |
| Events in quadrant B | 1,344,784 | 1,489,584 |
| Events in quadrant C | 1,411,002 | 1,623,661 |
| Events in quadrant D | 1,194,556 | 1,455,627 |
| Mode SS | |||
|---|---|---|---|
| Quadrant | BADHDUFLAG | Total packets | Discarded packets |
| A | 0 | 516 | 0 |
| B | 0 | 516 | 0 |
| C | 0 | 516 | 0 |
| D | 0 | 516 | 0 |
| Mode M9 | |||
|---|---|---|---|
| Quadrant | BADHDUFLAG | Total packets | Discarded packets |
| A | 0 | 20 | 0 |
| B | 0 | 20 | 0 |
| C | 0 | 20 | 0 |
| D | 0 | 20 | 0 |
| Mode M0 | |||
|---|---|---|---|
| Quadrant | BADHDUFLAG | Total packets | Discarded packets |
| A | 0 | 51755 | 0 |
| B | 0 | 55332 | 0 |
| C | 0 | 52366 | 0 |
| D | 0 | 65265 | 0 |
| Quadrant | Total seconds | Saturated seconds | Saturation percentage |
|---|---|---|---|
| A | 25141 | 365 | 1.451812% |
| B | 25141 | 553 | 2.199594% |
| C | 25141 | 342 | 1.360328% |
| D | 25141 | 1273 | 5.063442% |
Noise dominated data is calculated using 1-second bins in cleaned event files. If a bin has >2000 counts, and if more than 50% of those come from <1% of pixels, then it is considered to be noise-dominated and hence unusable.
| Quadrant | # 1 sec bins | Bins with >0 counts | Bins with >2000 counts | High rate bins dominated by noise | Noise dominated (total time) | Noise dominated (detector-on time) | Marked lightcurve |
|---|---|---|---|---|---|---|---|
| A | 27136 | 25142 | 0 | 0 | 0.00% | 0.00% | 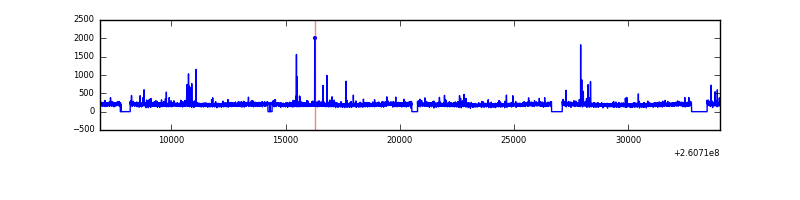 |
| B | 27136 | 25142 | 0 | 0 | 0.00% | 0.00% |  |
| C | 27136 | 25141 | 0 | 0 | 0.00% | 0.00% |  |
| D | 27136 | 25137 | 0 | 0 | 0.00% | 0.00% |  |
Top three noisy pixels from each quadrant. If the there are fewer than three noisy pixels in the level2.evt file, extra rows are filled as -1
| Pixel properties | Quadrant properties | ||||||
|---|---|---|---|---|---|---|---|
| Quadrant | DetID | PixID | Counts | Sigma | Mean | Median | Sigma |
| A | 14 | 188 | 1414 | 11.67 | 363 | 340 | 92.0 |
| A | 0 | 29 | 1337 | 10.83 | 363 | 340 | 92.0 |
| A | 14 | 204 | 1248 | 9.86 | 363 | 340 | 92.0 |
| B | 2 | 9 | 1190 | 11.76 | 353 | 335 | 72.7 |
| B | 3 | 17 | 923 | 8.09 | 353 | 335 | 72.7 |
| B | 5 | 232 | 902 | 7.8 | 353 | 335 | 72.7 |
| C | 1 | 80 | 1139 | 8.02 | 371 | 345 | 99.1 |
| C | 1 | 81 | 1122 | 7.84 | 371 | 345 | 99.1 |
| C | 12 | 250 | 1023 | 6.84 | 371 | 345 | 99.1 |
| D | 3 | 14 | 900 | 6.26 | 341 | 309 | 94.4 |
| D | 6 | 231 | 896 | 6.22 | 341 | 309 | 94.4 |
| D | 3 | 159 | 858 | 5.82 | 341 | 309 | 94.4 |
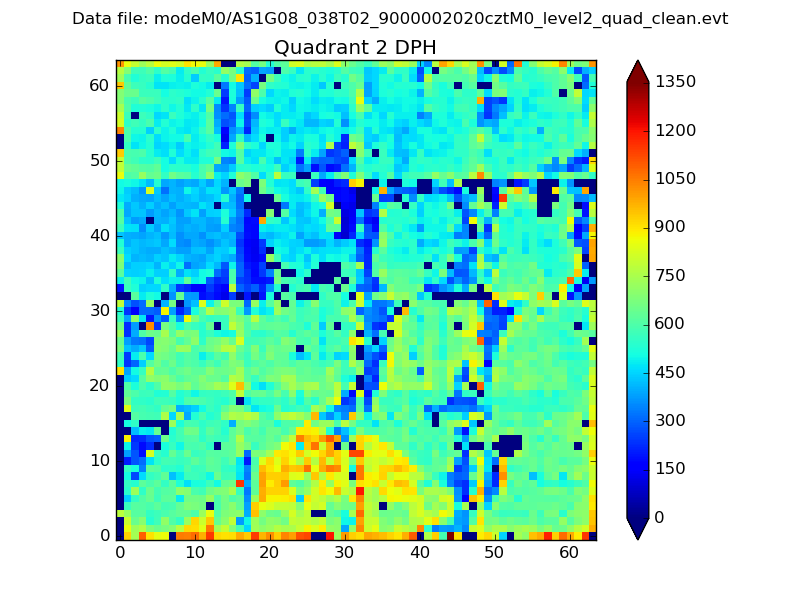
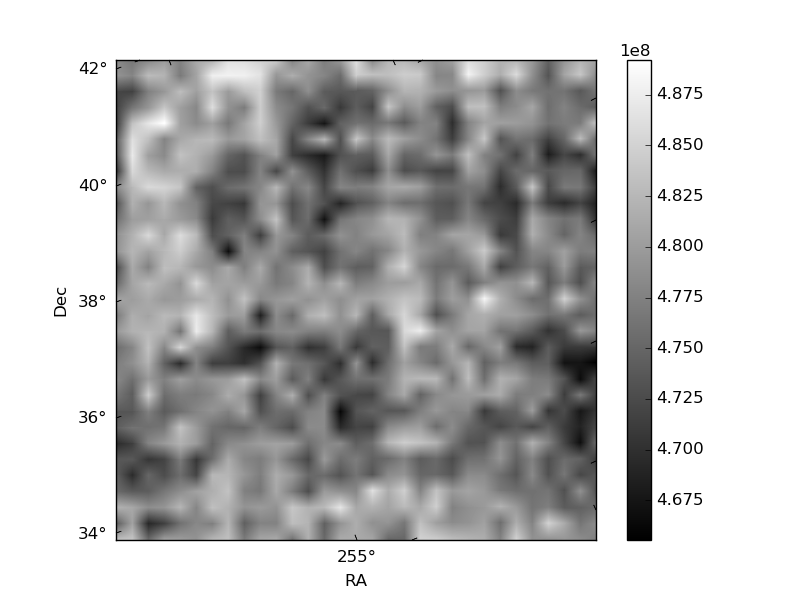
Histogram calculated using DETX and DETY for each event in the final _common_clean file
| Quadrant A | 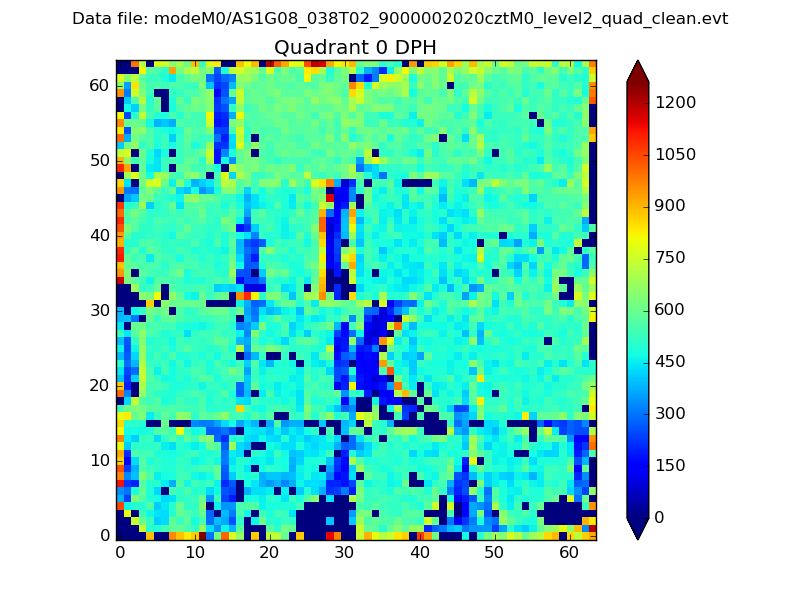 |
 |
Quadrant B |
|---|---|---|---|
| Quadrant D |  |
 |
Quadrant C |
| Plot type | Count rate plots | Images |
|---|---|---|
| Comparison with Poisson distribution Blue bars denote a histogram of data divided into 1 sec bins. Red curve is a Poisson curve with rate = median count rate of data. |
 |
 |
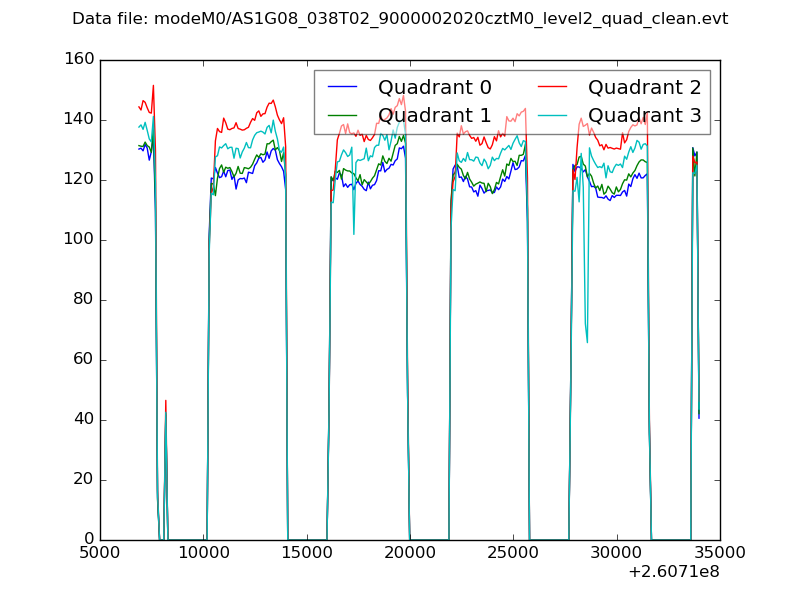
| Quadrant-wise count rates Data is divided into 100 sec bins |
 |
|
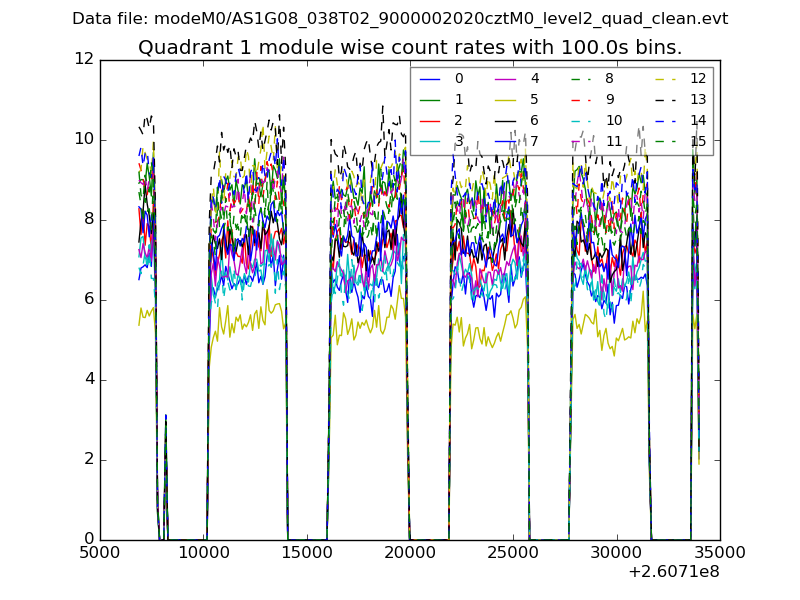
| Module-wise count rates for Quadrant A Data is divided into 100 sec bins |
 |
 |
| Module-wise count rates for Quadrant B Data is divided into 100 sec bins |
 |
 |
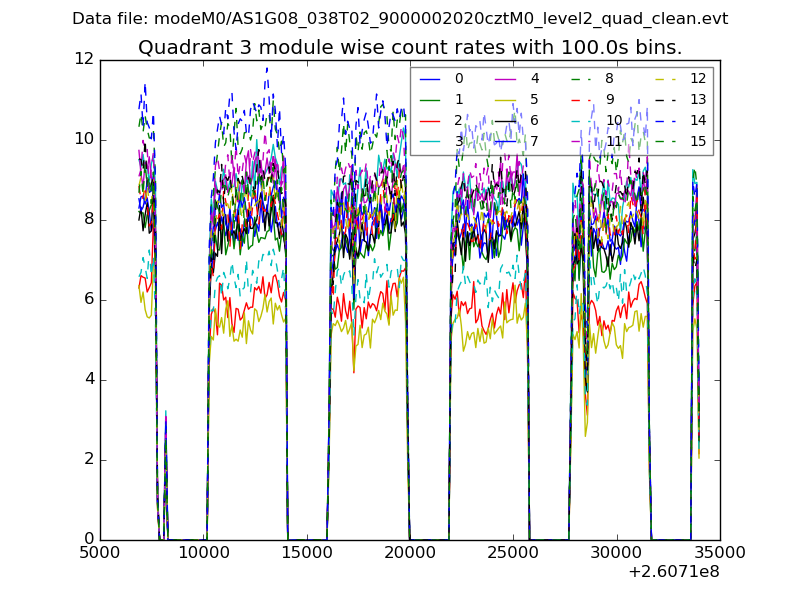
| Module-wise count rates for Quadrant C Data is divided into 100 sec bins |
 |
 |
| Module-wise count rates for Quadrant D Data is divided into 100 sec bins |
 |
 |
| Parameter | Plot |
|---|---|
| CZT HV Monitor | 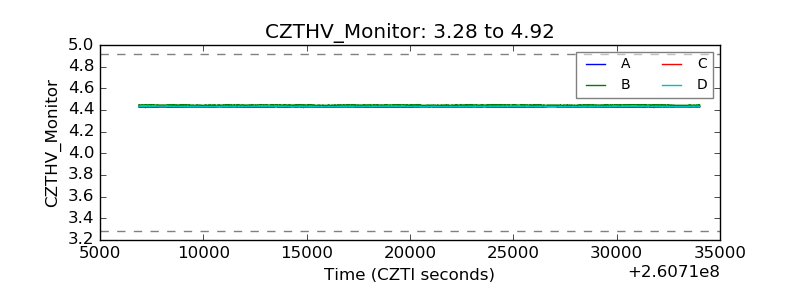 |
| D_VDD | 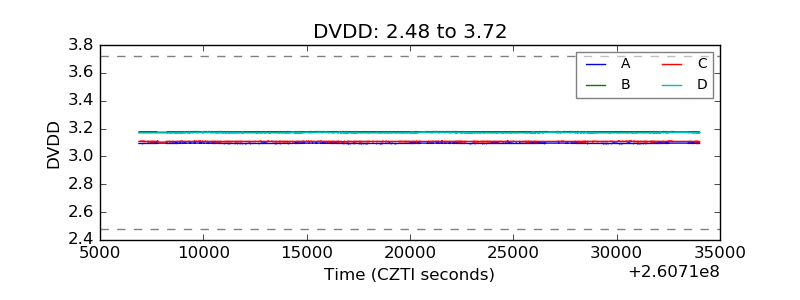 |
| Temperature 1 |  |
| Veto HV Monitor |  |
| Veto LLD | 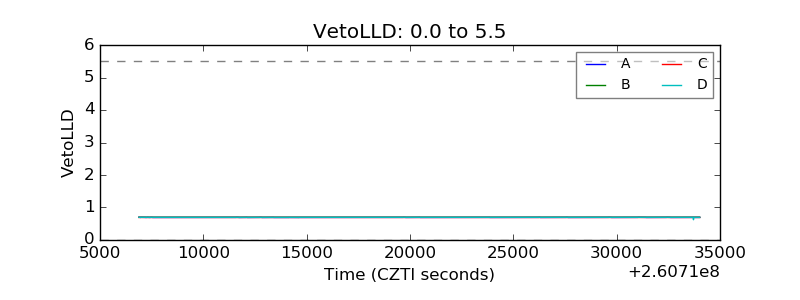 |
| Alpha Counter |  |
| _CPM_Rate | 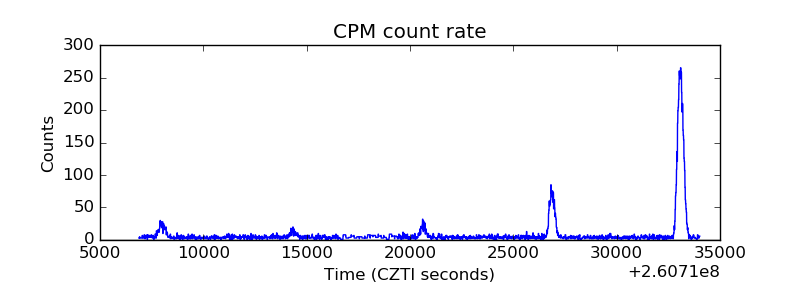 |
| CZT Counter | 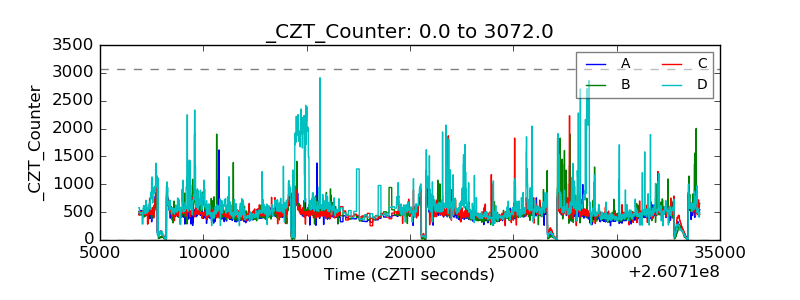 |
| +2.5 Volts monitor |  |
| +5 Volts monitor | 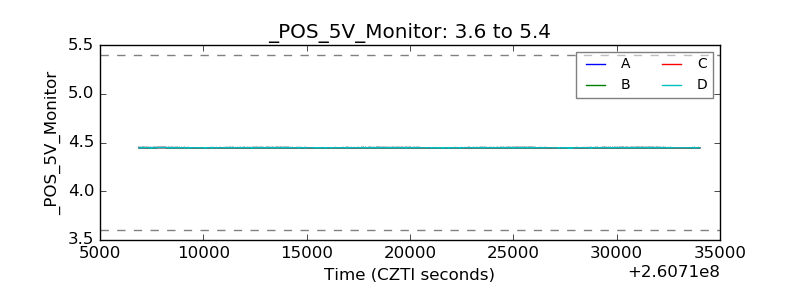 |
| _ROLL_ROT | 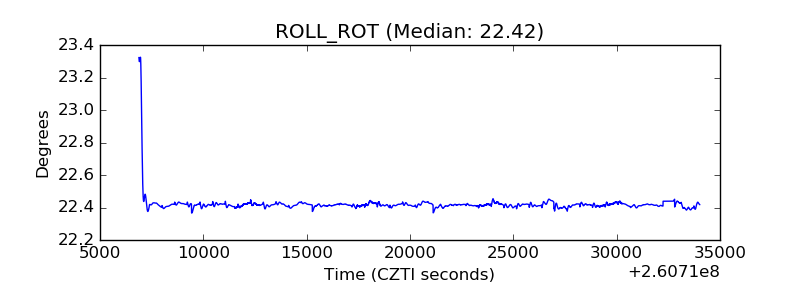 |
| _Roll_DEC | 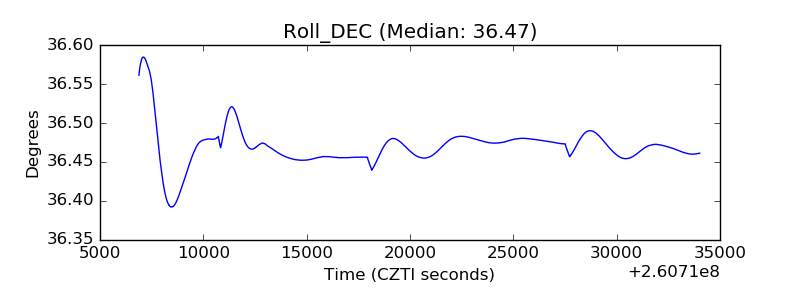 |
| _Roll_RA | 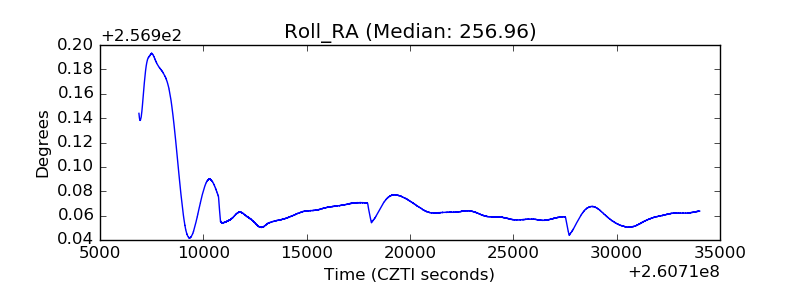 |
| Veto Counter | 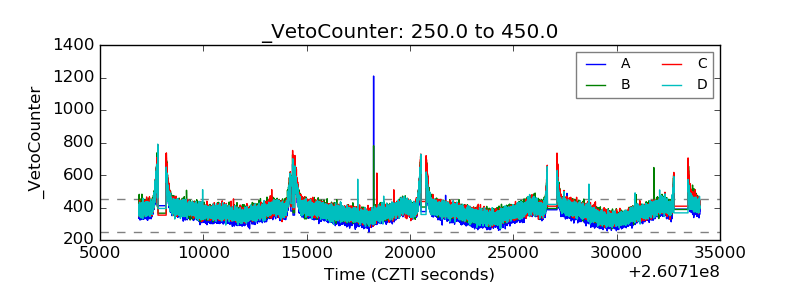 |