| Param | Original file | Final file |
|---|---|---|
| Filename | modeM0/AS1G08_038T02_9000002020_13638cztM0_level2.evt | modeM0/AS1G08_038T02_9000002020_13638cztM0_level2_quad_clean.evt |
| Size (bytes) | 200,545,920 | 22,789,440 |
| Size | 191.3 MB | 21.7 MB |
| Events in quadrant A | 1,291,129 | 120,928 |
| Events in quadrant B | 1,471,059 | 122,881 |
| Events in quadrant C | 1,356,162 | 135,656 |
| Events in quadrant D | 1,780,777 | 127,729 |
| Mode SS | |||
|---|---|---|---|
| Quadrant | BADHDUFLAG | Total packets | Discarded packets |
| A | 0 | 54 | 0 |
| B | 0 | 54 | 0 |
| C | 0 | 54 | 0 |
| D | 0 | 54 | 0 |
| Mode M9 | |||
|---|---|---|---|
| Quadrant | BADHDUFLAG | Total packets | Discarded packets |
| A | 0 | 4 | 0 |
| B | 0 | 4 | 0 |
| C | 0 | 4 | 0 |
| D | 0 | 4 | 0 |
| Mode M0 | |||
|---|---|---|---|
| Quadrant | BADHDUFLAG | Total packets | Discarded packets |
| A | 0 | 5380 | 3 |
| B | 0 | 5976 | 2 |
| C | 0 | 5487 | 2 |
| D | 0 | 6979 | 2 |
| Quadrant | Total seconds | Saturated seconds | Saturation percentage |
|---|---|---|---|
| A | 2533 | 104 | 4.105803% |
| B | 2533 | 114 | 4.500592% |
| C | 2533 | 84 | 3.316226% |
| D | 2533 | 114 | 4.500592% |
Noise dominated data is calculated using 1-second bins in cleaned event files. If a bin has >2000 counts, and if more than 50% of those come from <1% of pixels, then it is considered to be noise-dominated and hence unusable.
| Quadrant | # 1 sec bins | Bins with >0 counts | Bins with >2000 counts | High rate bins dominated by noise | Noise dominated (total time) | Noise dominated (detector-on time) | Marked lightcurve |
|---|---|---|---|---|---|---|---|
| A | 2954 | 2536 | 0 | 0 | 0.00% | 0.00% | 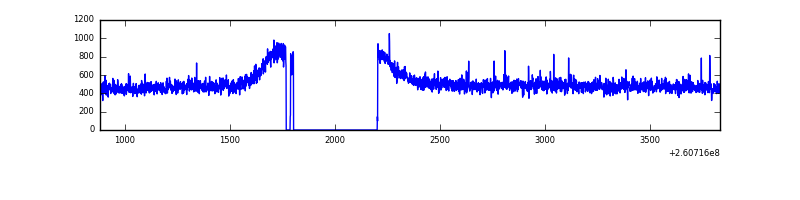 |
| B | 2954 | 2536 | 0 | 0 | 0.00% | 0.00% | 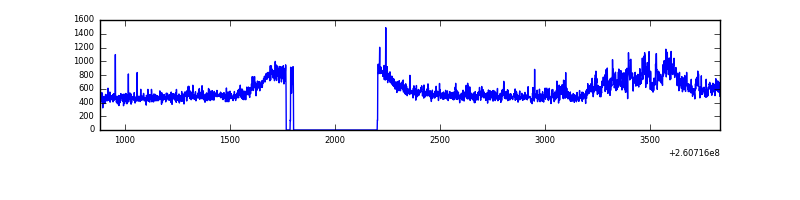 |
| C | 2954 | 2536 | 0 | 0 | 0.00% | 0.00% | 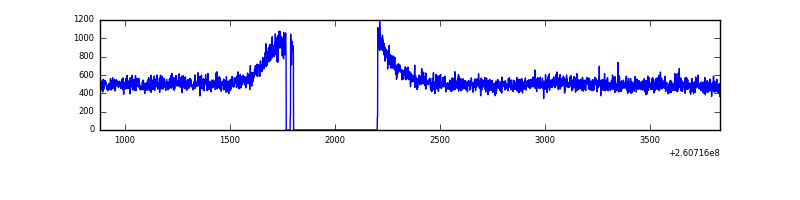 |
| D | 2954 | 2536 | 14 | 14 | 0.47% | 0.55% | 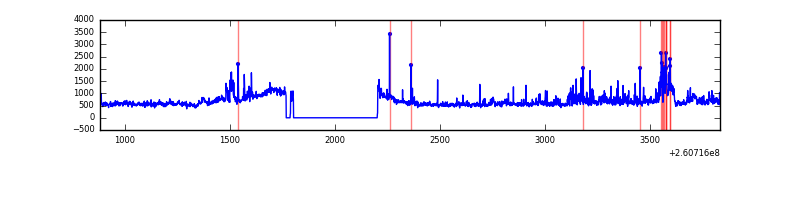 |
Top three noisy pixels from each quadrant. If the there are fewer than three noisy pixels in the level2.evt file, extra rows are filled as -1
| Pixel properties | Quadrant properties | ||||||
|---|---|---|---|---|---|---|---|
| Quadrant | DetID | PixID | Counts | Sigma | Mean | Median | Sigma |
| A | 1 | 162 | 4621 | 61.09 | 333 | 325 | 70.3 |
| A | 0 | 226 | 3129 | 39.87 | 333 | 325 | 70.3 |
| A | 12 | 194 | 2640 | 32.92 | 333 | 325 | 70.3 |
| B | 0 | 219 | 169003 | 2543.98 | 328 | 319 | 66.3 |
| B | 12 | 111 | 7441 | 107.41 | 328 | 319 | 66.3 |
| B | 3 | 209 | 7158 | 103.14 | 328 | 319 | 66.3 |
| C | 3 | 233 | 96262 | 1264.13 | 322 | 324 | 75.9 |
| C | 13 | 61 | 2262 | 25.54 | 322 | 324 | 75.9 |
| C | 0 | 207 | 1387 | 14.01 | 322 | 324 | 75.9 |
| D | 13 | 122 | 240338 | 3024.66 | 323 | 312 | 79.4 |
| D | 5 | 222 | 203095 | 2555.35 | 323 | 312 | 79.4 |
| D | 8 | 195 | 55874 | 700.16 | 323 | 312 | 79.4 |
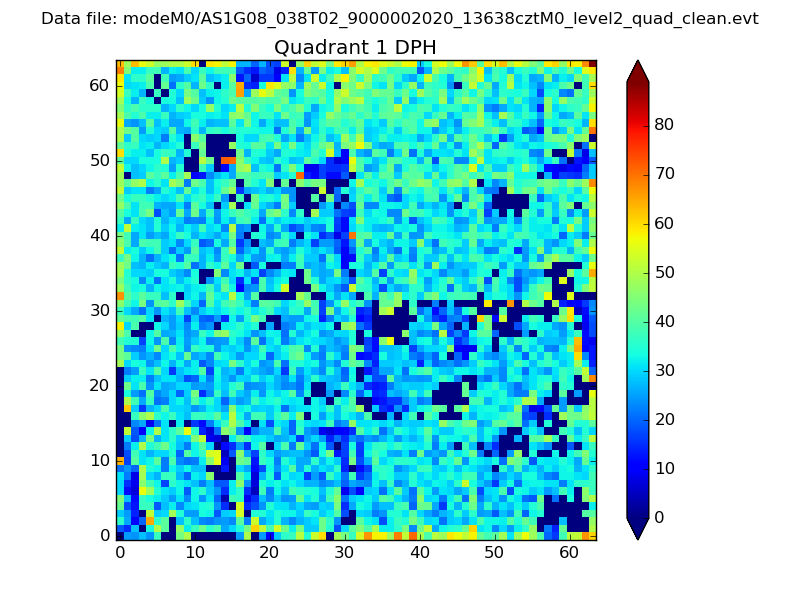
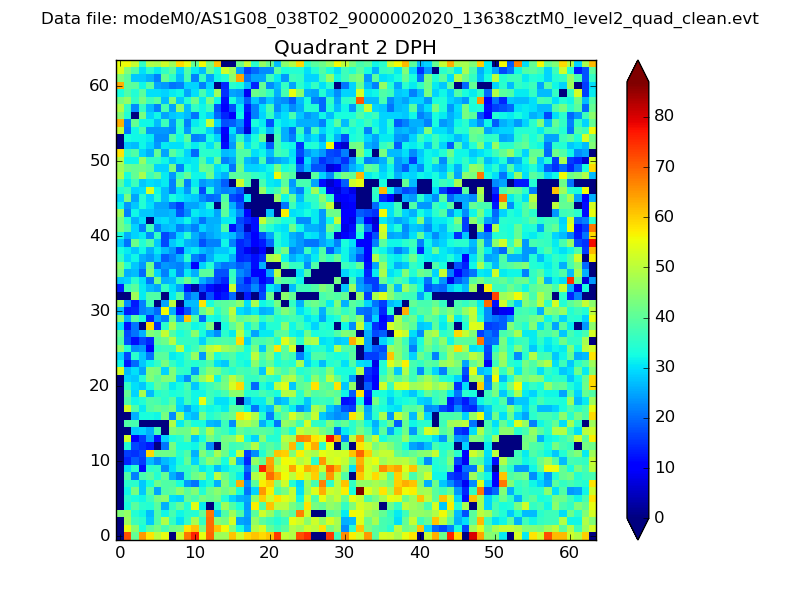
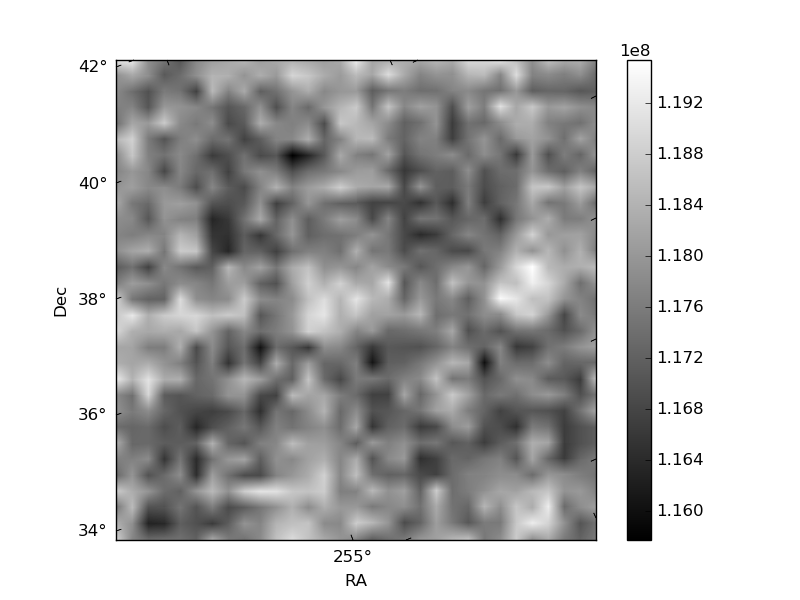
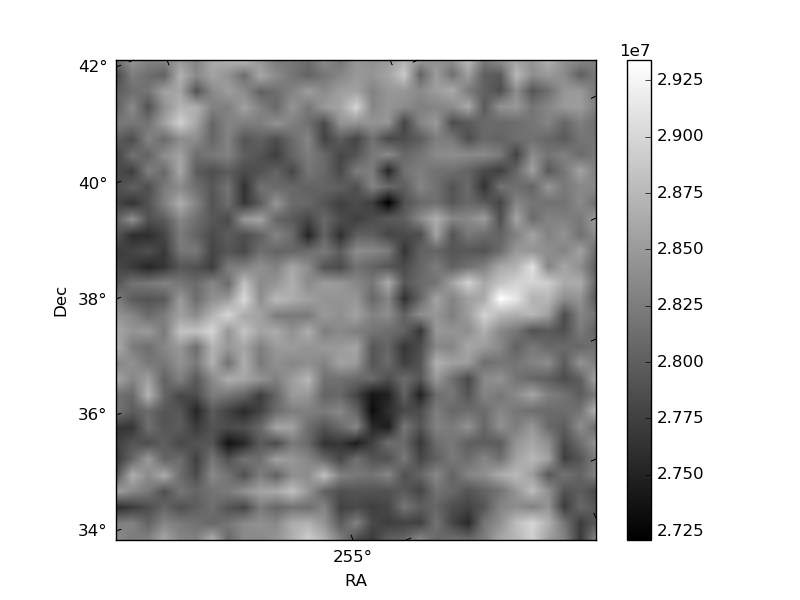
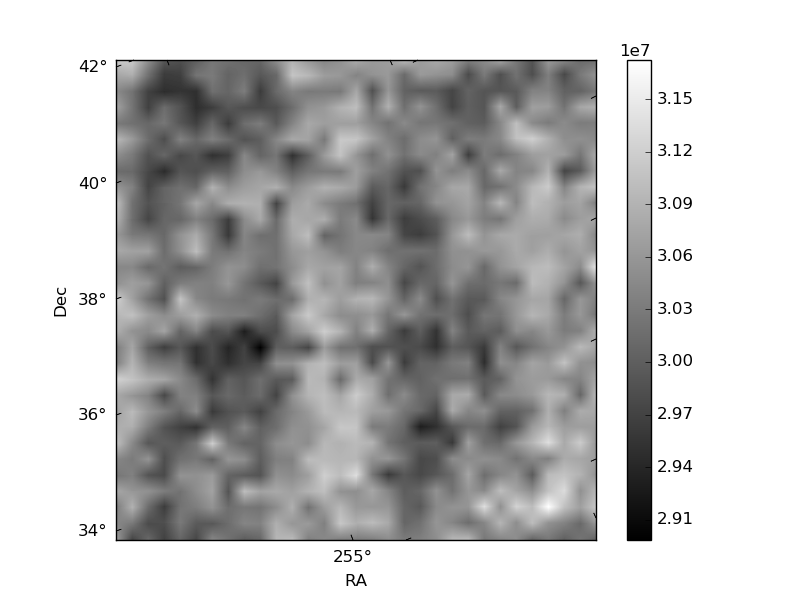
Histogram calculated using DETX and DETY for each event in the final _common_clean file
| Quadrant A |  |
 |
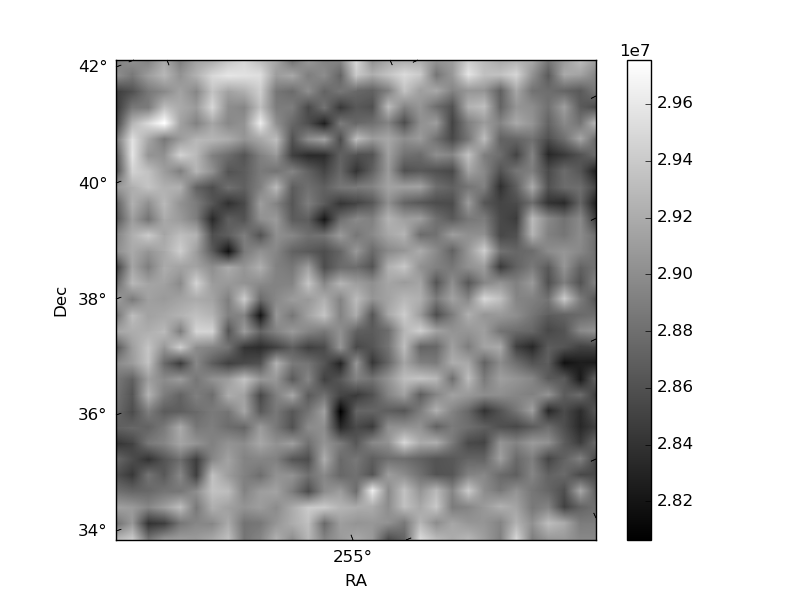
Quadrant B |
|---|---|---|---|
| Quadrant D | 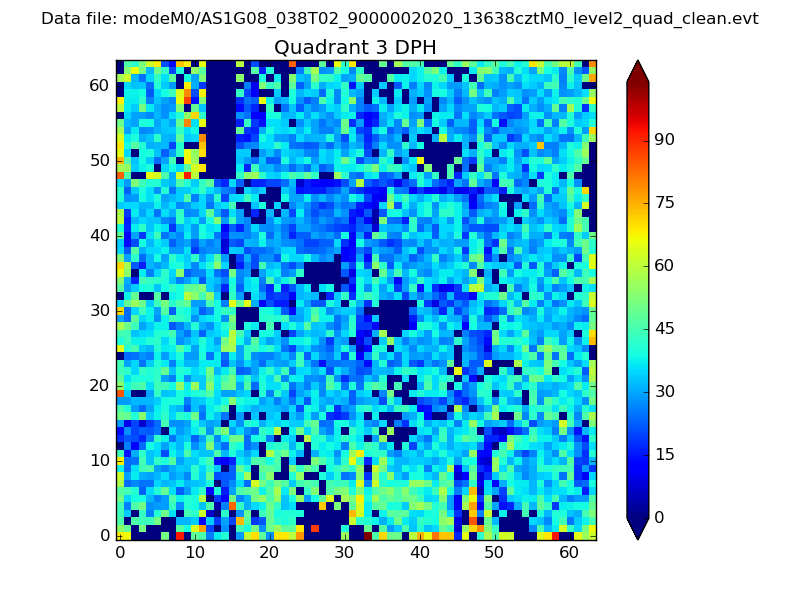 |
 |
Quadrant C |
| Plot type | Count rate plots | Images |
|---|---|---|
| Comparison with Poisson distribution Blue bars denote a histogram of data divided into 1 sec bins. Red curve is a Poisson curve with rate = median count rate of data. |
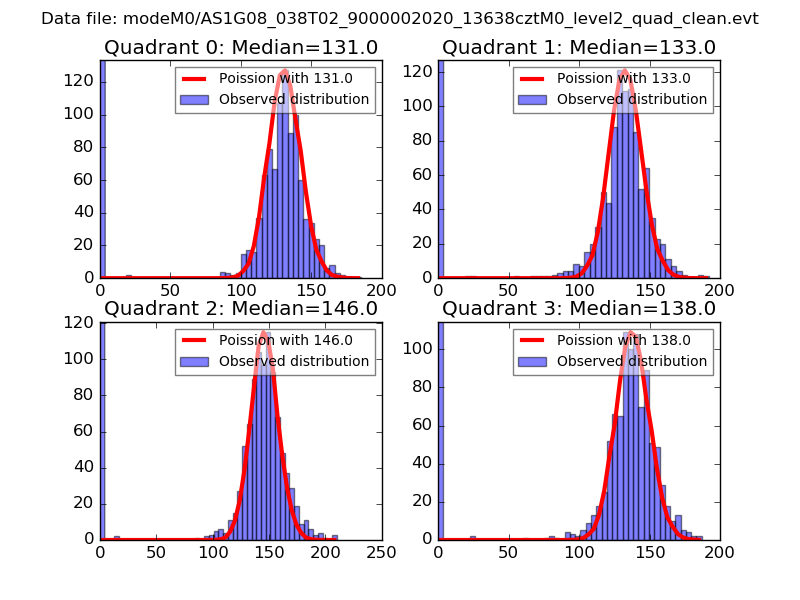 |
 |
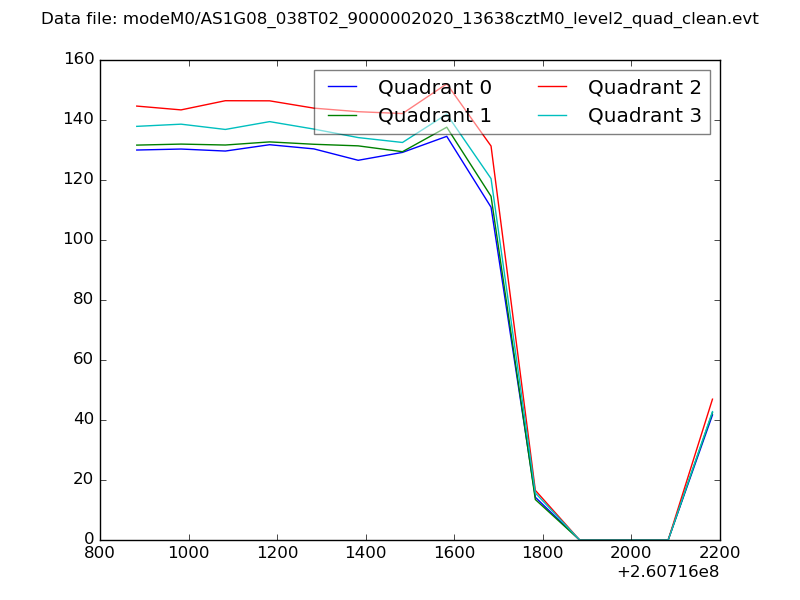
| Quadrant-wise count rates Data is divided into 100 sec bins |
 |
|
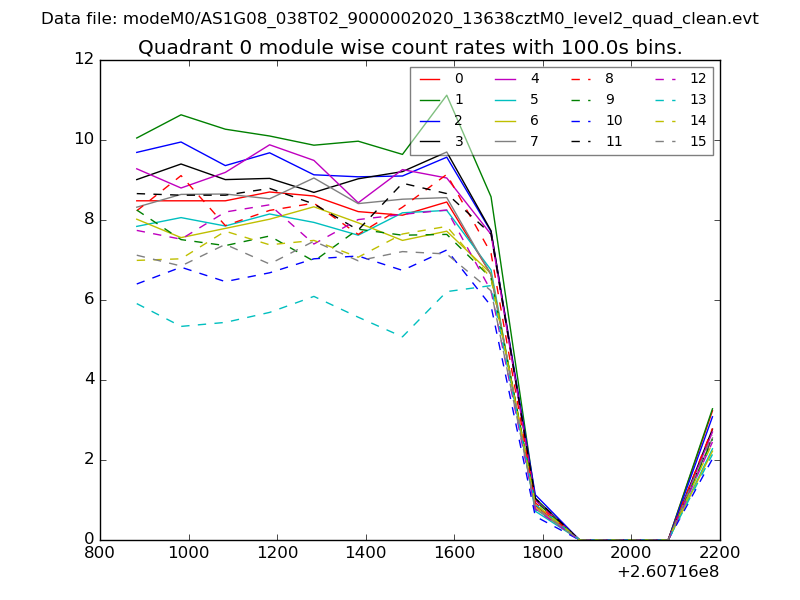
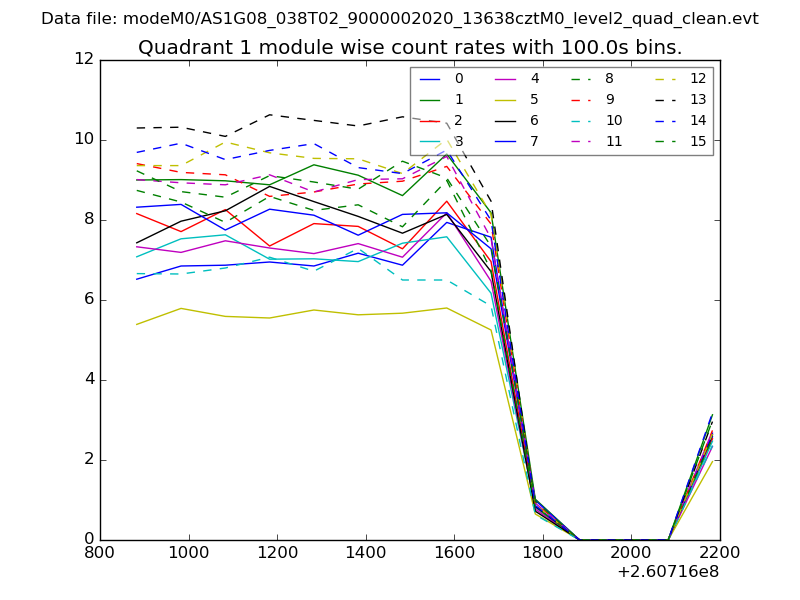
| Module-wise count rates for Quadrant A Data is divided into 100 sec bins |
 |
 |
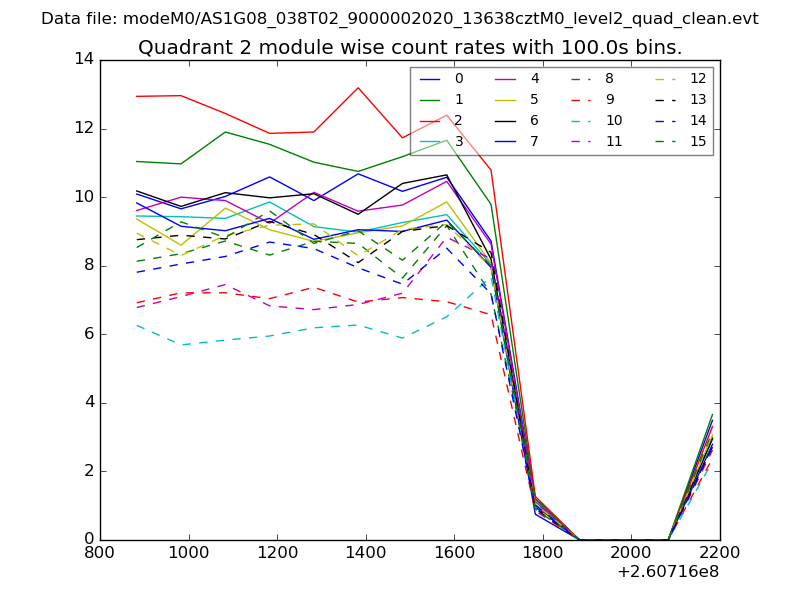
| Module-wise count rates for Quadrant B Data is divided into 100 sec bins |
 |
 |
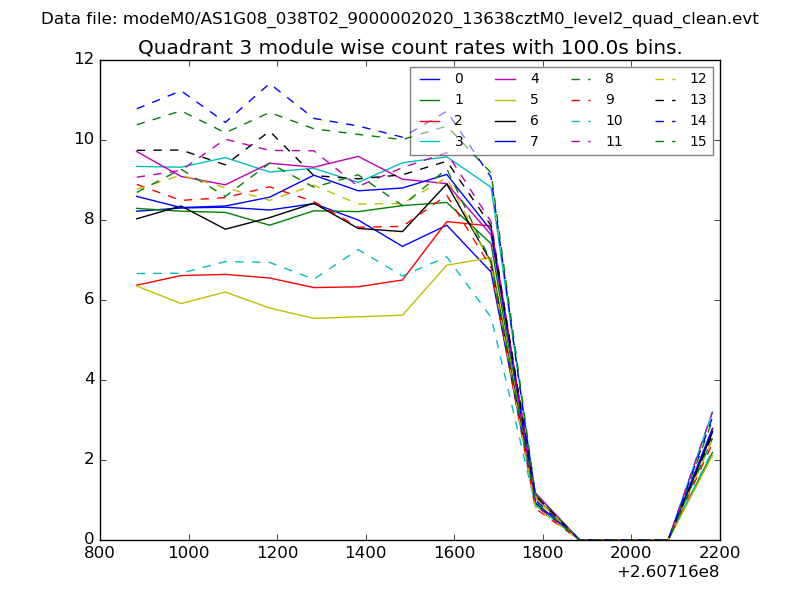
| Module-wise count rates for Quadrant C Data is divided into 100 sec bins |
 |
 |
| Module-wise count rates for Quadrant D Data is divided into 100 sec bins |
 |
 |
| Parameter | Plot |
|---|---|
| CZT HV Monitor | 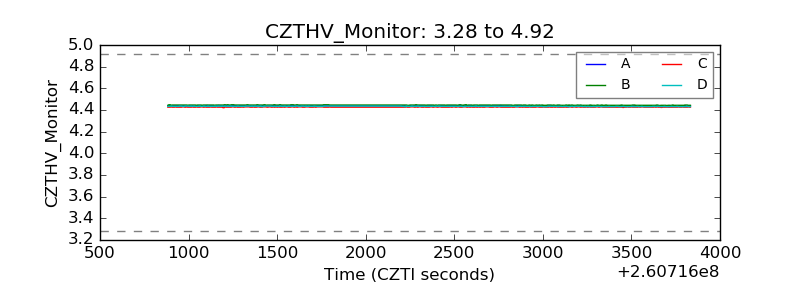 |
| D_VDD | 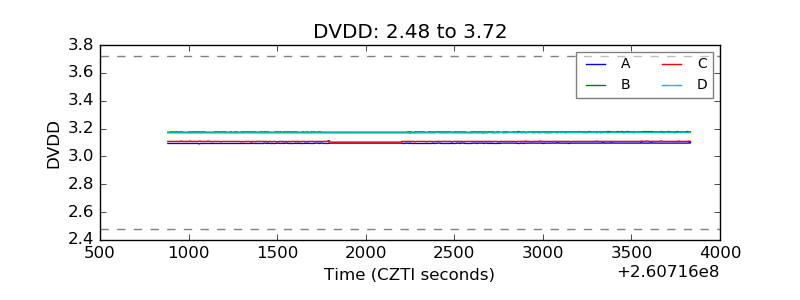 |
| Temperature 1 | 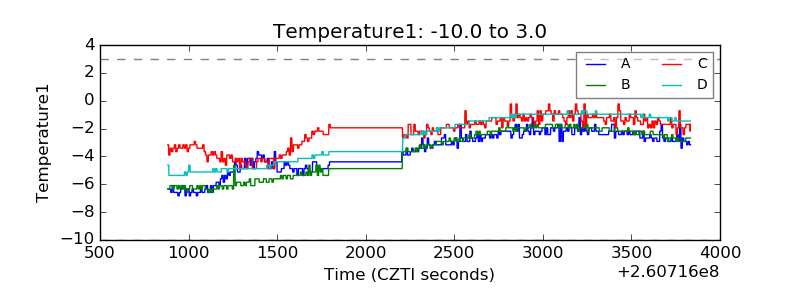 |
| Veto HV Monitor |  |
| Veto LLD | 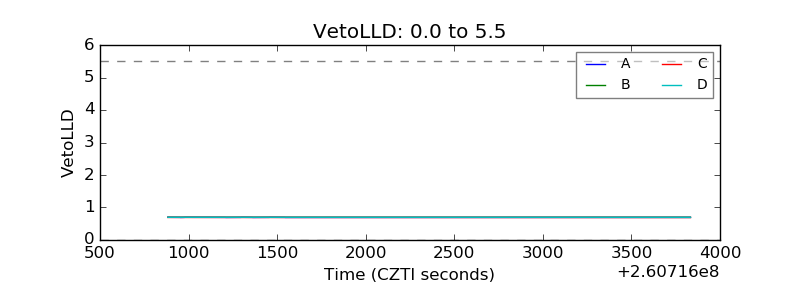 |
| Alpha Counter | 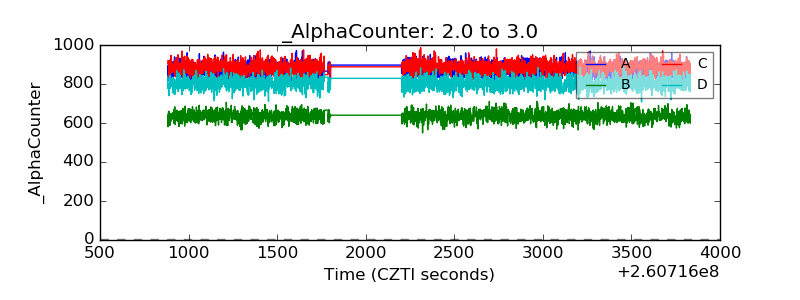 |
| _CPM_Rate |  |
| CZT Counter | 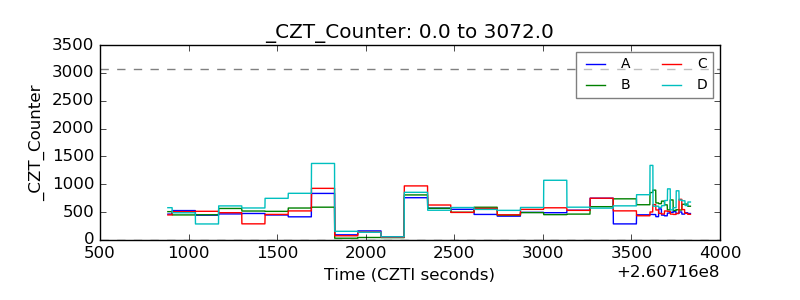 |
| +2.5 Volts monitor |  |
| +5 Volts monitor |  |
| _ROLL_ROT | 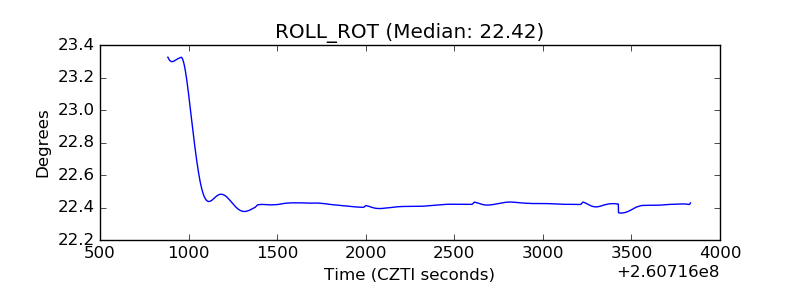 |
| _Roll_DEC | 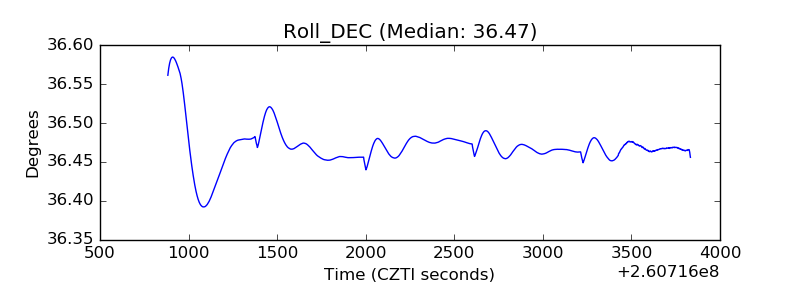 |
| _Roll_RA | 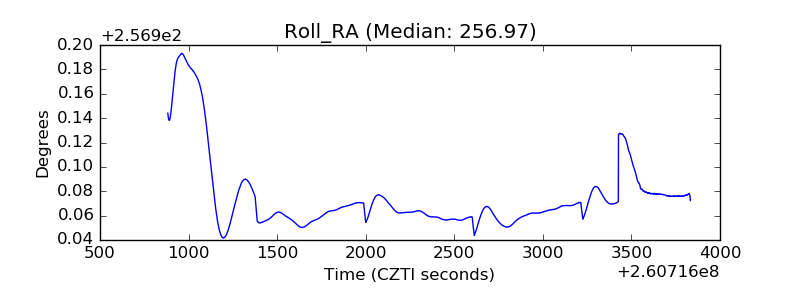 |
| Veto Counter | 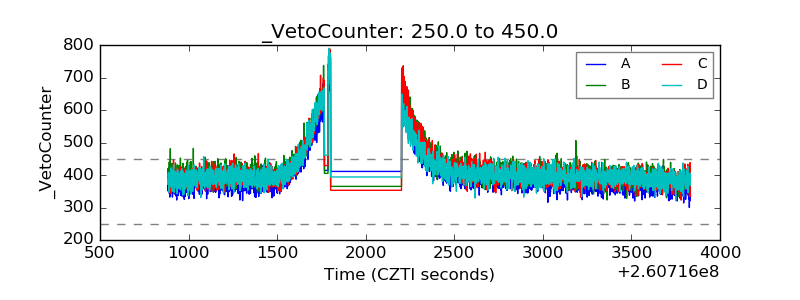 |