| Param | Original file | Final file |
|---|---|---|
| Filename | modeM0/AS1G08_038T02_9000002020_13640cztM0_level2.evt | modeM0/AS1G08_038T02_9000002020_13640cztM0_level2_quad_clean.evt |
| Size (bytes) | 615,427,200 | 92,292,480 |
| Size | 586.9 MB | 88.0 MB |
| Events in quadrant A | 3,861,859 | 532,776 |
| Events in quadrant B | 4,172,470 | 544,722 |
| Events in quadrant C | 4,070,440 | 594,739 |
| Events in quadrant D | 5,984,055 | 559,776 |
| Mode SS | |||
|---|---|---|---|
| Quadrant | BADHDUFLAG | Total packets | Discarded packets |
| A | 0 | 168 | 0 |
| B | 0 | 168 | 0 |
| C | 0 | 168 | 0 |
| D | 0 | 168 | 0 |
| Mode M9 | |||
|---|---|---|---|
| Quadrant | BADHDUFLAG | Total packets | Discarded packets |
| A | 0 | 4 | 0 |
| B | 0 | 4 | 0 |
| C | 0 | 4 | 0 |
| D | 0 | 4 | 0 |
| Mode M0 | |||
|---|---|---|---|
| Quadrant | BADHDUFLAG | Total packets | Discarded packets |
| A | 0 | 16878 | 3 |
| B | 0 | 17614 | 2 |
| C | 0 | 17009 | 2 |
| D | 0 | 23166 | 2 |
| Quadrant | Total seconds | Saturated seconds | Saturation percentage |
|---|---|---|---|
| A | 8097 | 200 | 2.470051% |
| B | 8097 | 260 | 3.211066% |
| C | 8097 | 181 | 2.235396% |
| D | 8097 | 853 | 10.534766% |
Noise dominated data is calculated using 1-second bins in cleaned event files. If a bin has >2000 counts, and if more than 50% of those come from <1% of pixels, then it is considered to be noise-dominated and hence unusable.
| Quadrant | # 1 sec bins | Bins with >0 counts | Bins with >2000 counts | High rate bins dominated by noise | Noise dominated (total time) | Noise dominated (detector-on time) | Marked lightcurve |
|---|---|---|---|---|---|---|---|
| A | 8518 | 8101 | 3 | 3 | 0.04% | 0.04% | 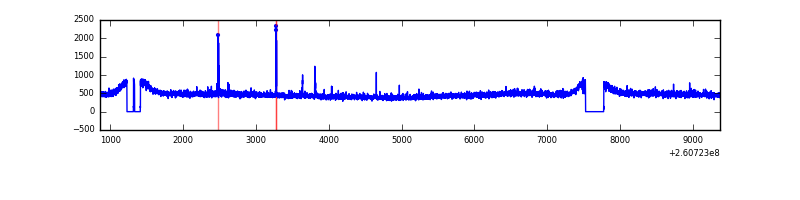 |
| B | 8518 | 8101 | 5 | 5 | 0.06% | 0.06% | 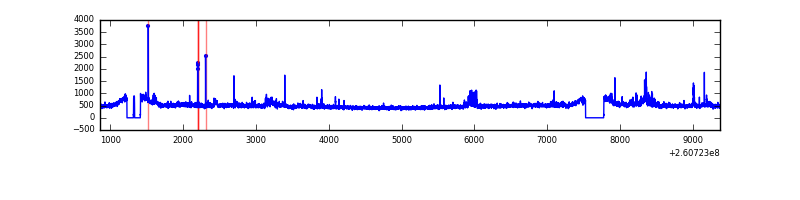 |
| C | 8518 | 8101 | 8 | 8 | 0.09% | 0.10% | 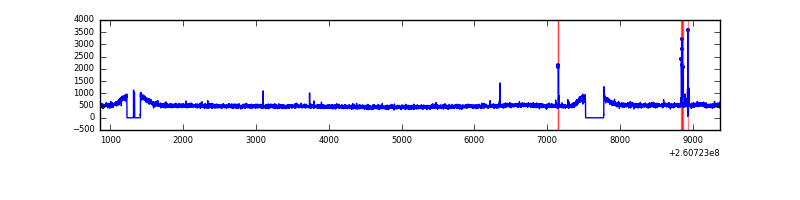 |
| D | 8518 | 8101 | 362 | 362 | 4.25% | 4.47% | 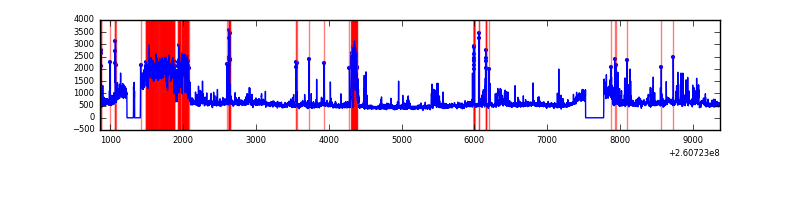 |
Top three noisy pixels from each quadrant. If the there are fewer than three noisy pixels in the level2.evt file, extra rows are filled as -1
| Pixel properties | Quadrant properties | ||||||
|---|---|---|---|---|---|---|---|
| Quadrant | DetID | PixID | Counts | Sigma | Mean | Median | Sigma |
| A | 15 | 69 | 29603 | 140.46 | 995 | 969 | 203.9 |
| A | 0 | 226 | 8830 | 38.56 | 995 | 969 | 203.9 |
| A | 12 | 194 | 7649 | 32.77 | 995 | 969 | 203.9 |
| B | 0 | 219 | 177567 | 934.04 | 990 | 962 | 189.1 |
| B | 0 | 182 | 25491 | 129.73 | 990 | 962 | 189.1 |
| B | 4 | 142 | 22704 | 114.99 | 990 | 962 | 189.1 |
| C | 3 | 233 | 209202 | 927.52 | 978 | 984 | 224.5 |
| C | 14 | 234 | 44762 | 195.01 | 978 | 984 | 224.5 |
| C | 13 | 61 | 6901 | 26.36 | 978 | 984 | 224.5 |
| D | 5 | 222 | 1248825 | 5521.17 | 943 | 916 | 226.0 |
| D | 8 | 195 | 371599 | 1640.03 | 943 | 916 | 226.0 |
| D | 13 | 122 | 264296 | 1165.28 | 943 | 916 | 226.0 |
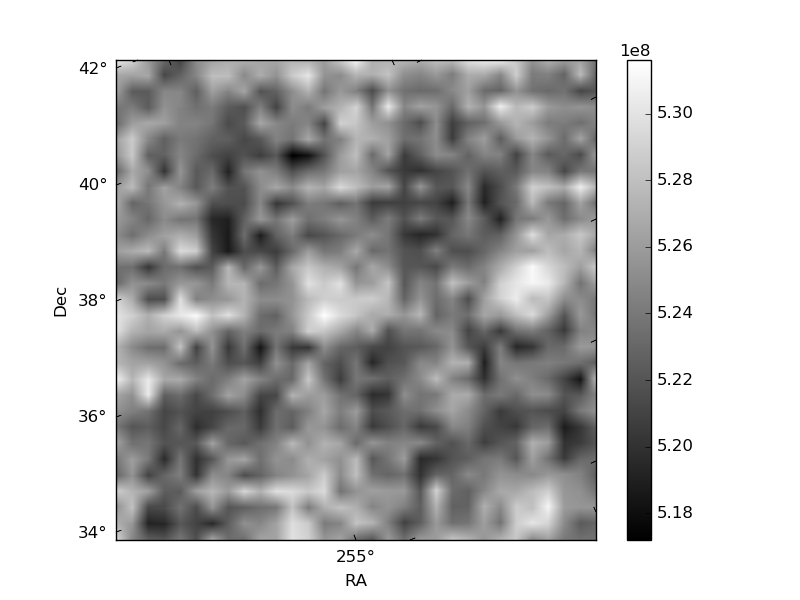
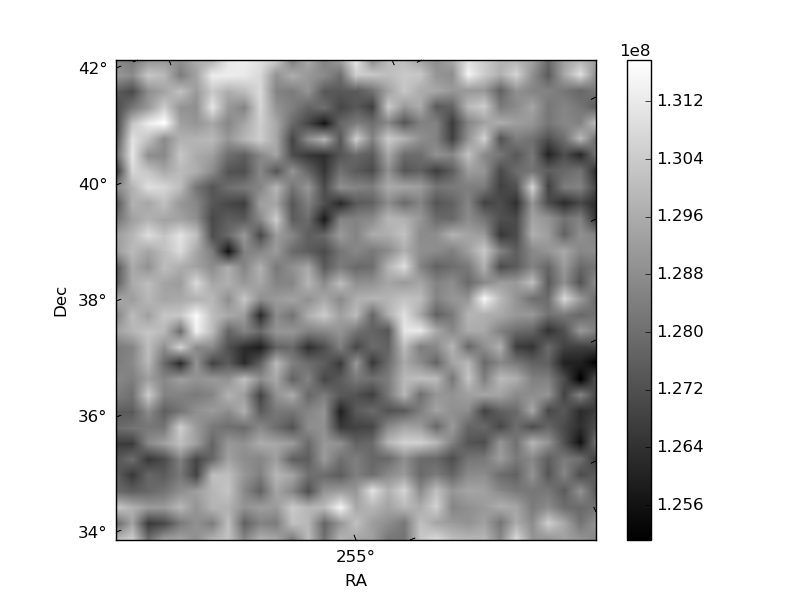
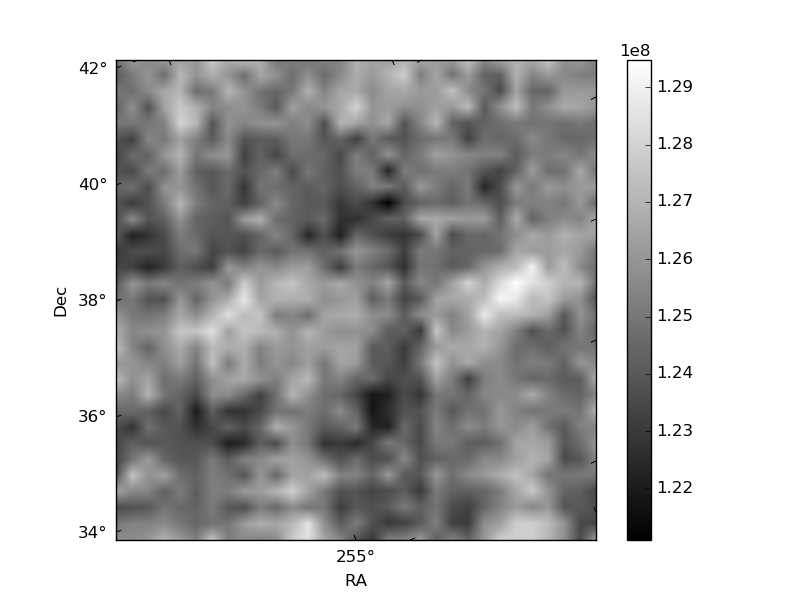
Histogram calculated using DETX and DETY for each event in the final _common_clean file
| Quadrant A | 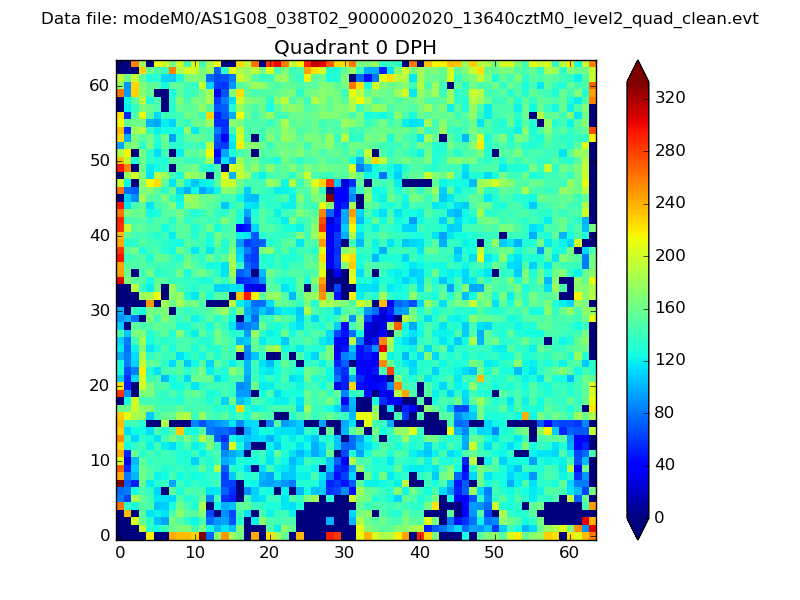 |
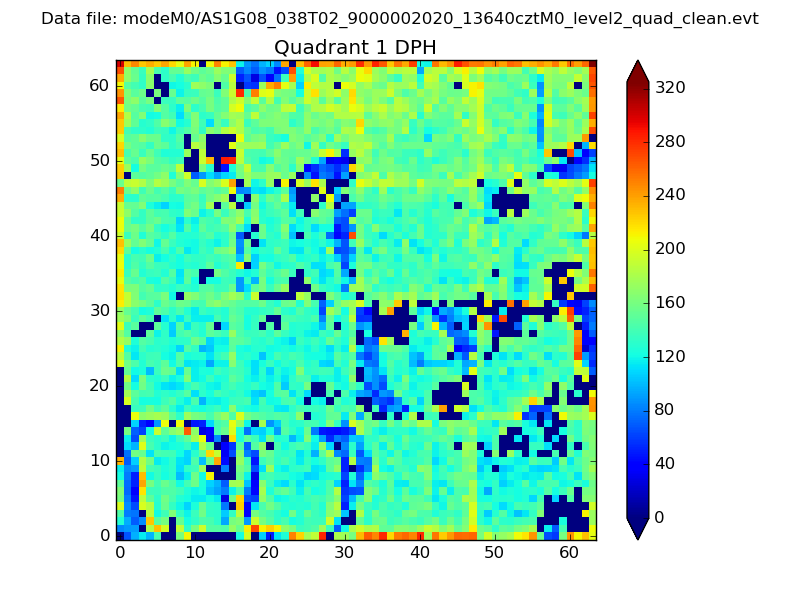 |
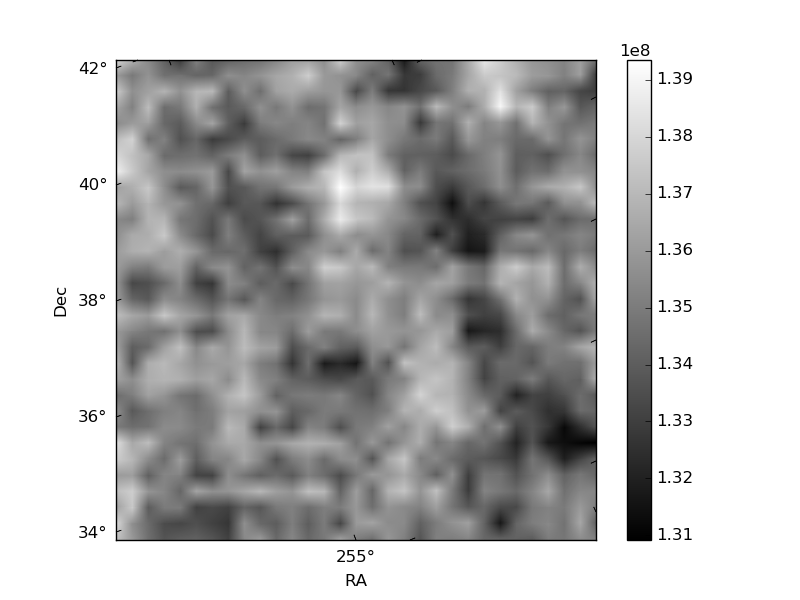
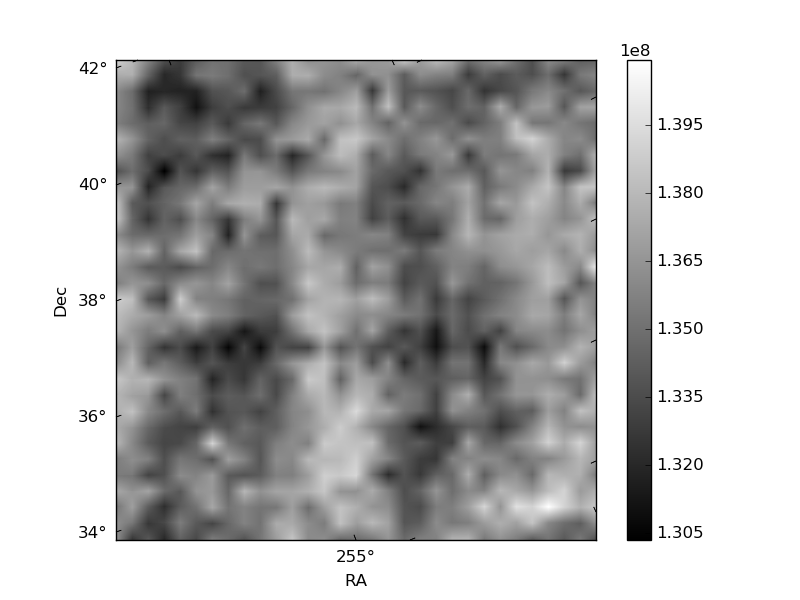
Quadrant B |
|---|---|---|---|
| Quadrant D | 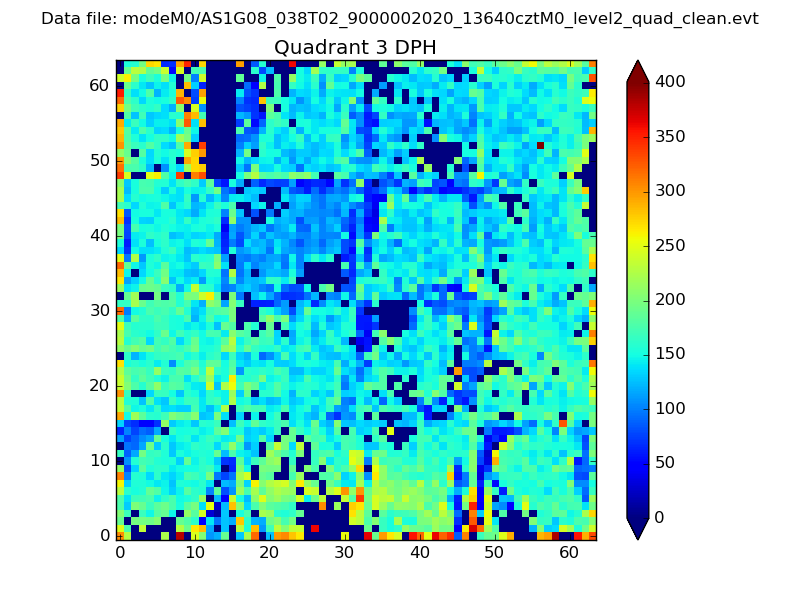 |
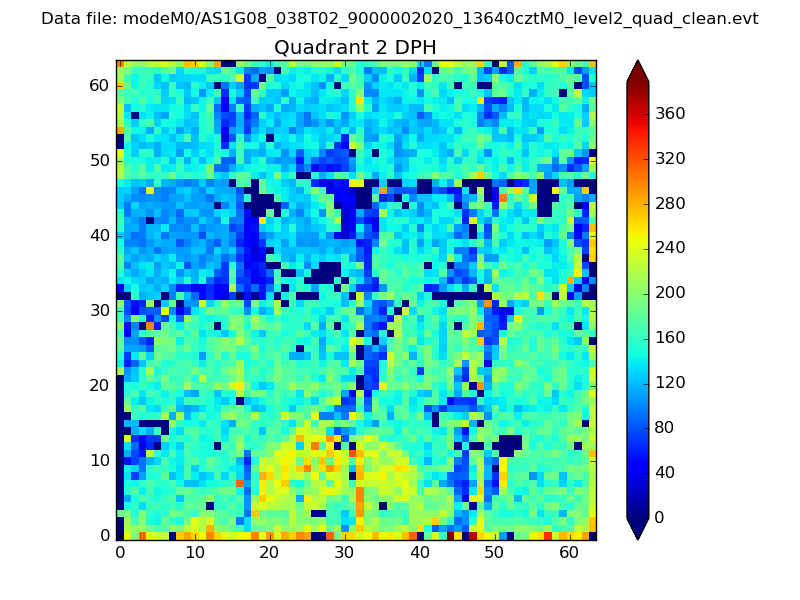 |
Quadrant C |
| Plot type | Count rate plots | Images |
|---|---|---|
| Comparison with Poisson distribution Blue bars denote a histogram of data divided into 1 sec bins. Red curve is a Poisson curve with rate = median count rate of data. |
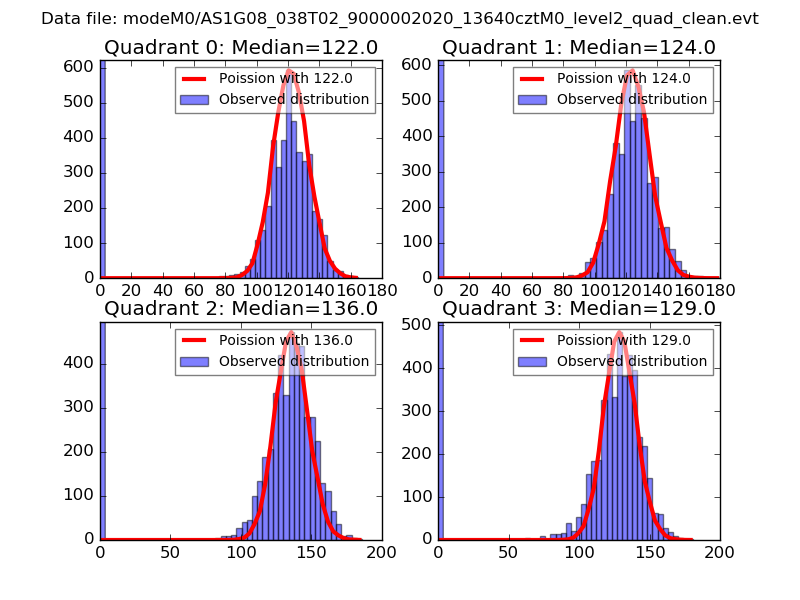 |
 |
| Quadrant-wise count rates Data is divided into 100 sec bins |
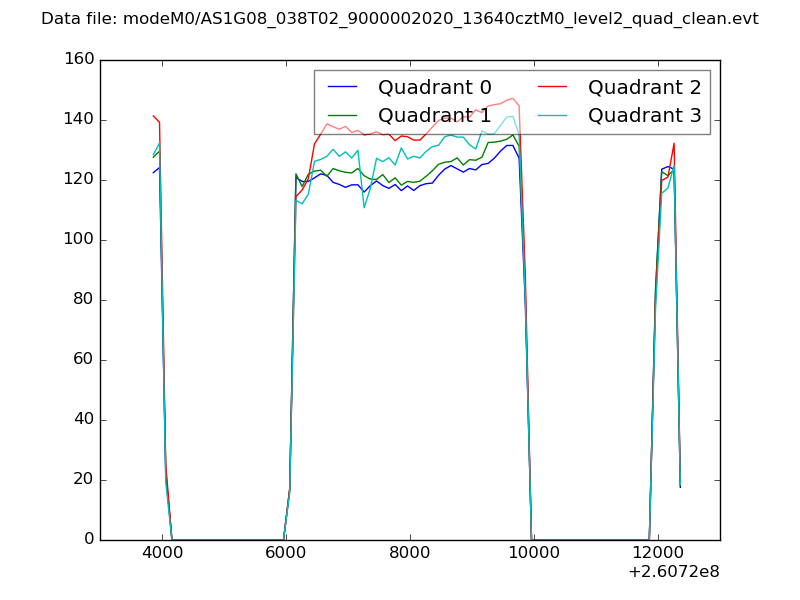 |
|
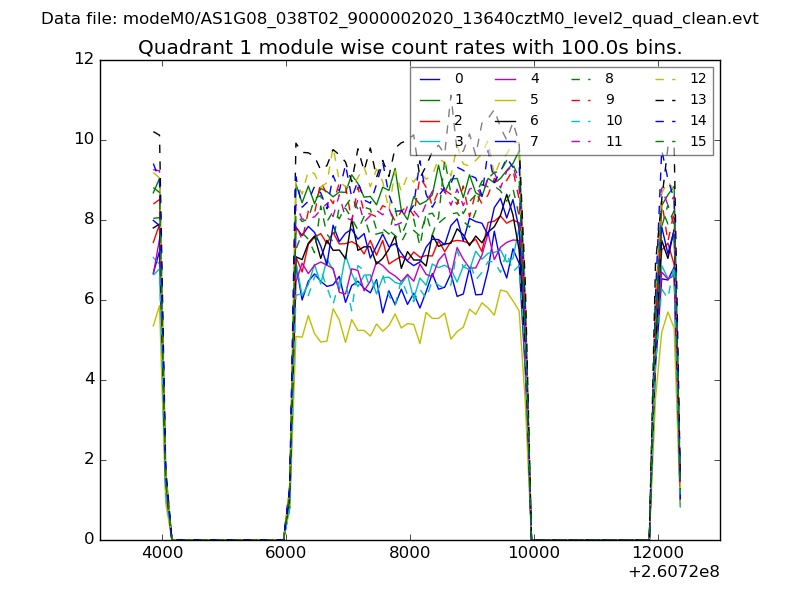
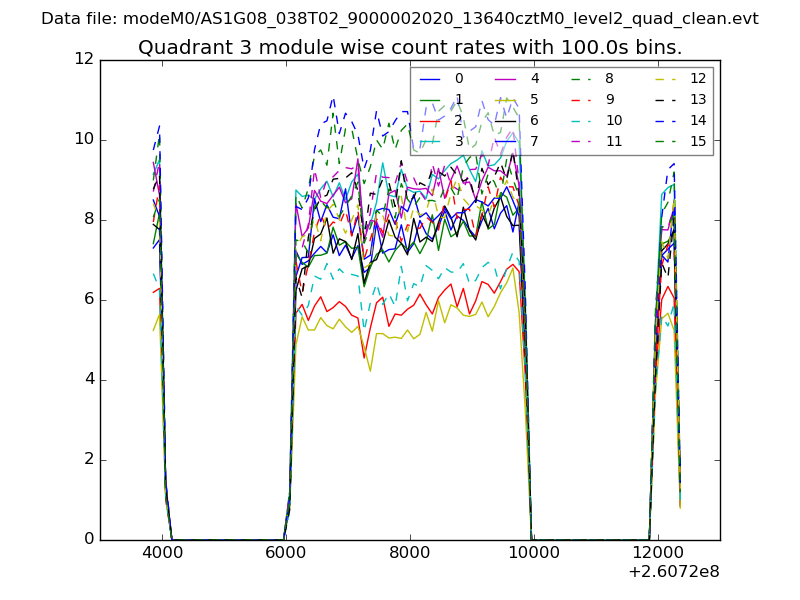
| Module-wise count rates for Quadrant A Data is divided into 100 sec bins |
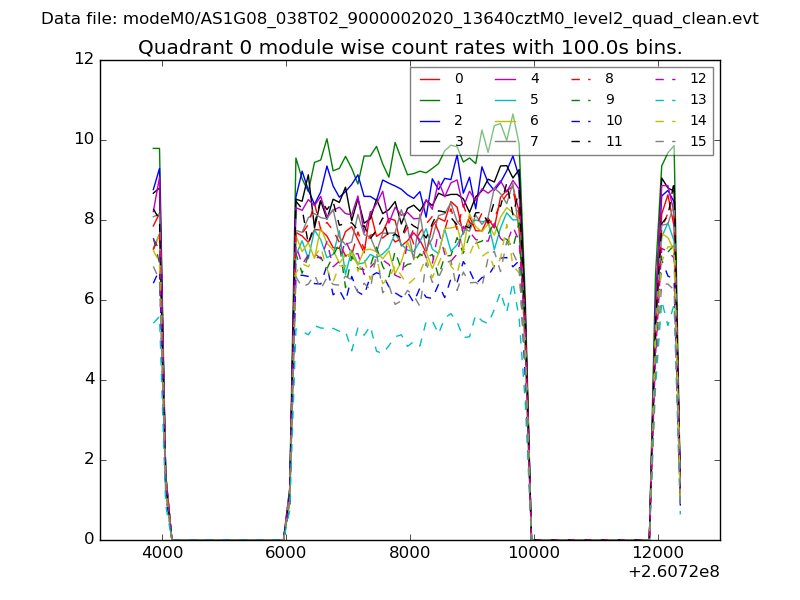 |
 |
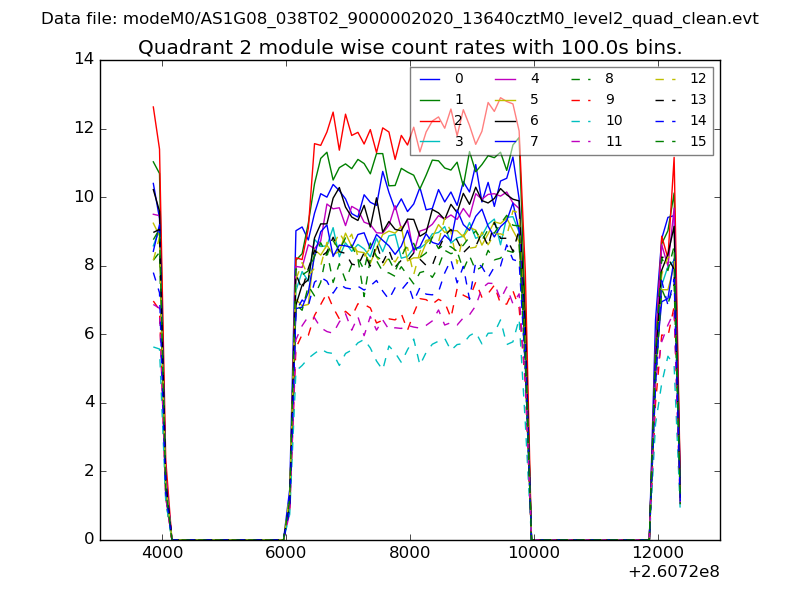
| Module-wise count rates for Quadrant B Data is divided into 100 sec bins |
 |
 |
| Module-wise count rates for Quadrant C Data is divided into 100 sec bins |
 |
 |
| Module-wise count rates for Quadrant D Data is divided into 100 sec bins |
 |
 |
| Parameter | Plot |
|---|---|
| CZT HV Monitor | 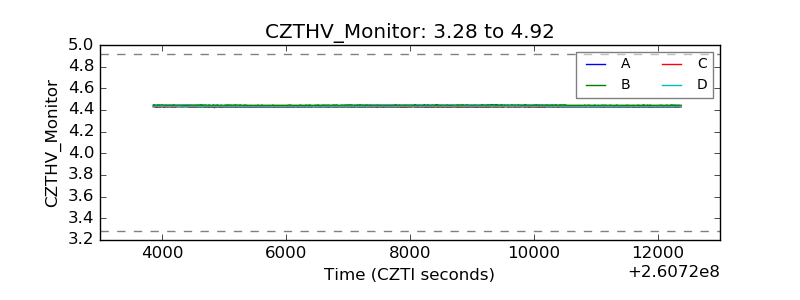 |
| D_VDD | 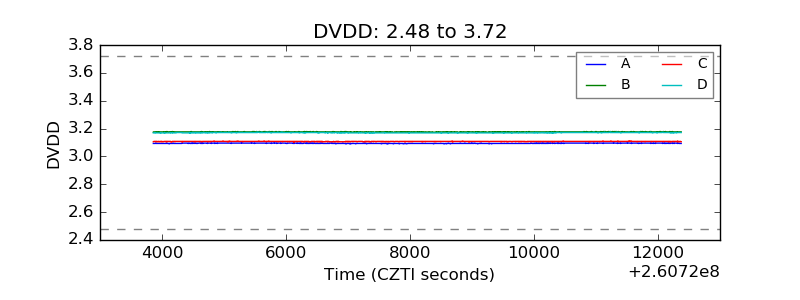 |
| Temperature 1 | 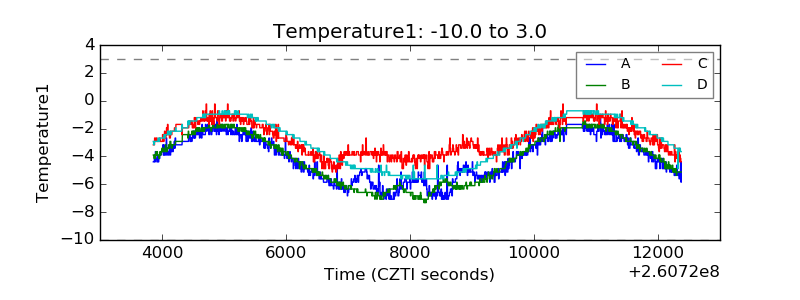 |
| Veto HV Monitor | 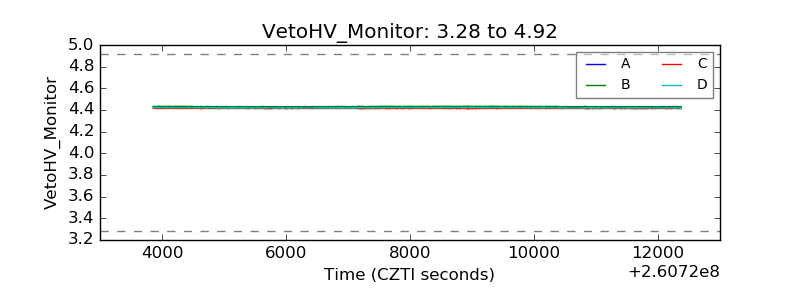 |
| Veto LLD | 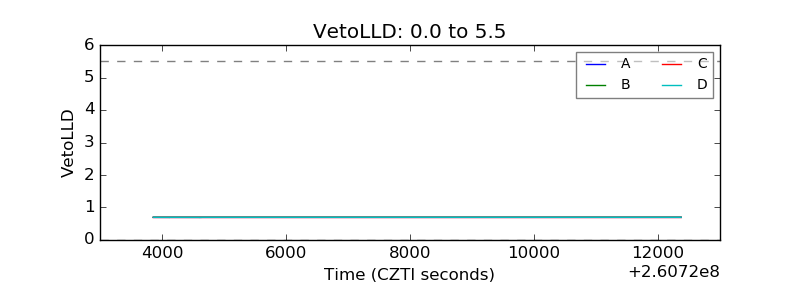 |
| Alpha Counter | 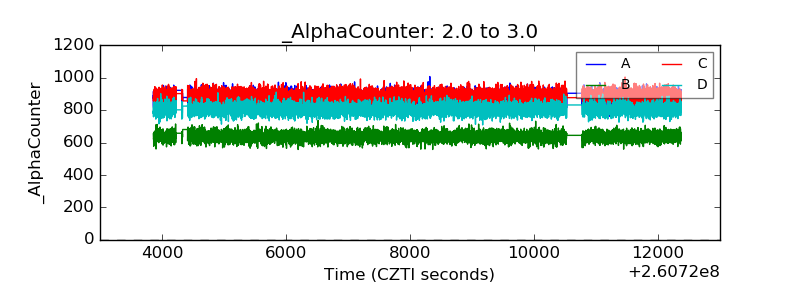 |
| _CPM_Rate | 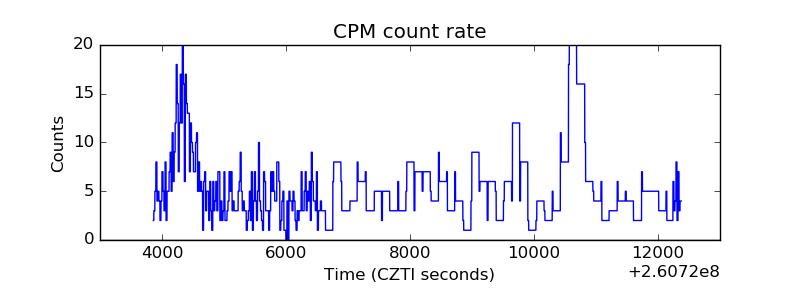 |
| CZT Counter | 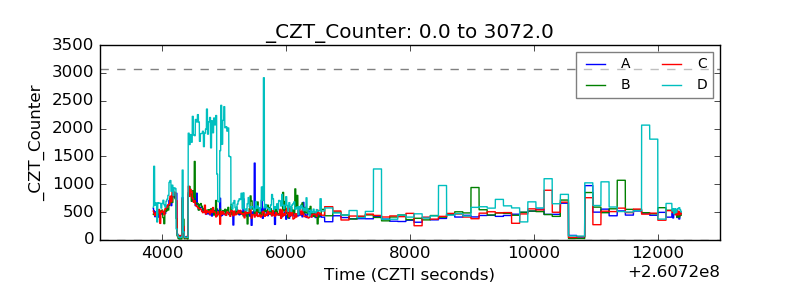 |
| +2.5 Volts monitor | 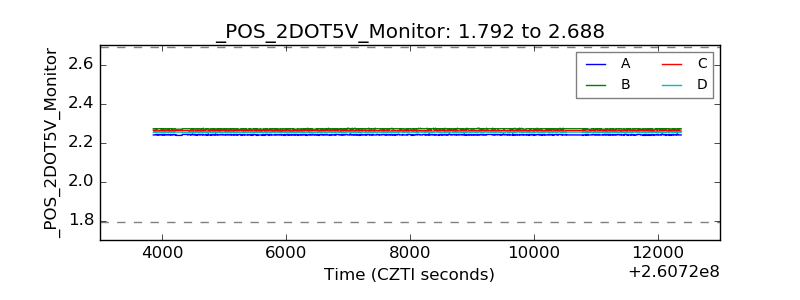 |
| +5 Volts monitor |  |
| _ROLL_ROT | 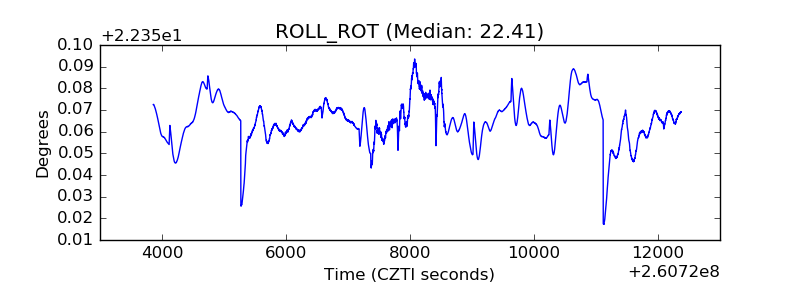 |
| _Roll_DEC | 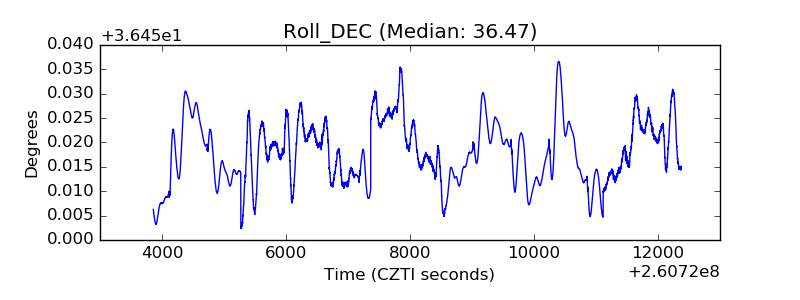 |
| _Roll_RA | 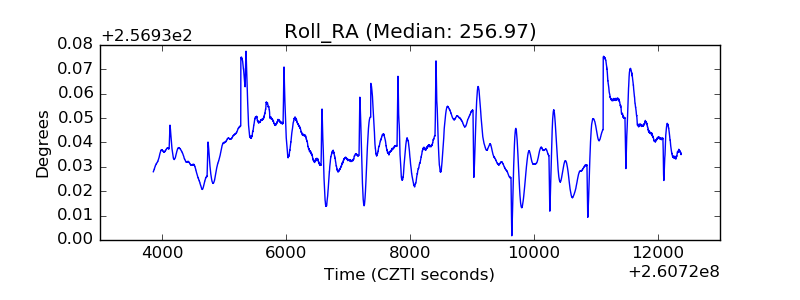 |
| Veto Counter |  |