| Param | Original file | Final file |
|---|---|---|
| Filename | modeM0/AS1G08_038T02_9000002020_13643cztM0_level2.evt | modeM0/AS1G08_038T02_9000002020_13643cztM0_level2_quad_clean.evt |
| Size (bytes) | 909,146,880 | 159,416,640 |
| Size | 867.0 MB | 152.0 MB |
| Events in quadrant A | 5,837,109 | 943,730 |
| Events in quadrant B | 6,654,609 | 962,120 |
| Events in quadrant C | 6,363,896 | 1,059,641 |
| Events in quadrant D | 7,820,388 | 986,877 |
| Mode SS | |||
|---|---|---|---|
| Quadrant | BADHDUFLAG | Total packets | Discarded packets |
| A | 0 | 260 | 0 |
| B | 0 | 260 | 0 |
| C | 0 | 260 | 0 |
| D | 0 | 260 | 0 |
| Mode M9 | |||
|---|---|---|---|
| Quadrant | BADHDUFLAG | Total packets | Discarded packets |
| A | 0 | 14 | 0 |
| B | 0 | 14 | 0 |
| C | 0 | 14 | 0 |
| D | 0 | 14 | 0 |
| Mode M0 | |||
|---|---|---|---|
| Quadrant | BADHDUFLAG | Total packets | Discarded packets |
| A | 0 | 26019 | 3 |
| B | 0 | 28189 | 3 |
| C | 0 | 26568 | 3 |
| D | 0 | 31749 | 3 |
| Quadrant | Total seconds | Saturated seconds | Saturation percentage |
|---|---|---|---|
| A | 12670 | 157 | 1.239148% |
| B | 12670 | 289 | 2.280979% |
| C | 12670 | 170 | 1.341752% |
| D | 12670 | 427 | 3.370166% |
Noise dominated data is calculated using 1-second bins in cleaned event files. If a bin has >2000 counts, and if more than 50% of those come from <1% of pixels, then it is considered to be noise-dominated and hence unusable.
| Quadrant | # 1 sec bins | Bins with >0 counts | Bins with >2000 counts | High rate bins dominated by noise | Noise dominated (total time) | Noise dominated (detector-on time) | Marked lightcurve |
|---|---|---|---|---|---|---|---|
| A | 14076 | 12674 | 1 | 1 | 0.01% | 0.01% | 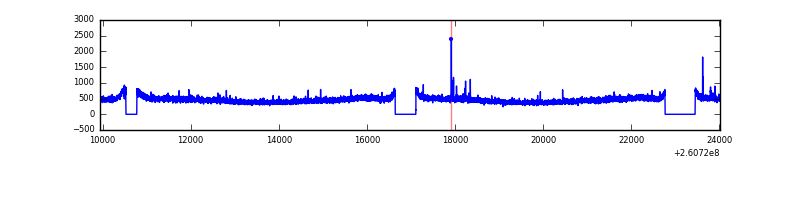 |
| B | 14076 | 12674 | 39 | 39 | 0.28% | 0.31% | 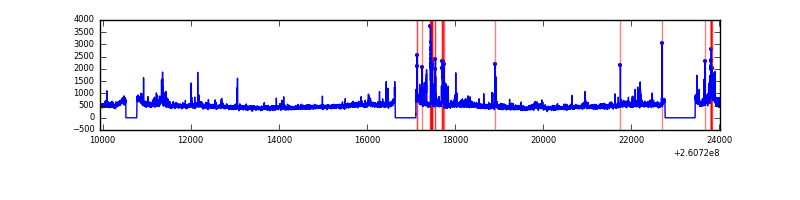 |
| C | 14076 | 12674 | 23 | 23 | 0.16% | 0.18% | 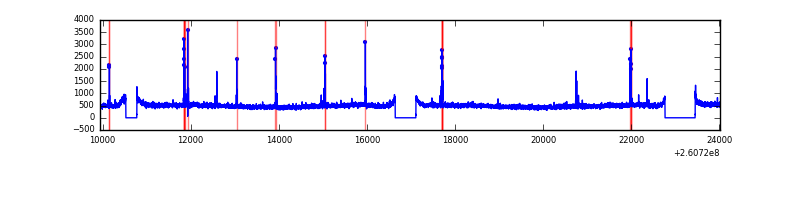 |
| D | 14076 | 12674 | 218 | 218 | 1.55% | 1.72% | 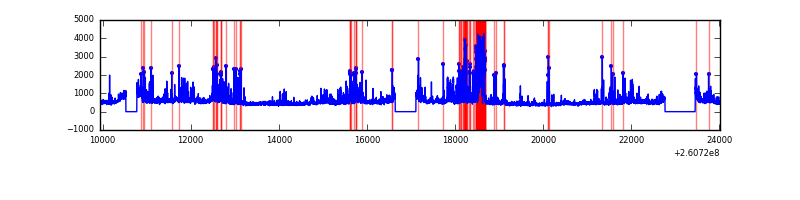 |
Top three noisy pixels from each quadrant. If the there are fewer than three noisy pixels in the level2.evt file, extra rows are filled as -1
| Pixel properties | Quadrant properties | ||||||
|---|---|---|---|---|---|---|---|
| Quadrant | DetID | PixID | Counts | Sigma | Mean | Median | Sigma |
| A | 15 | 69 | 30101 | 93.23 | 1509 | 1476 | 307.0 |
| A | 0 | 226 | 13402 | 38.84 | 1509 | 1476 | 307.0 |
| A | 12 | 194 | 11541 | 32.78 | 1509 | 1476 | 307.0 |
| B | 0 | 219 | 346856 | 1210.22 | 1504 | 1464 | 285.4 |
| B | 4 | 142 | 147773 | 512.65 | 1504 | 1464 | 285.4 |
| B | 3 | 64 | 147029 | 510.04 | 1504 | 1464 | 285.4 |
| C | 3 | 233 | 390723 | 1144.65 | 1495 | 1509 | 340.0 |
| C | 14 | 234 | 136842 | 398.0 | 1495 | 1509 | 340.0 |
| C | 13 | 61 | 10808 | 27.35 | 1495 | 1509 | 340.0 |
| D | 5 | 222 | 1170910 | 3313.92 | 1477 | 1438 | 352.9 |
| D | 8 | 195 | 377183 | 1064.74 | 1477 | 1438 | 352.9 |
| D | 13 | 122 | 283650 | 799.7 | 1477 | 1438 | 352.9 |
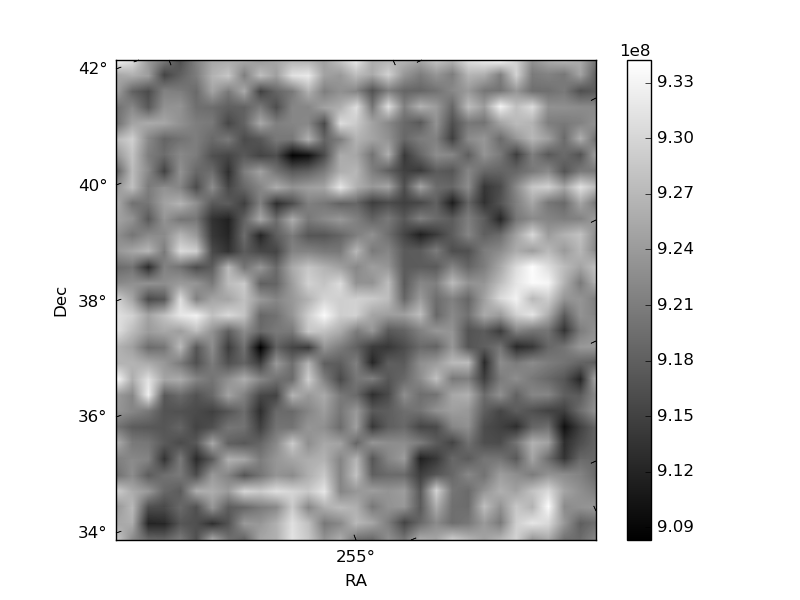
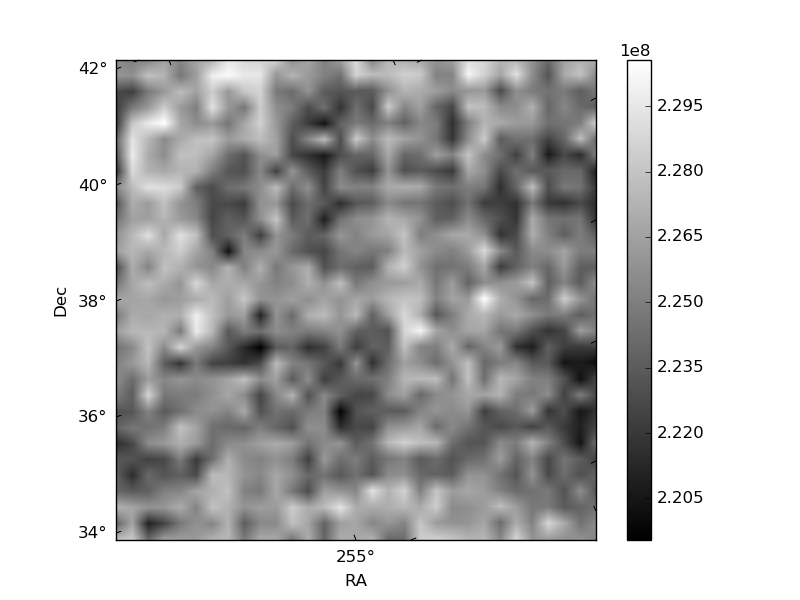
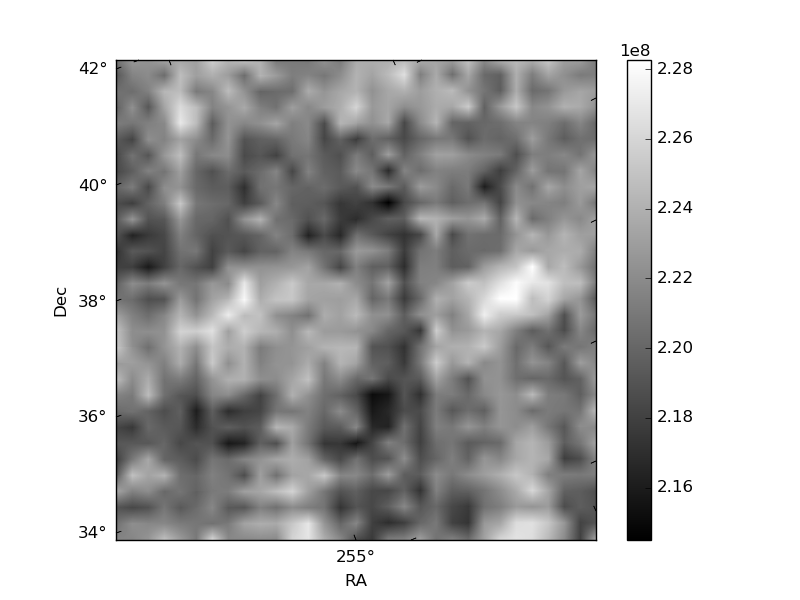
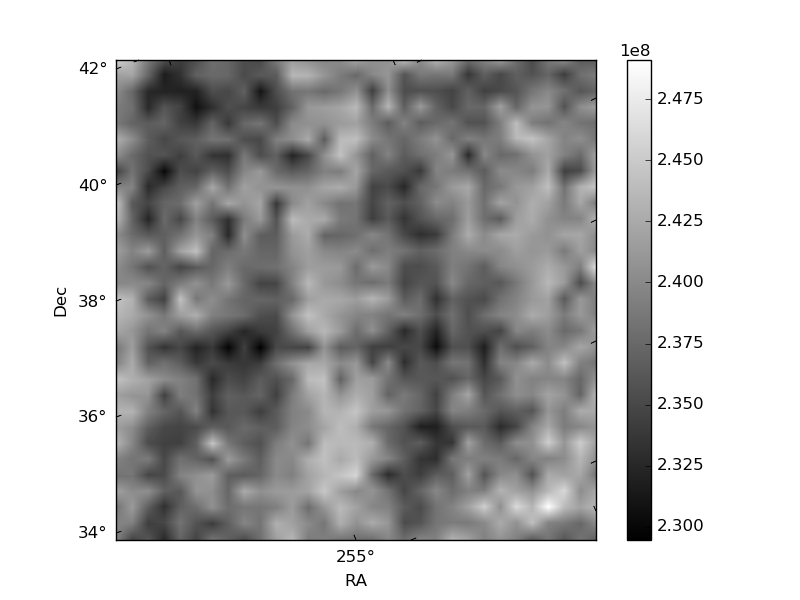
Histogram calculated using DETX and DETY for each event in the final _common_clean file
| Quadrant A | 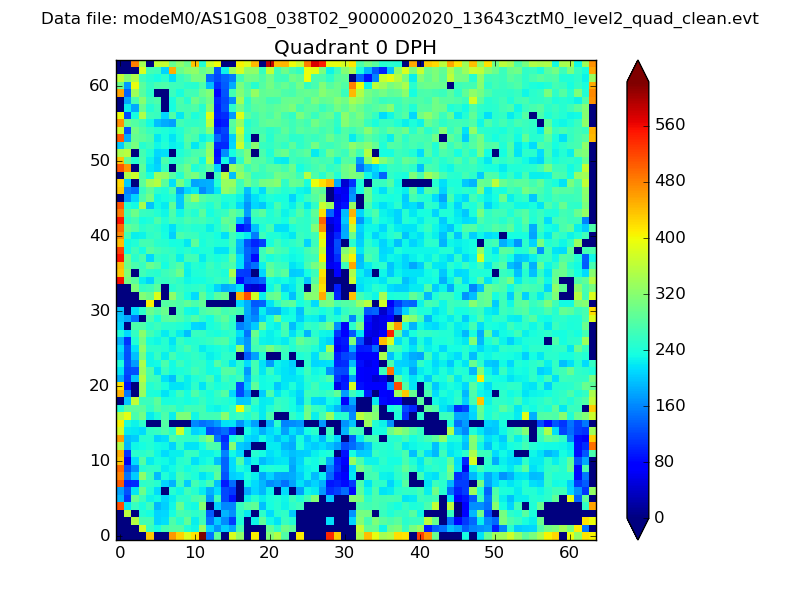 |
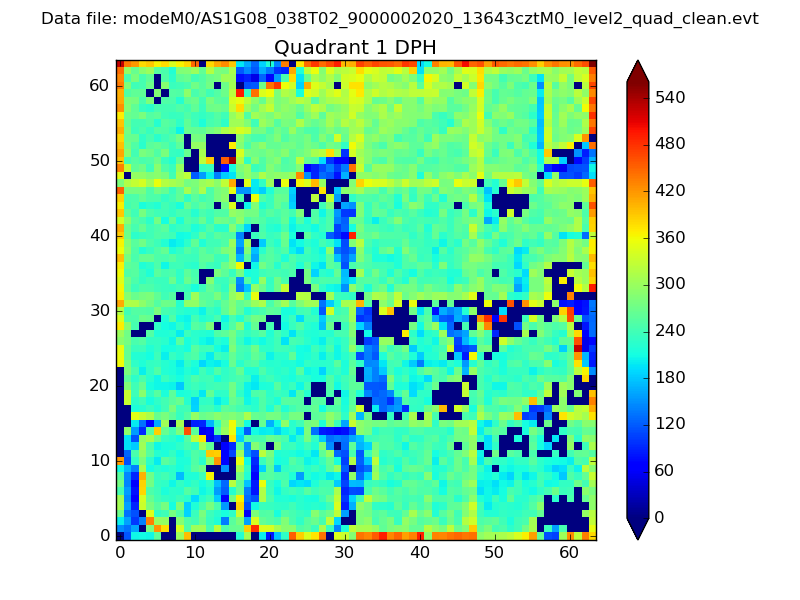 |
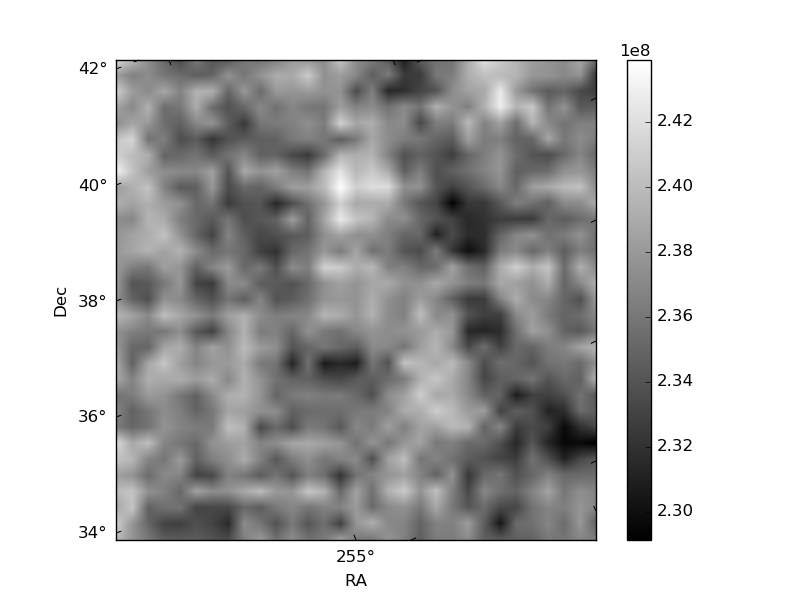
Quadrant B |
|---|---|---|---|
| Quadrant D | 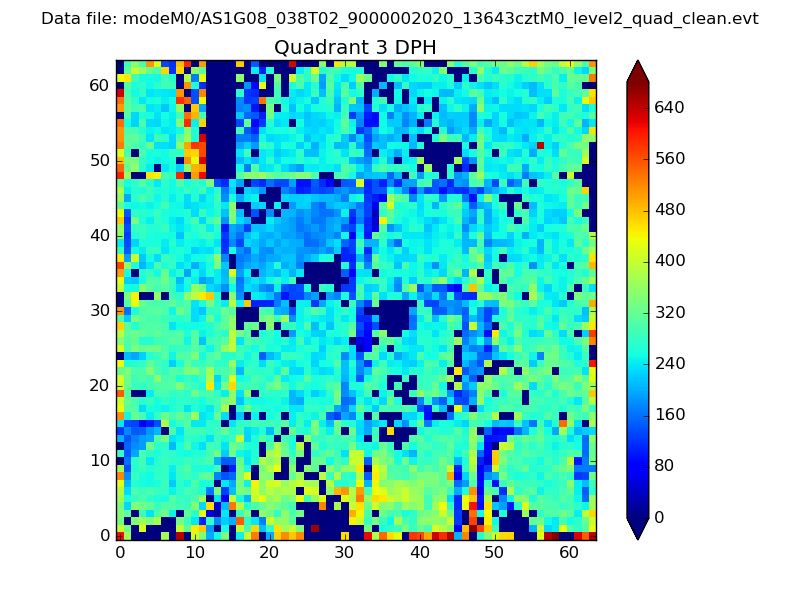 |
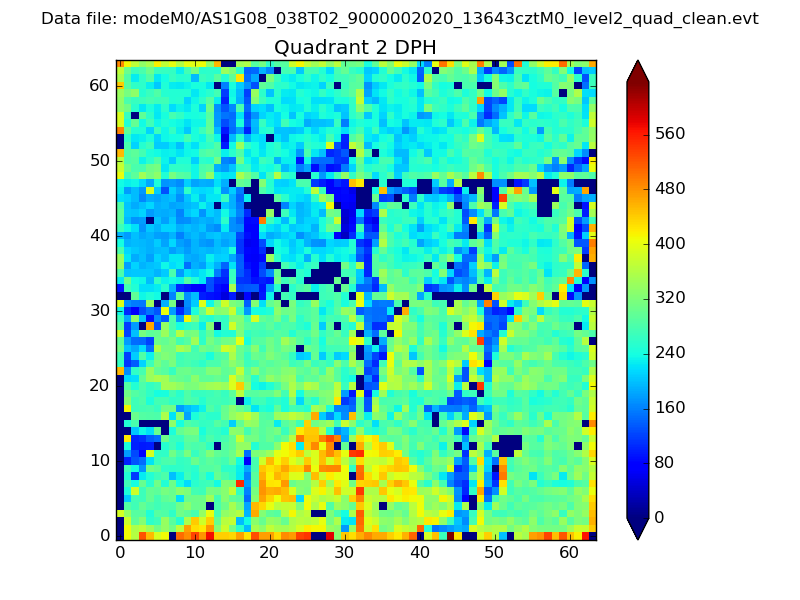 |
Quadrant C |
| Plot type | Count rate plots | Images |
|---|---|---|
| Comparison with Poisson distribution Blue bars denote a histogram of data divided into 1 sec bins. Red curve is a Poisson curve with rate = median count rate of data. |
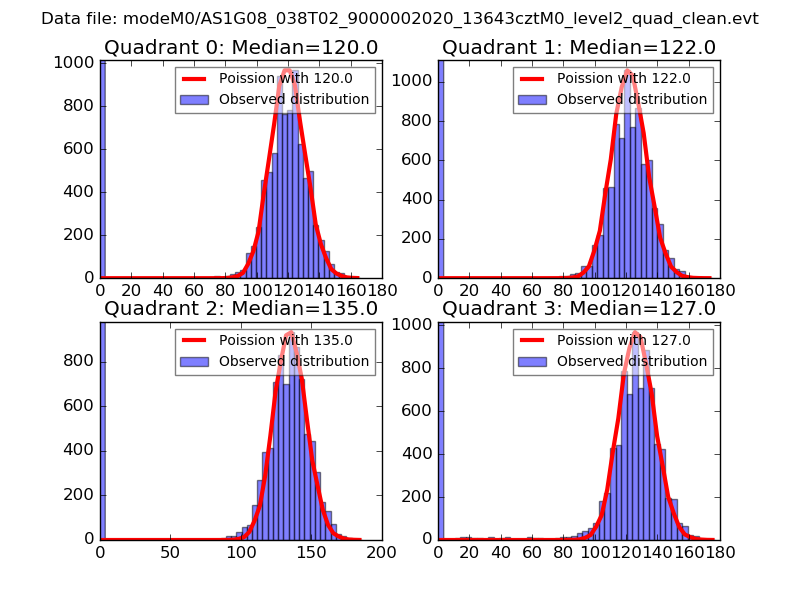 |
 |
| Quadrant-wise count rates Data is divided into 100 sec bins |
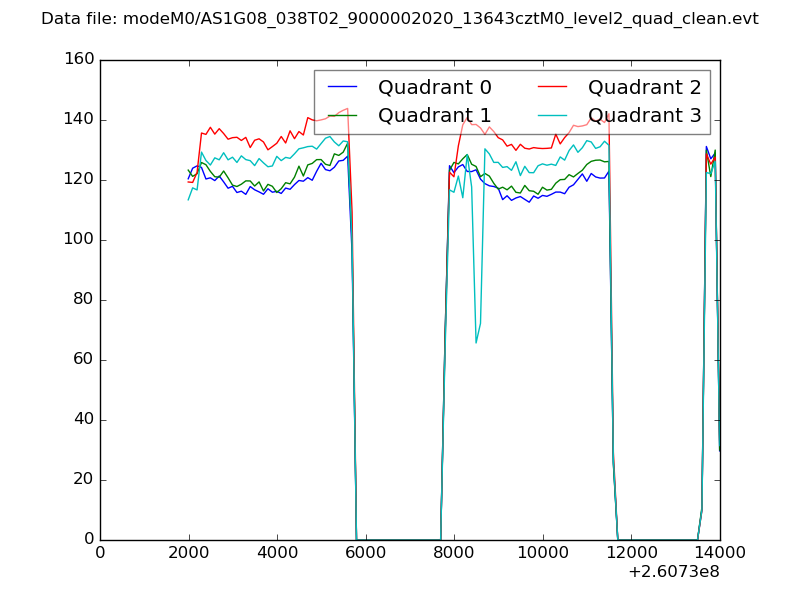 |
|
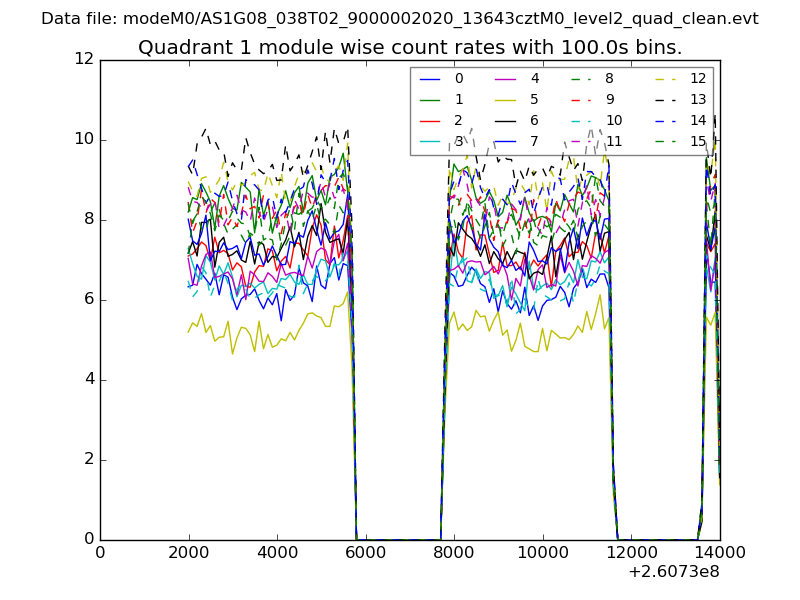
| Module-wise count rates for Quadrant A Data is divided into 100 sec bins |
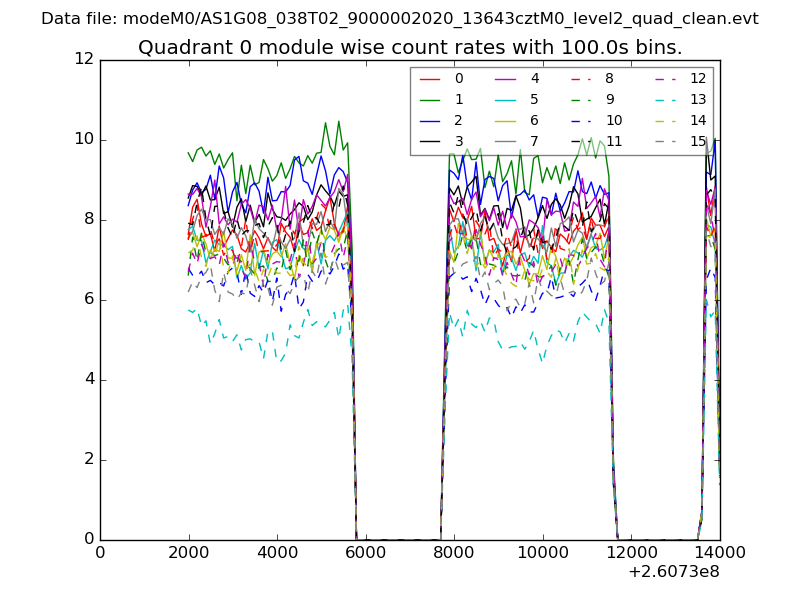 |
 |
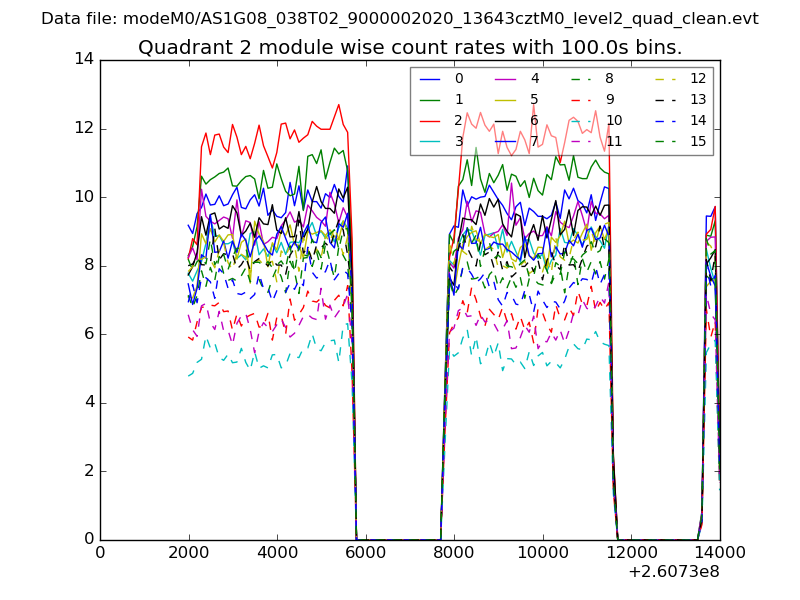
| Module-wise count rates for Quadrant B Data is divided into 100 sec bins |
 |
 |
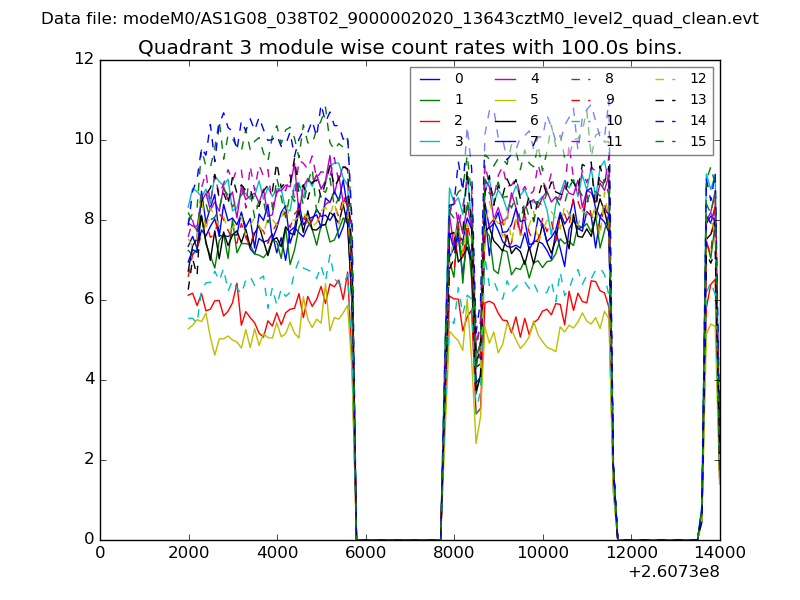
| Module-wise count rates for Quadrant C Data is divided into 100 sec bins |
 |
 |
| Module-wise count rates for Quadrant D Data is divided into 100 sec bins |
 |
 |
| Parameter | Plot |
|---|---|
| CZT HV Monitor | 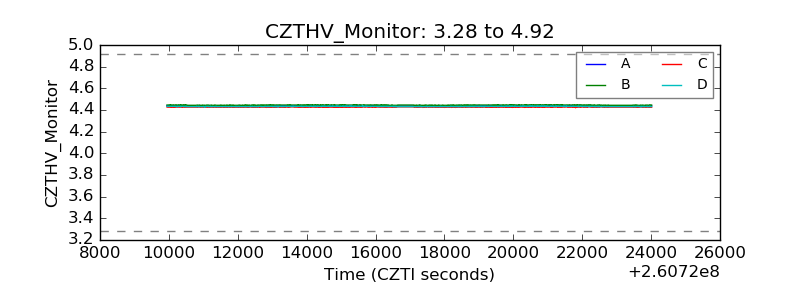 |
| D_VDD | 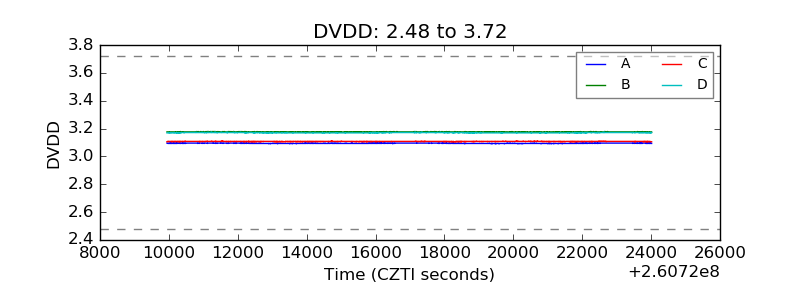 |
| Temperature 1 | 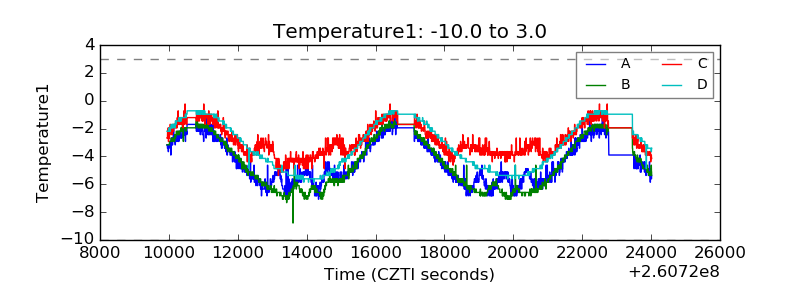 |
| Veto HV Monitor | 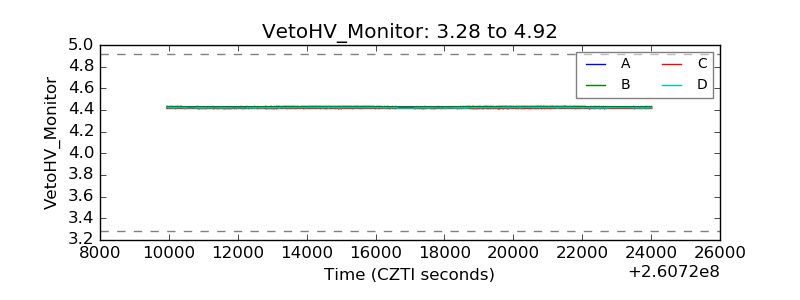 |
| Veto LLD | 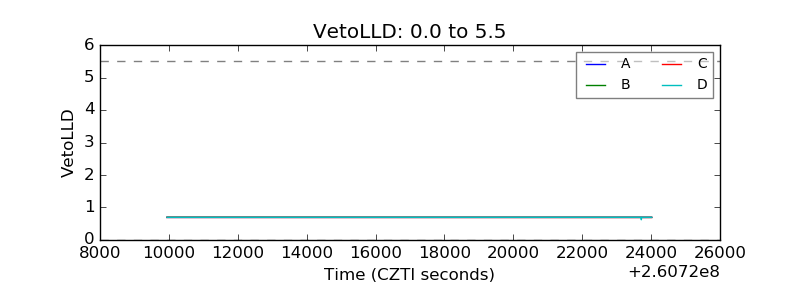 |
| Alpha Counter | 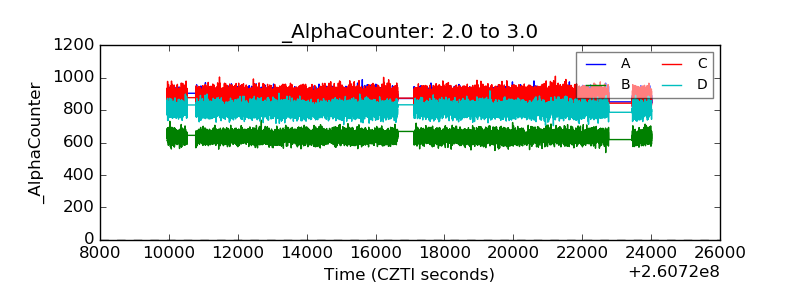 |
| _CPM_Rate | 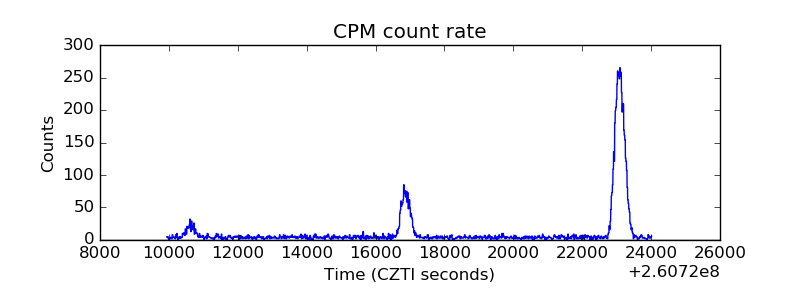 |
| CZT Counter | 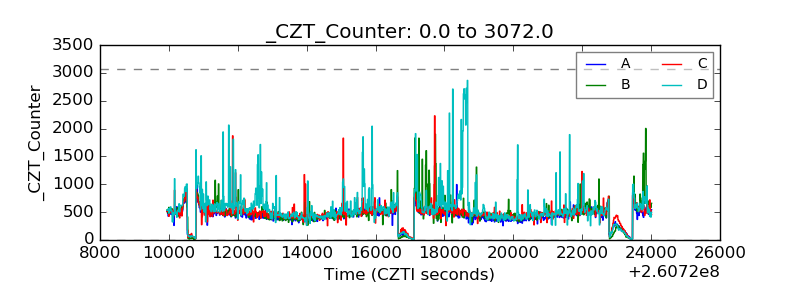 |
| +2.5 Volts monitor | 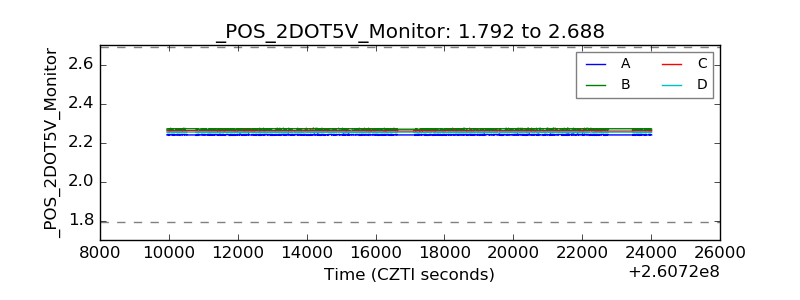 |
| +5 Volts monitor |  |
| _ROLL_ROT | 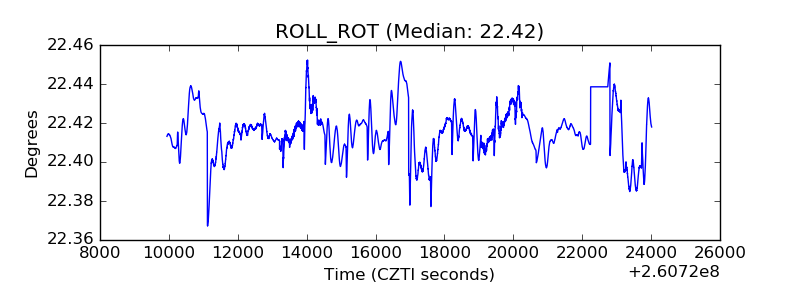 |
| _Roll_DEC |  |
| _Roll_RA | 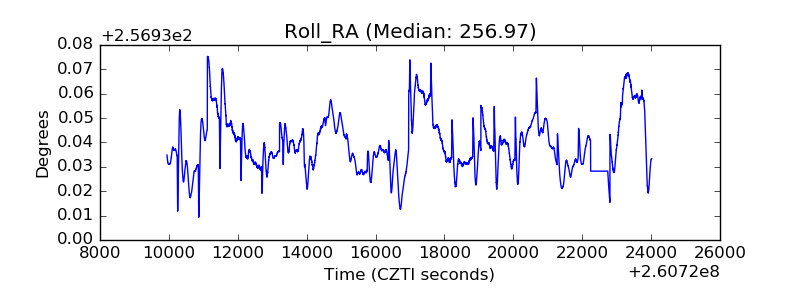 |
| Veto Counter | 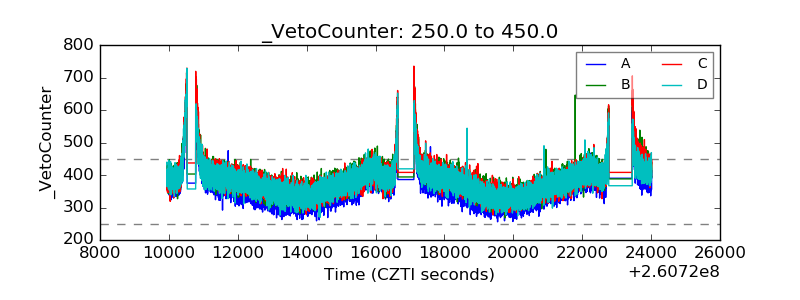 |