| Param | Original file | Final file |
|---|---|---|
| Filename | modeM0/AS1G08_083T03_9000002022cztM0_level2.fits | modeM0/AS1G08_083T03_9000002022cztM0_level2_quad_clean.evt |
| Size (bytes) | 484,655,040 | 388,699,200 |
| Size | 462.2 MB | 370.7 MB |
| Events in quadrant A | 2,973,706 | 2,200,487 |
| Events in quadrant B | 2,886,008 | 2,212,288 |
| Events in quadrant C | 2,952,944 | 2,107,957 |
| Events in quadrant D | 2,559,460 | 1,943,457 |
| Mode M0 | |||
|---|---|---|---|
| Quadrant | BADHDUFLAG | Total packets | Discarded packets |
| A | 0 | 99410 | 0 |
| B | 0 | 102582 | 0 |
| C | 0 | 101165 | 0 |
| D | 0 | 104383 | 0 |
| Mode M9 | |||
|---|---|---|---|
| Quadrant | BADHDUFLAG | Total packets | Discarded packets |
| A | 0 | 98 | 0 |
| B | 0 | 98 | 0 |
| C | 0 | 98 | 0 |
| D | 0 | 98 | 0 |
| Mode SS | |||
|---|---|---|---|
| Quadrant | BADHDUFLAG | Total packets | Discarded packets |
| A | 0 | 984 | 0 |
| B | 0 | 984 | 0 |
| C | 0 | 984 | 0 |
| D | 0 | 984 | 0 |
| Quadrant | Total seconds | Saturated seconds | Saturation percentage |
|---|---|---|---|
| A | 48173 | 427 | 0.886389% |
| B | 48173 | 589 | 1.222677% |
| C | 48173 | 406 | 0.842796% |
| D | 48173 | 505 | 1.048305% |
Noise dominated data is calculated using 1-second bins in cleaned event files. If a bin has >2000 counts, and if more than 50% of those come from <1% of pixels, then it is considered to be noise-dominated and hence unusable.
| Quadrant | # 1 sec bins | Bins with >0 counts | Bins with >2000 counts | High rate bins dominated by noise | Noise dominated (total time) | Noise dominated (detector-on time) | Marked lightcurve |
|---|---|---|---|---|---|---|---|
| A | 58098 | 48173 | 0 | 0 | 0.00% | 0.00% | 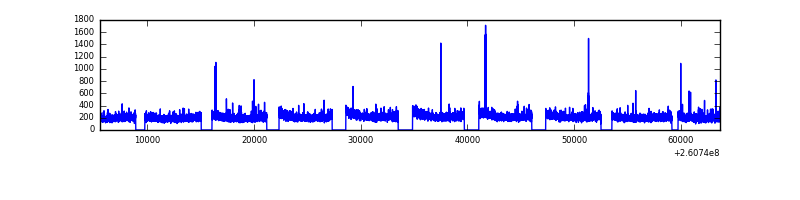 |
| B | 58098 | 48170 | 0 | 0 | 0.00% | 0.00% | 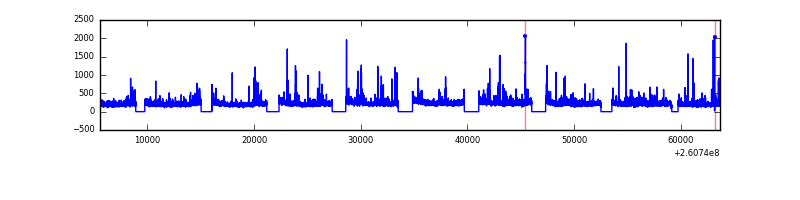 |
| C | 58098 | 48172 | 0 | 0 | 0.00% | 0.00% | 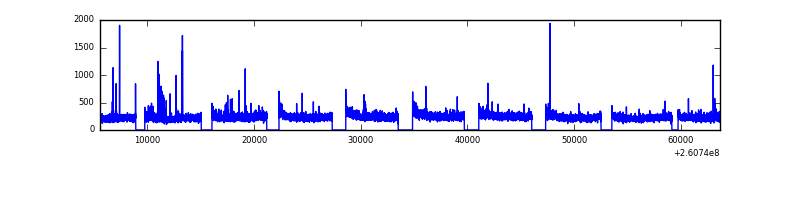 |
| D | 58098 | 48172 | 0 | 0 | 0.00% | 0.00% | 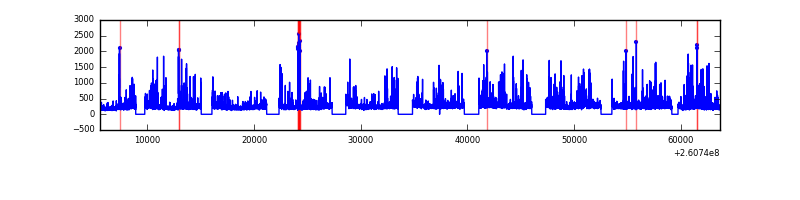 |
Top three noisy pixels from each quadrant. If the there are fewer than three noisy pixels in the level2.evt file, extra rows are filled as -1
| Pixel properties | Quadrant properties | ||||||
|---|---|---|---|---|---|---|---|
| Quadrant | DetID | PixID | Counts | Sigma | Mean | Median | Sigma |
| A | 0 | 29 | 2716 | 10.21 | 775 | 726 | 194.9 |
| A | 7 | 110 | 2355 | 8.35 | 775 | 726 | 194.9 |
| A | 9 | 19 | 2147 | 7.29 | 775 | 726 | 194.9 |
| B | 2 | 9 | 2485 | 11.74 | 760 | 728 | 149.7 |
| B | 14 | 254 | 1924 | 7.99 | 760 | 728 | 149.7 |
| B | 2 | 8 | 1878 | 7.68 | 760 | 728 | 149.7 |
| C | 1 | 81 | 2177 | 7.25 | 779 | 729 | 199.8 |
| C | 1 | 80 | 2143 | 7.08 | 779 | 729 | 199.8 |
| C | 12 | 241 | 1986 | 6.29 | 779 | 729 | 199.8 |
| D | 6 | 231 | 1866 | 6.16 | 730 | 664 | 195.2 |
| D | 3 | 14 | 1864 | 6.15 | 730 | 664 | 195.2 |
| D | 10 | 189 | 1813 | 5.89 | 730 | 664 | 195.2 |
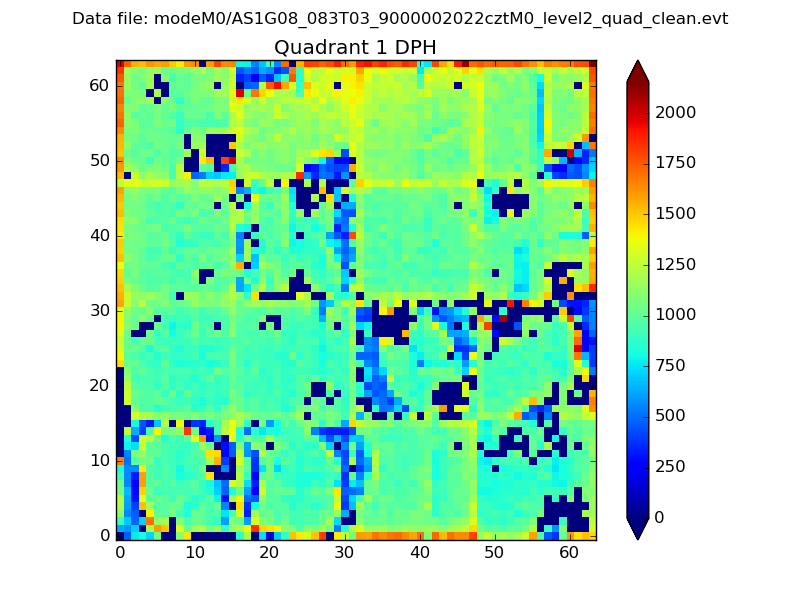
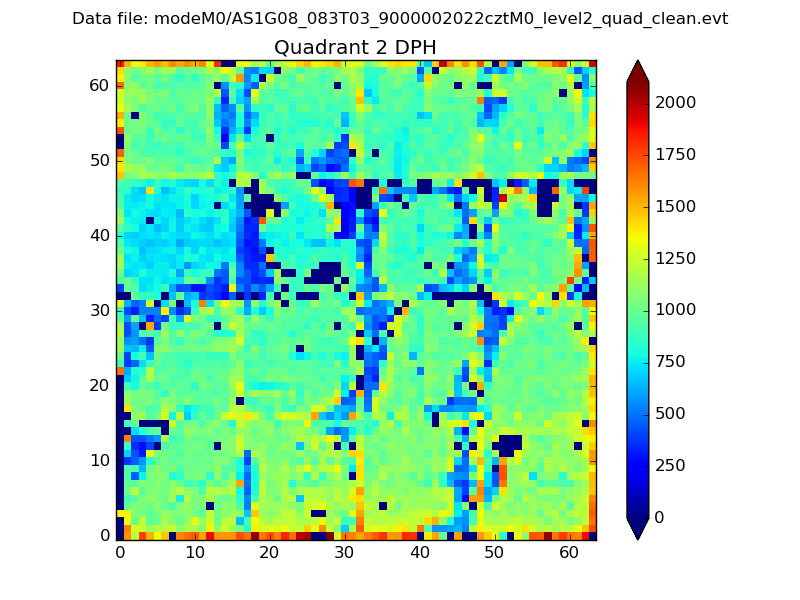
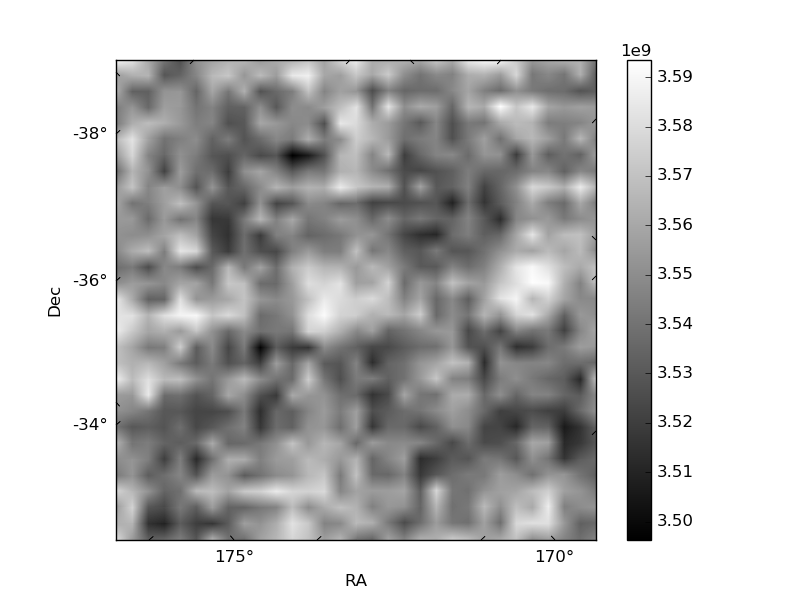
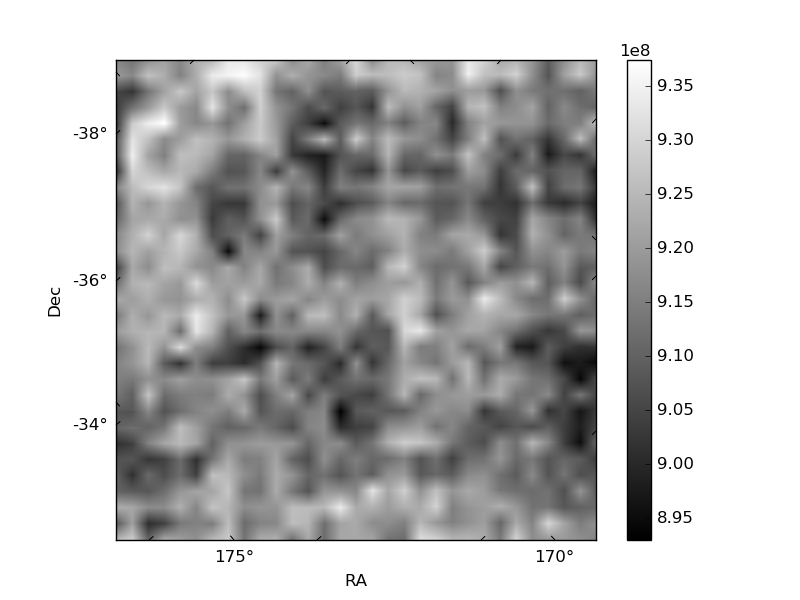
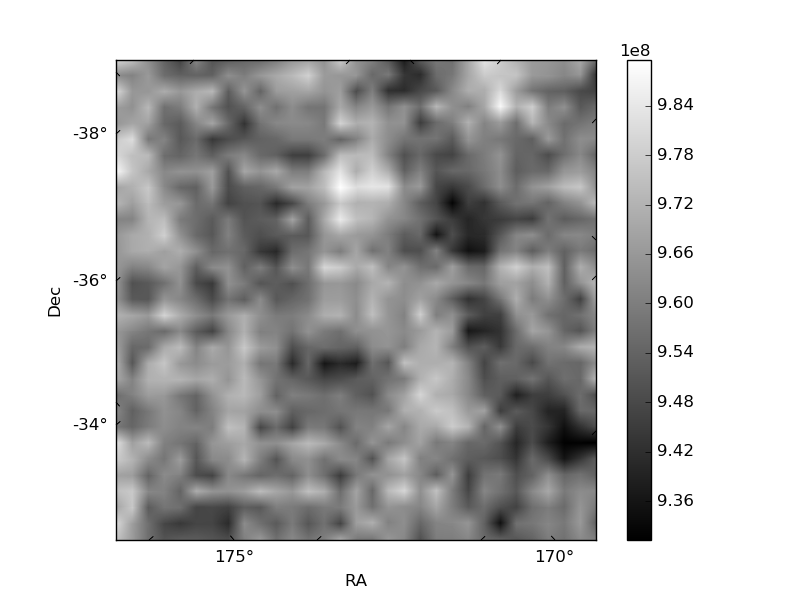
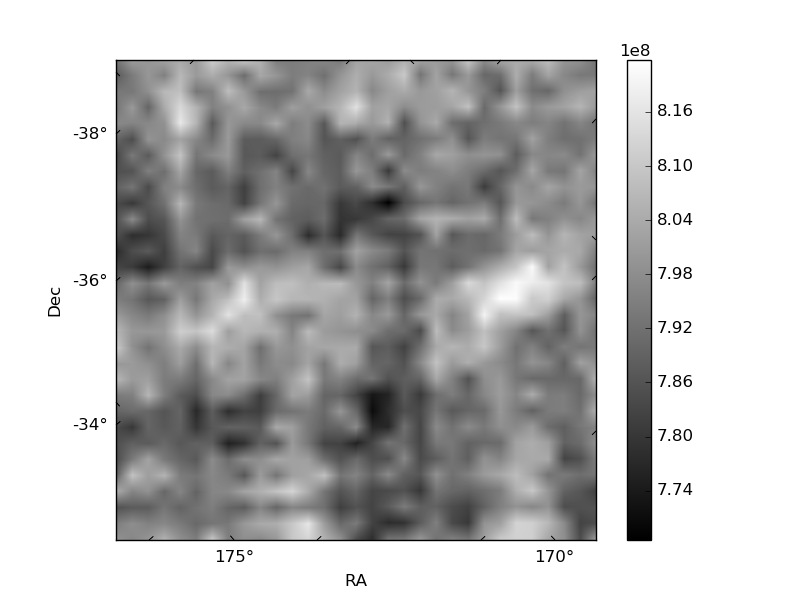
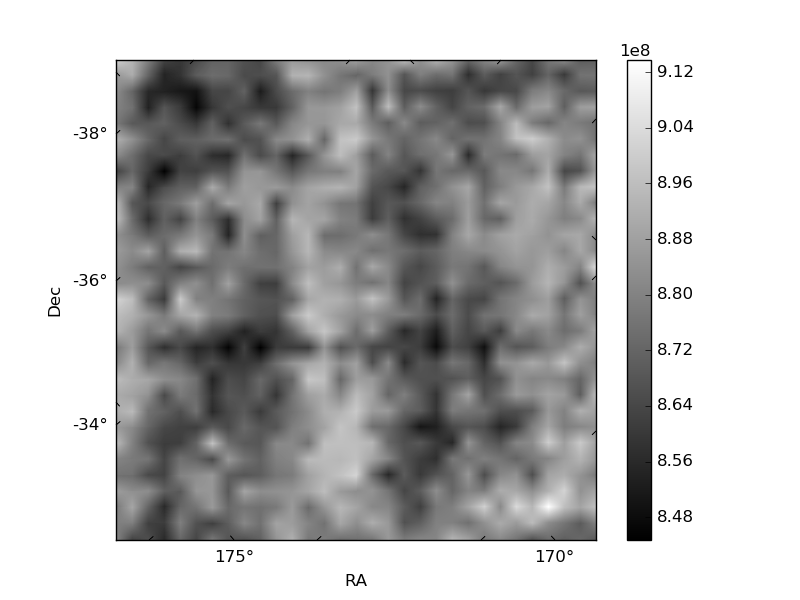
Histogram calculated using DETX and DETY for each event in the final _common_clean file
| Quadrant A |  |
 |
Quadrant B |
|---|---|---|---|
| Quadrant D | 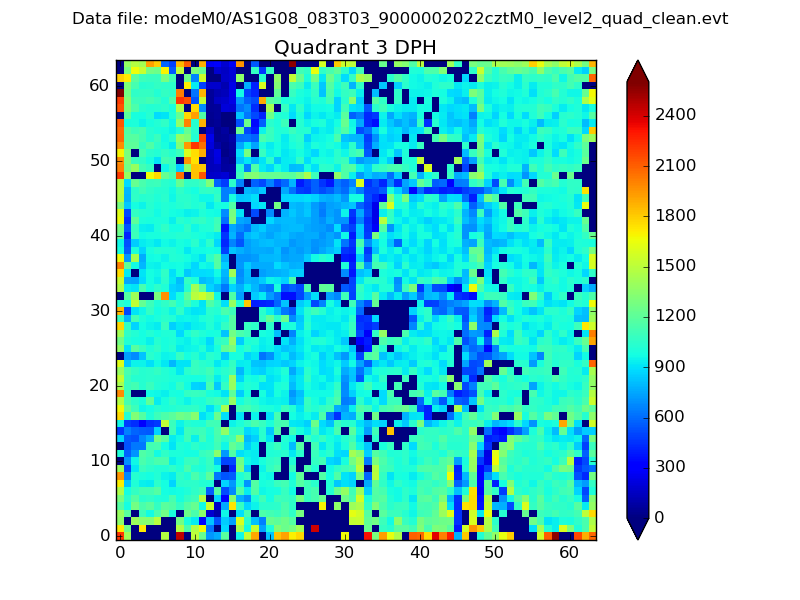 |
 |
Quadrant C |
| Plot type | Count rate plots | Images |
|---|---|---|
| Comparison with Poisson distribution Blue bars denote a histogram of data divided into 1 sec bins. Red curve is a Poisson curve with rate = median count rate of data. |
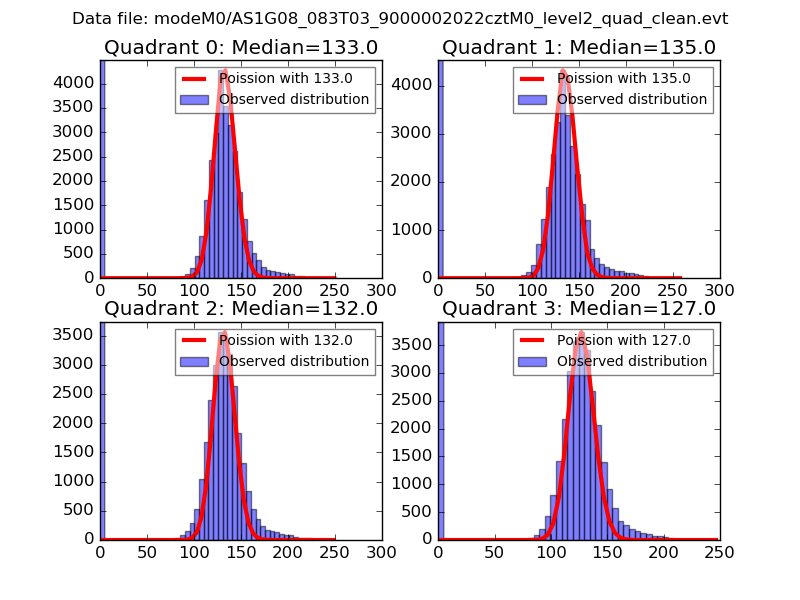 |
 |
| Quadrant-wise count rates Data is divided into 100 sec bins |
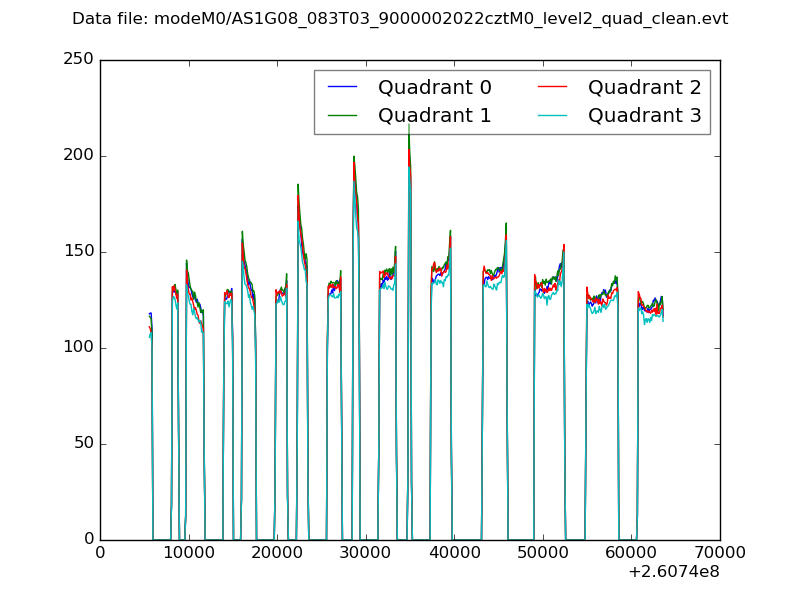 |
|
| Module-wise count rates for Quadrant A Data is divided into 100 sec bins |
 |
 |
| Module-wise count rates for Quadrant B Data is divided into 100 sec bins |
 |
 |
| Module-wise count rates for Quadrant C Data is divided into 100 sec bins |
 |
 |
| Module-wise count rates for Quadrant D Data is divided into 100 sec bins |
 |
 |
| Parameter | Plot |
|---|---|
| CZT HV Monitor | 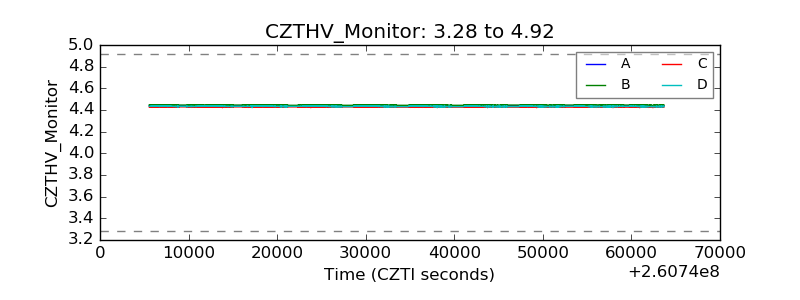 |
| D_VDD | 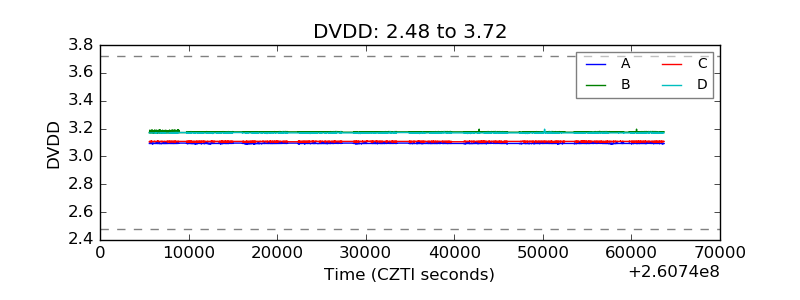 |
| Temperature 1 | 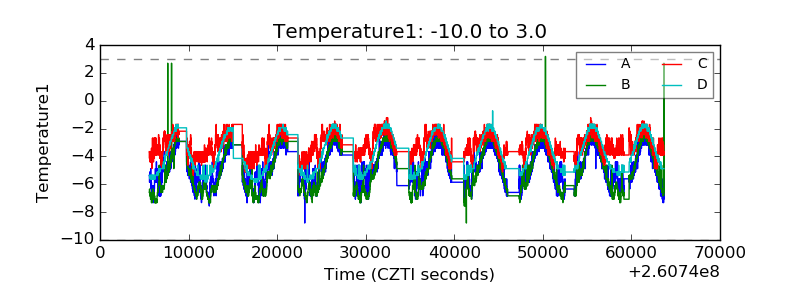 |
| Veto HV Monitor |  |
| Veto LLD | 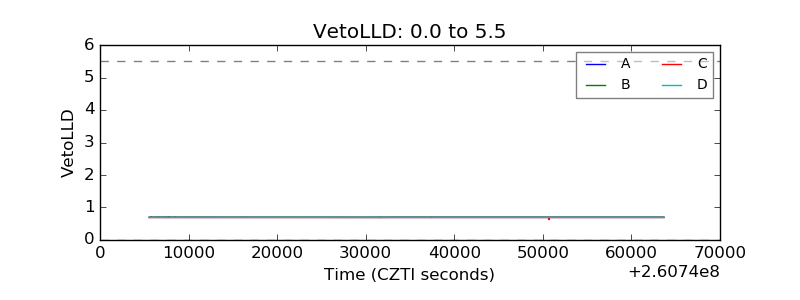 |
| Alpha Counter | 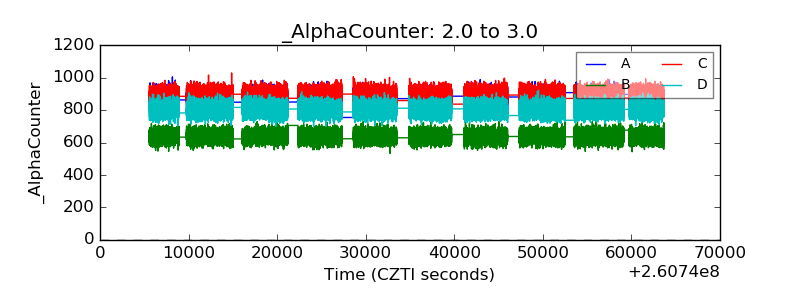 |
| _CPM_Rate | 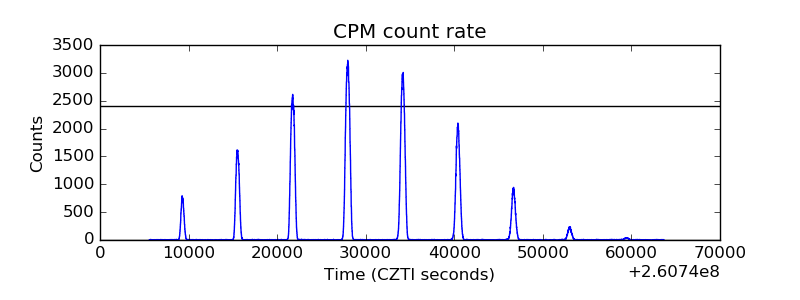 |
| CZT Counter | 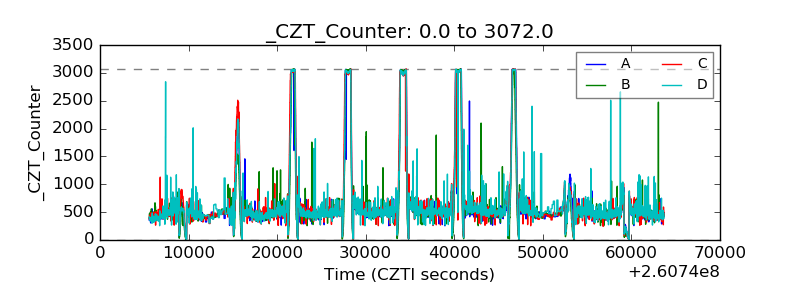 |
| +2.5 Volts monitor | 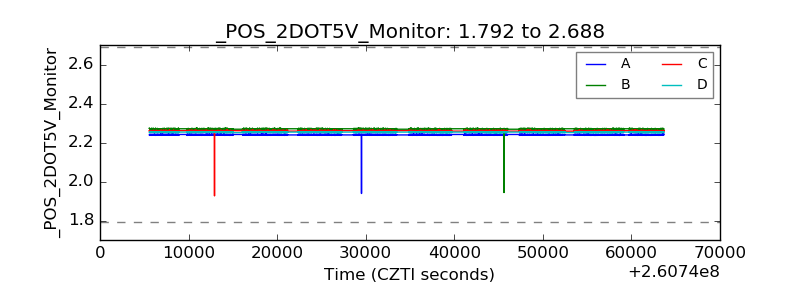 |
| +5 Volts monitor |  |
| _ROLL_ROT | 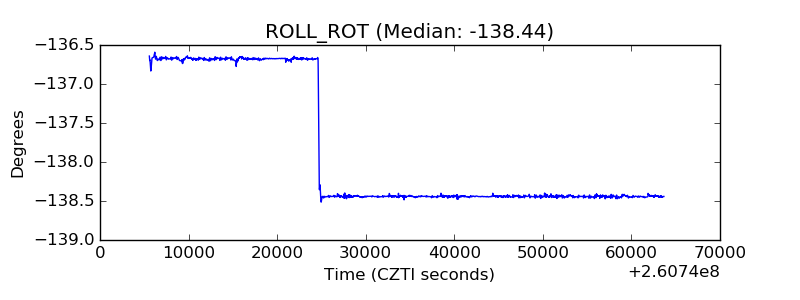 |
| _Roll_DEC | 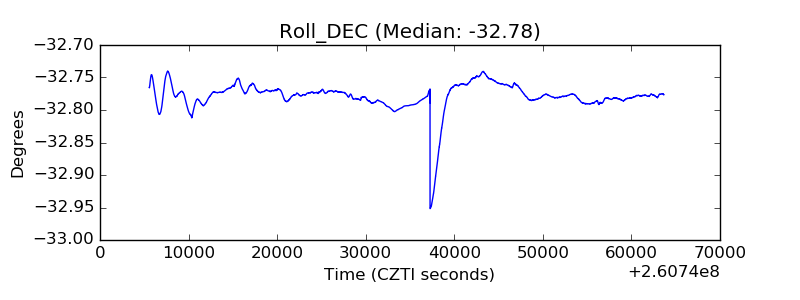 |
| _Roll_RA | 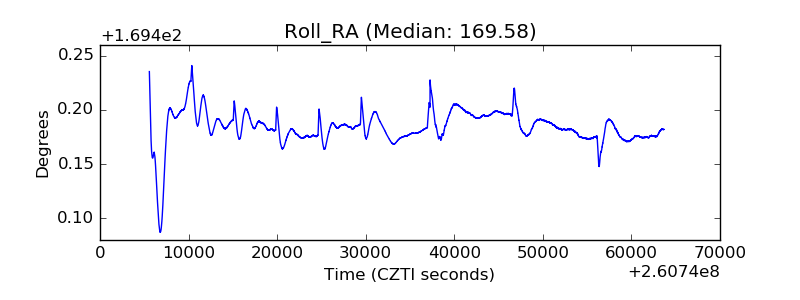 |
| Veto Counter | 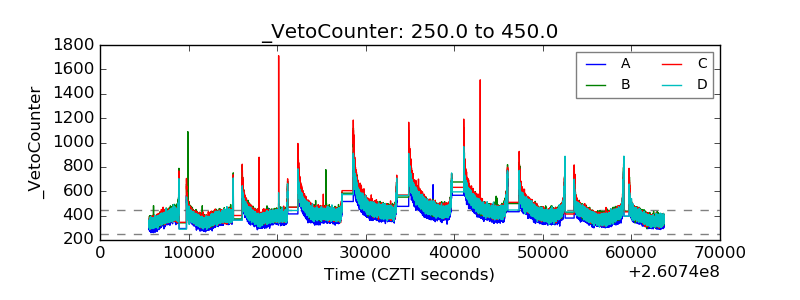 |