| Param | Original file | Final file |
|---|---|---|
| Filename | modeM0/AS1G08_083T03_9000002022_13643cztM0_level2.evt | modeM0/AS1G08_083T03_9000002022_13643cztM0_level2_quad_clean.evt |
| Size (bytes) | 308,770,560 | 52,056,000 |
| Size | 294.5 MB | 49.6 MB |
| Events in quadrant A | 2,162,395 | 318,688 |
| Events in quadrant B | 2,278,607 | 321,334 |
| Events in quadrant C | 2,273,328 | 309,537 |
| Events in quadrant D | 2,316,649 | 296,876 |
| Mode M0 | |||
|---|---|---|---|
| Quadrant | BADHDUFLAG | Total packets | Discarded packets |
| A | 0 | 9523 | 2 |
| B | 0 | 9763 | 1 |
| C | 0 | 9618 | 1 |
| D | 0 | 10054 | 1 |
| Mode M9 | |||
|---|---|---|---|
| Quadrant | BADHDUFLAG | Total packets | Discarded packets |
| A | 0 | 8 | 0 |
| B | 0 | 8 | 0 |
| C | 0 | 8 | 0 |
| D | 0 | 8 | 0 |
| Mode SS | |||
|---|---|---|---|
| Quadrant | BADHDUFLAG | Total packets | Discarded packets |
| A | 0 | 98 | 0 |
| B | 0 | 98 | 0 |
| C | 0 | 98 | 0 |
| D | 0 | 98 | 0 |
| Quadrant | Total seconds | Saturated seconds | Saturation percentage |
|---|---|---|---|
| A | 4684 | 19 | 0.405636% |
| B | 4684 | 39 | 0.832622% |
| C | 4684 | 18 | 0.384287% |
| D | 4684 | 23 | 0.491033% |
Noise dominated data is calculated using 1-second bins in cleaned event files. If a bin has >2000 counts, and if more than 50% of those come from <1% of pixels, then it is considered to be noise-dominated and hence unusable.
| Quadrant | # 1 sec bins | Bins with >0 counts | Bins with >2000 counts | High rate bins dominated by noise | Noise dominated (total time) | Noise dominated (detector-on time) | Marked lightcurve |
|---|---|---|---|---|---|---|---|
| A | 5535 | 4686 | 0 | 0 | 0.00% | 0.00% |  |
| B | 5535 | 4686 | 0 | 0 | 0.00% | 0.00% | 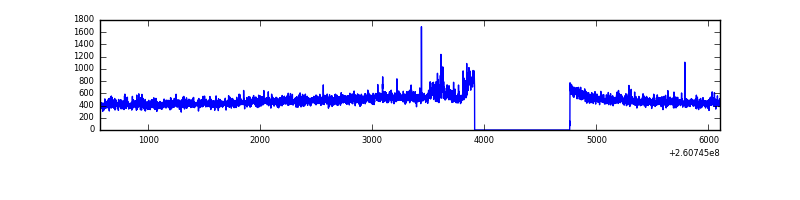 |
| C | 5535 | 4686 | 3 | 3 | 0.05% | 0.06% | 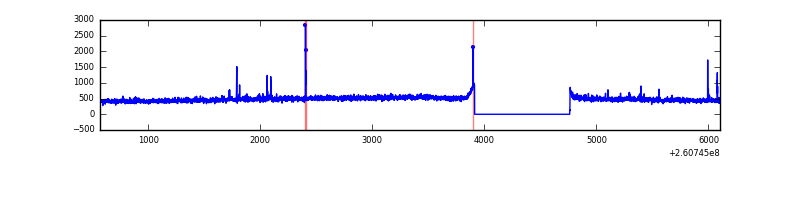 |
| D | 5535 | 4686 | 13 | 13 | 0.23% | 0.28% | 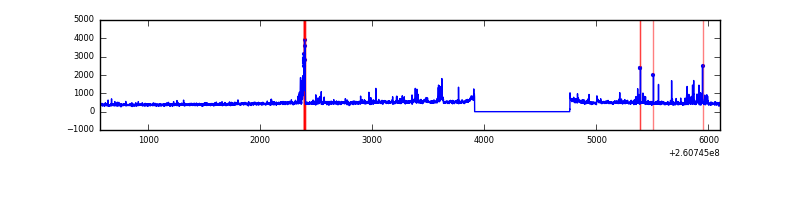 |
Top three noisy pixels from each quadrant. If the there are fewer than three noisy pixels in the level2.evt file, extra rows are filled as -1
| Pixel properties | Quadrant properties | ||||||
|---|---|---|---|---|---|---|---|
| Quadrant | DetID | PixID | Counts | Sigma | Mean | Median | Sigma |
| A | 0 | 226 | 4995 | 38.62 | 560 | 547 | 115.2 |
| A | 1 | 162 | 4430 | 33.72 | 560 | 547 | 115.2 |
| A | 12 | 194 | 4248 | 32.13 | 560 | 547 | 115.2 |
| B | 0 | 219 | 64764 | 583.59 | 562 | 548 | 110.0 |
| B | 0 | 230 | 14295 | 124.93 | 562 | 548 | 110.0 |
| B | 12 | 111 | 12886 | 112.13 | 562 | 548 | 110.0 |
| C | 3 | 233 | 126714 | 987.89 | 543 | 544 | 127.7 |
| C | 14 | 234 | 30030 | 230.87 | 543 | 544 | 127.7 |
| C | 13 | 61 | 3868 | 26.03 | 543 | 544 | 127.7 |
| D | 5 | 222 | 94726 | 722.97 | 538 | 522 | 130.3 |
| D | 13 | 249 | 77580 | 591.38 | 538 | 522 | 130.3 |
| D | 8 | 195 | 69724 | 531.09 | 538 | 522 | 130.3 |
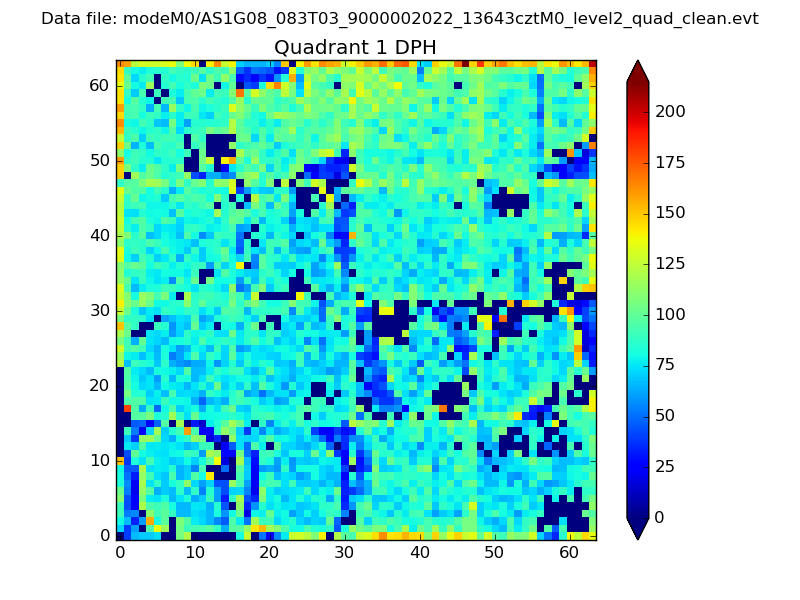
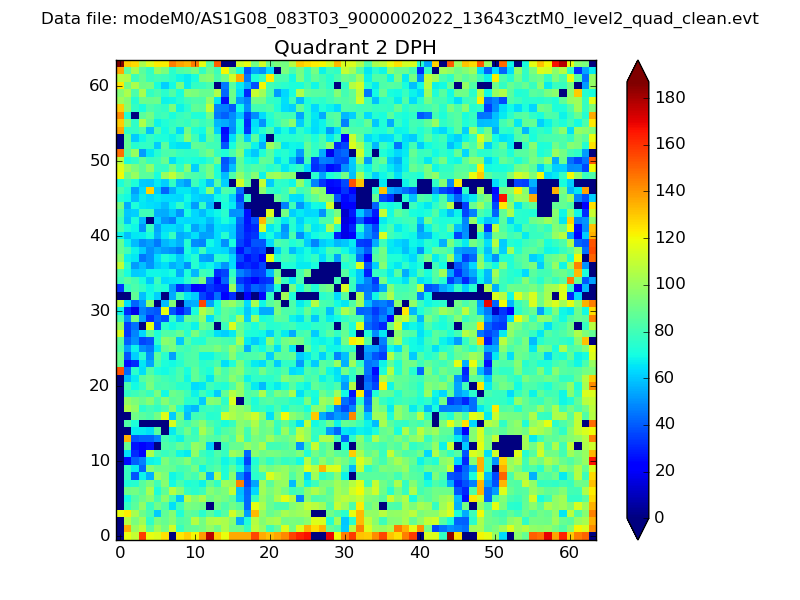
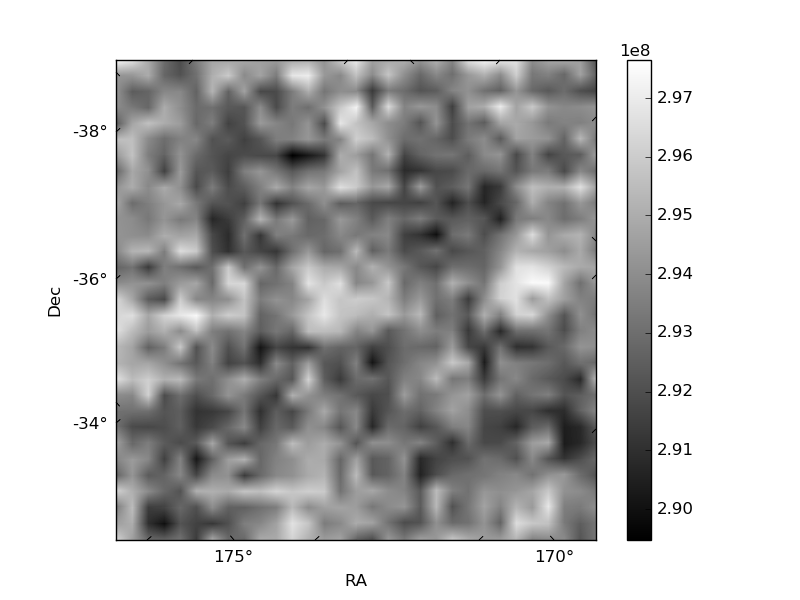
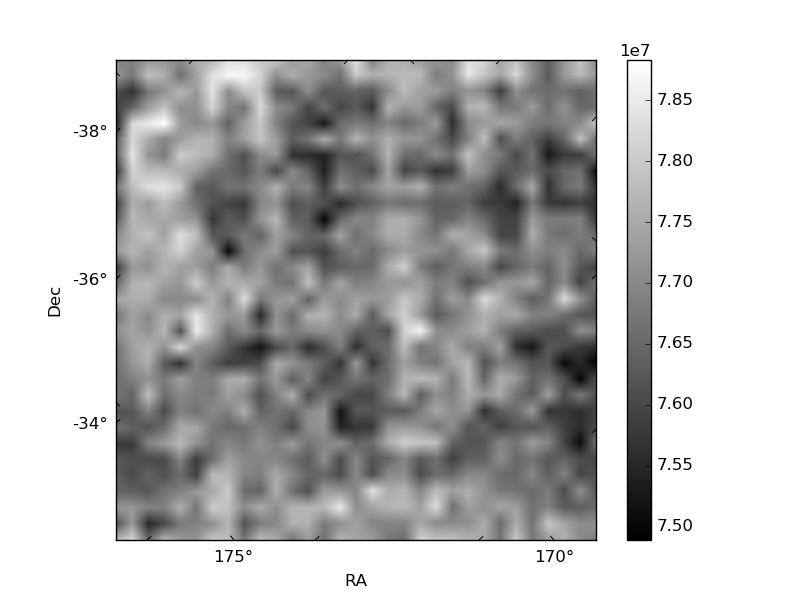
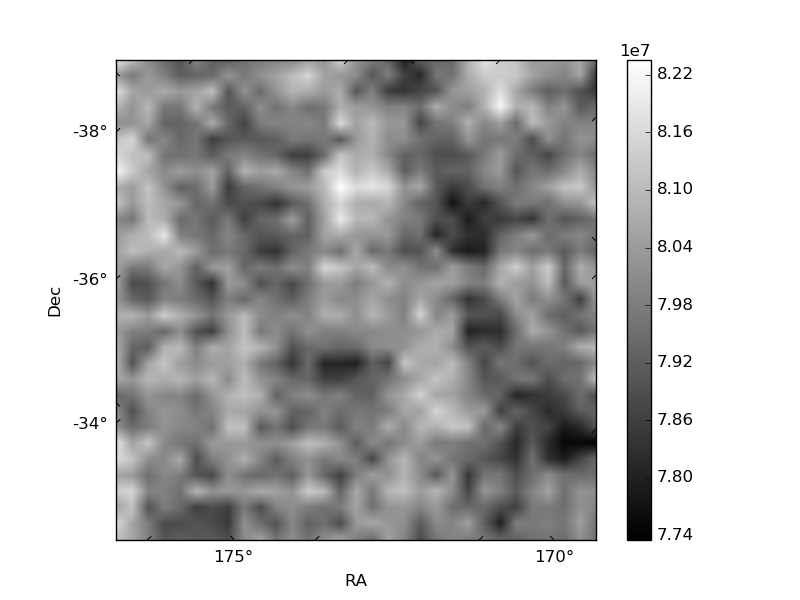
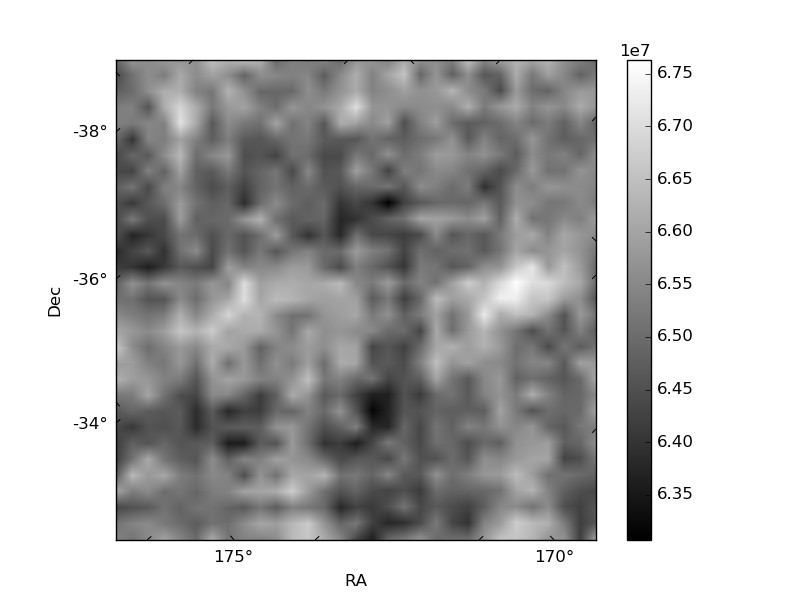
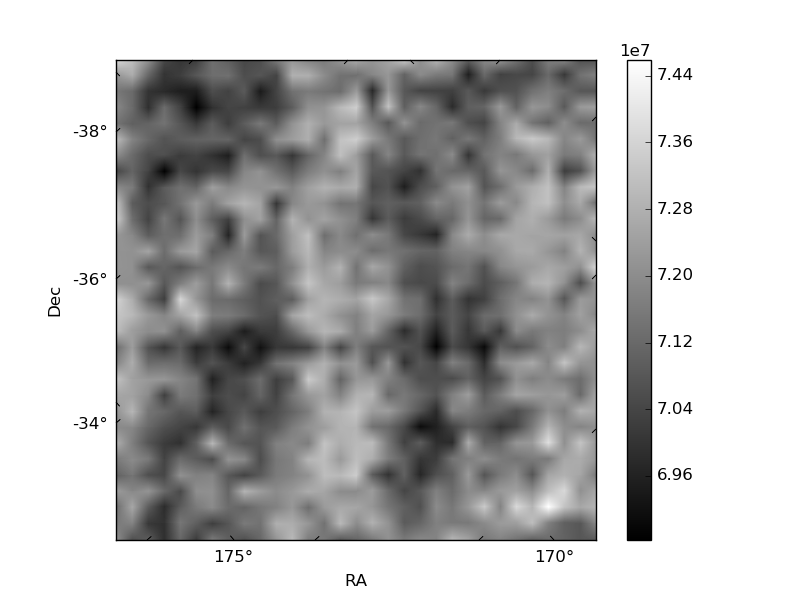
Histogram calculated using DETX and DETY for each event in the final _common_clean file
| Quadrant A | 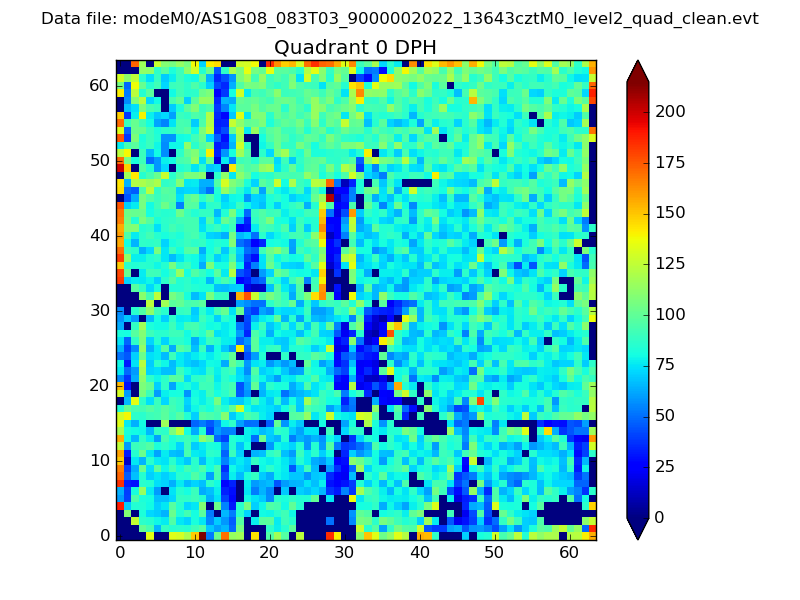 |
 |
Quadrant B |
|---|---|---|---|
| Quadrant D | 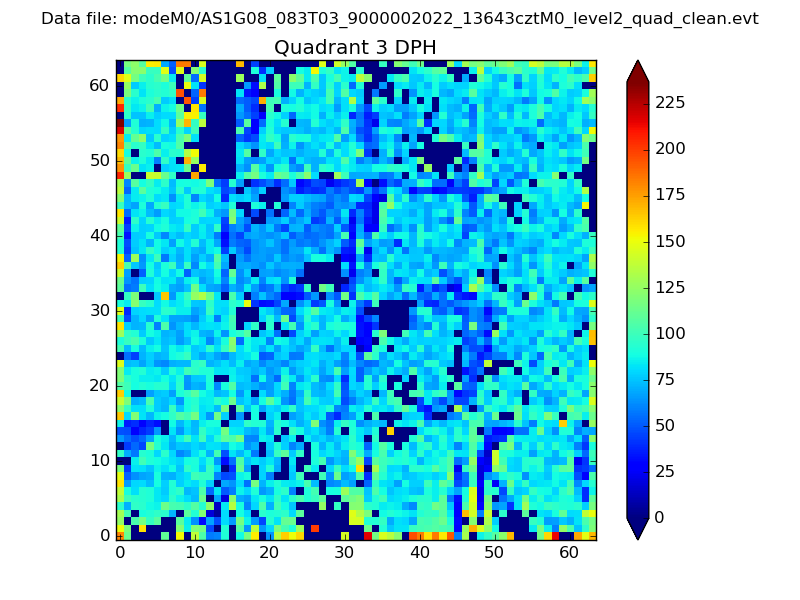 |
 |
Quadrant C |
| Plot type | Count rate plots | Images |
|---|---|---|
| Comparison with Poisson distribution Blue bars denote a histogram of data divided into 1 sec bins. Red curve is a Poisson curve with rate = median count rate of data. |
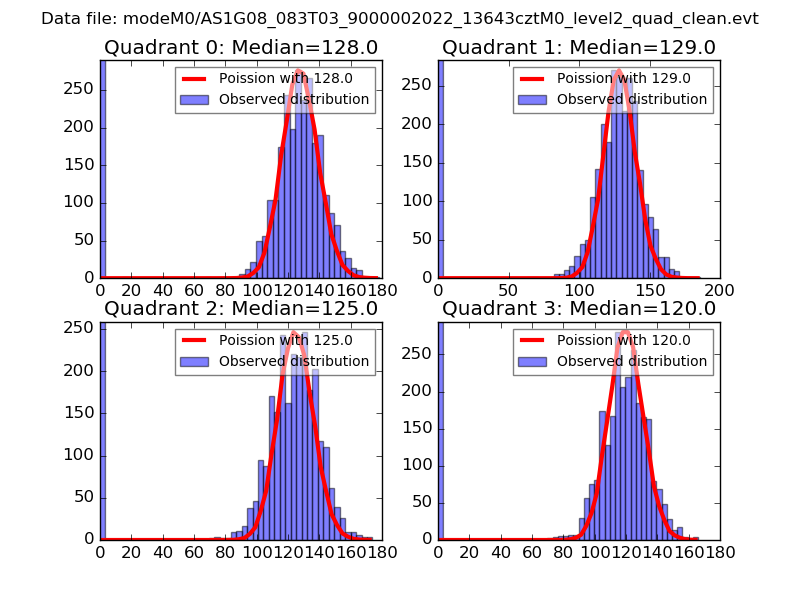 |
 |
| Quadrant-wise count rates Data is divided into 100 sec bins |
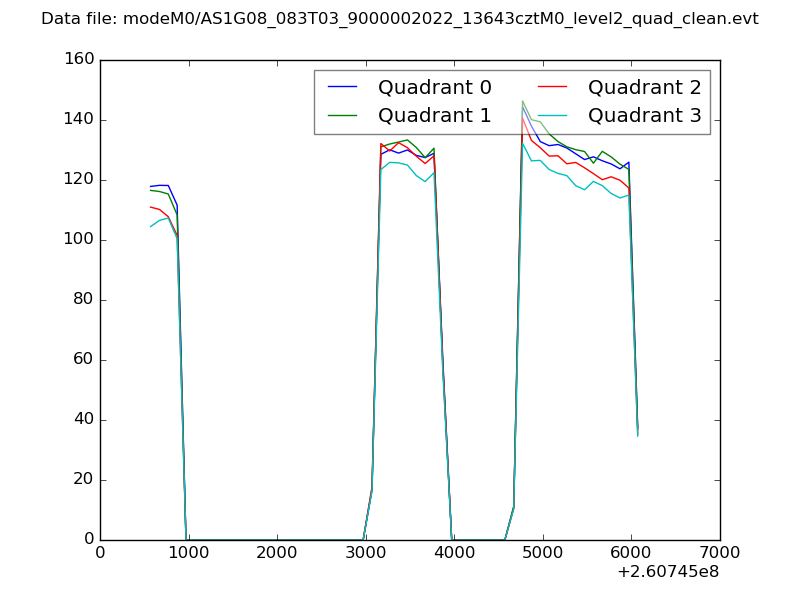 |
|
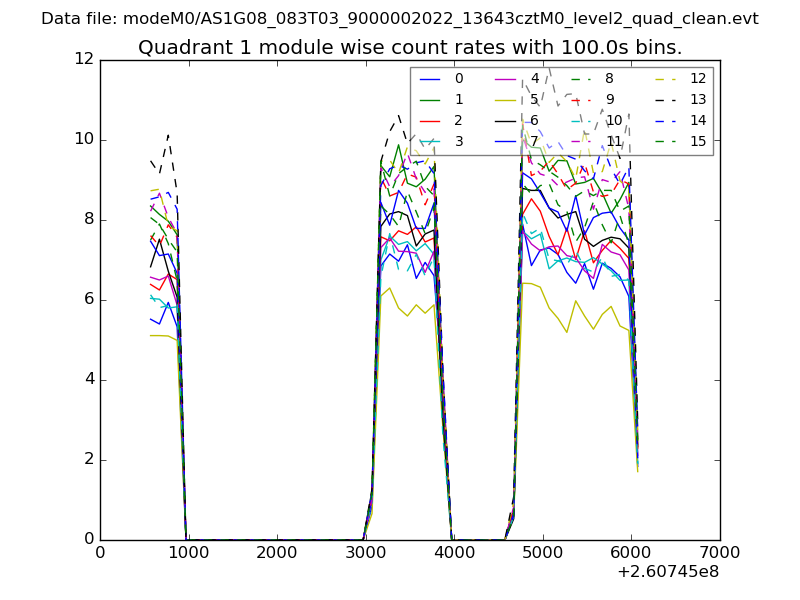
| Module-wise count rates for Quadrant A Data is divided into 100 sec bins |
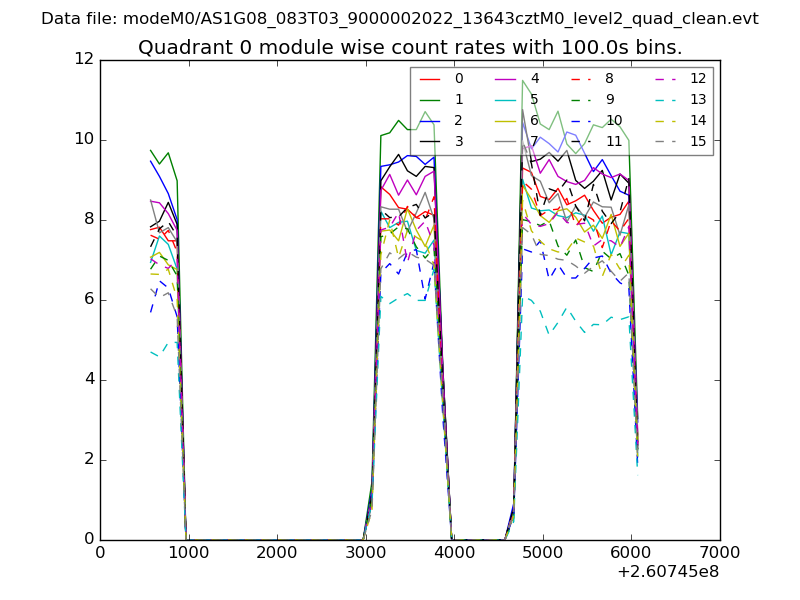 |
 |
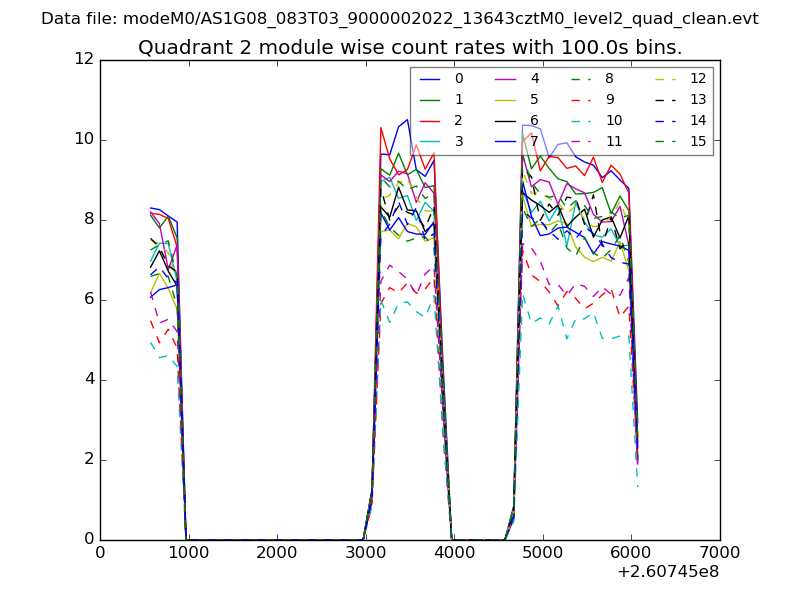
| Module-wise count rates for Quadrant B Data is divided into 100 sec bins |
 |
 |
| Module-wise count rates for Quadrant C Data is divided into 100 sec bins |
 |
 |
| Module-wise count rates for Quadrant D Data is divided into 100 sec bins |
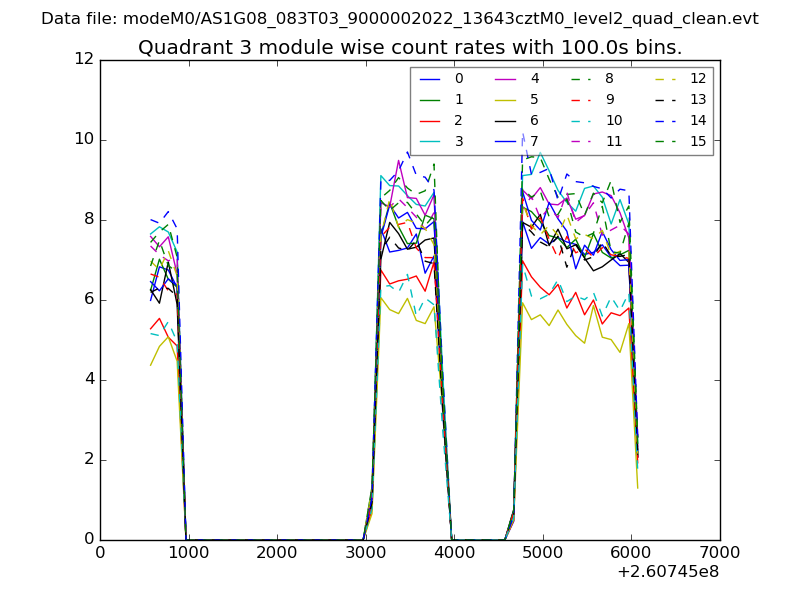 |
 |
| Parameter | Plot |
|---|---|
| CZT HV Monitor | 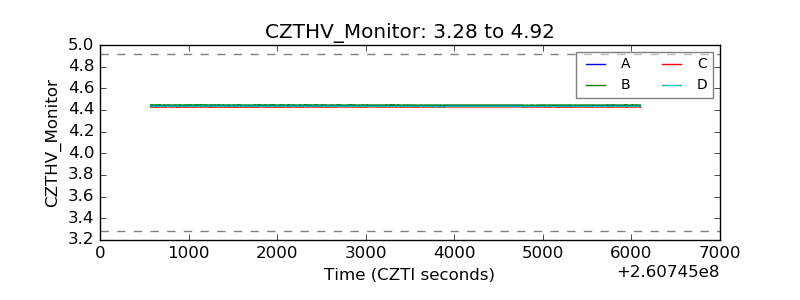 |
| D_VDD | 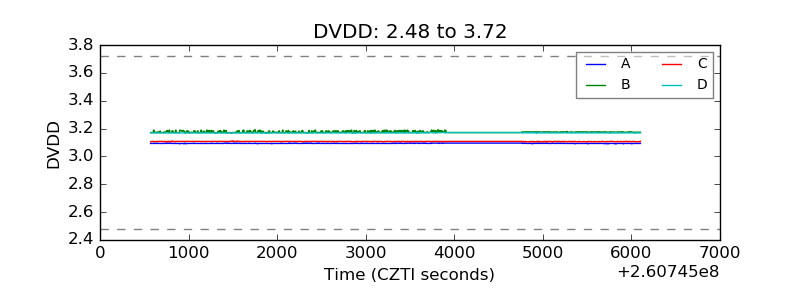 |
| Temperature 1 | 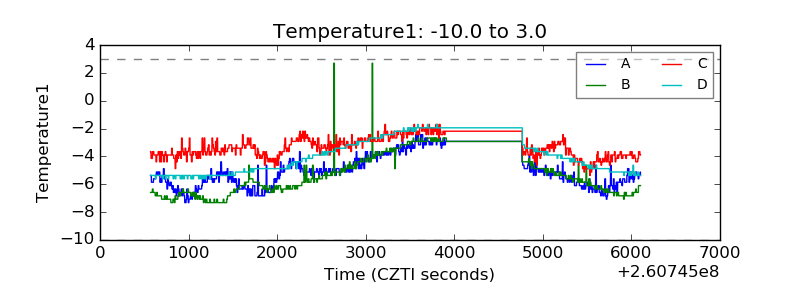 |
| Veto HV Monitor | 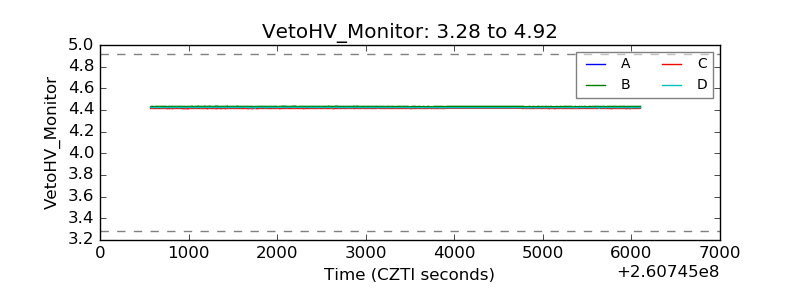 |
| Veto LLD | 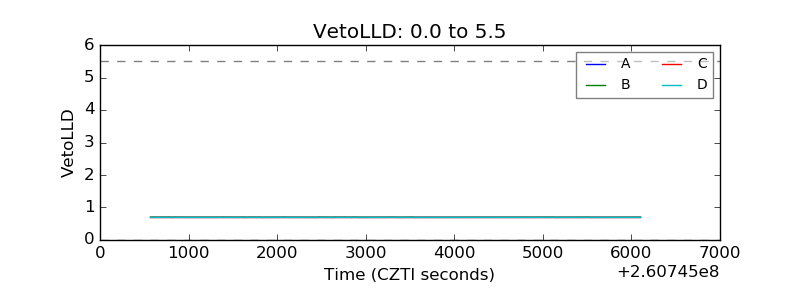 |
| Alpha Counter | 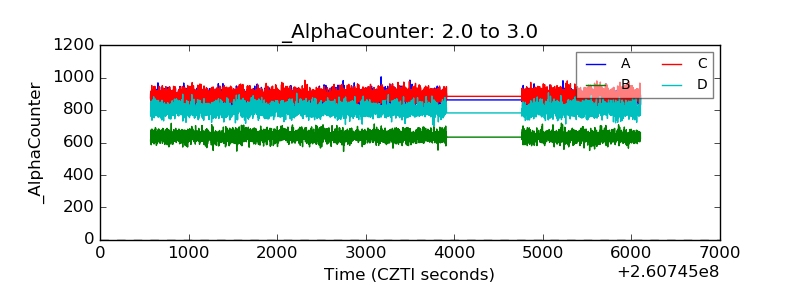 |
| _CPM_Rate | 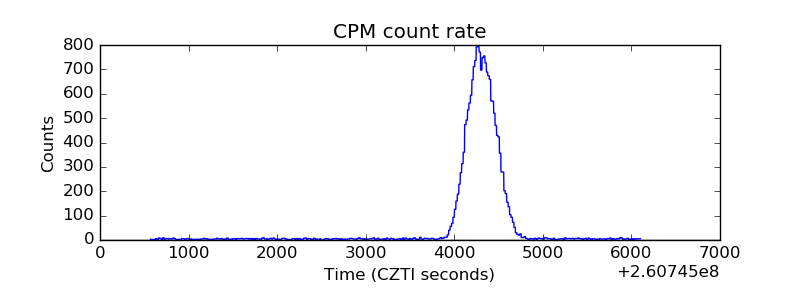 |
| CZT Counter | 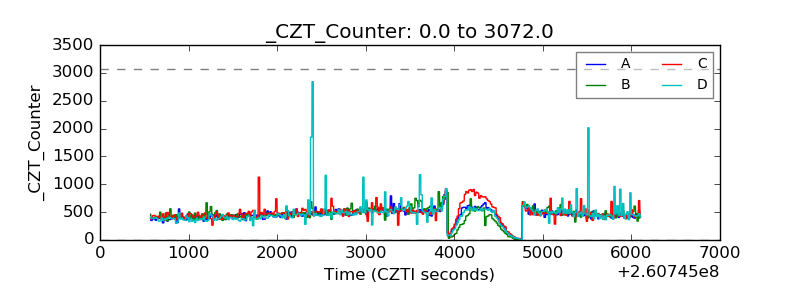 |
| +2.5 Volts monitor |  |
| +5 Volts monitor |  |
| _ROLL_ROT | 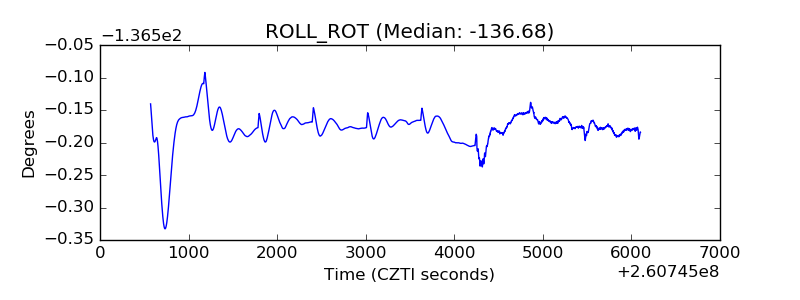 |
| _Roll_DEC |  |
| _Roll_RA | 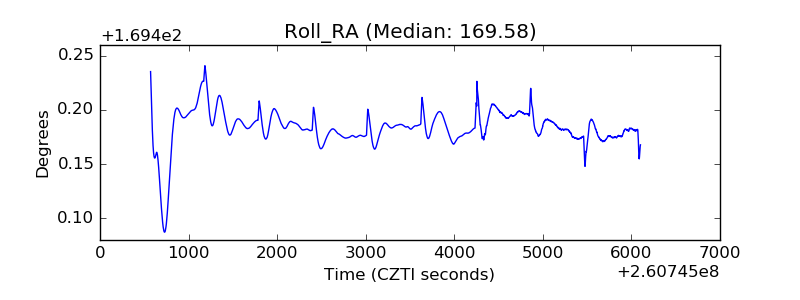 |
| Veto Counter | 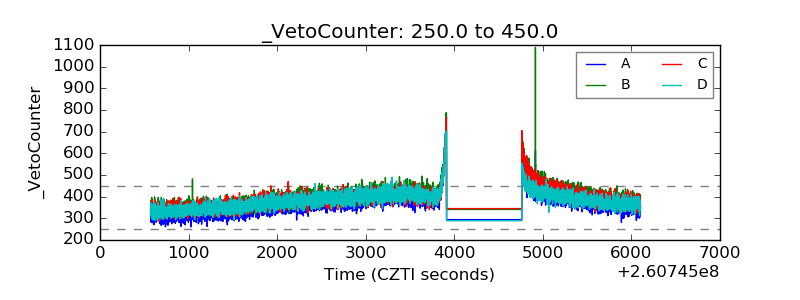 |