| Param | Original file | Final file |
|---|---|---|
| Filename | modeM0/AS1G08_083T03_9000002022_13644cztM0_level2.evt | modeM0/AS1G08_083T03_9000002022_13644cztM0_level2_quad_clean.evt |
| Size (bytes) | 449,637,120 | 92,825,280 |
| Size | 428.8 MB | 88.5 MB |
| Events in quadrant A | 3,110,388 | 595,698 |
| Events in quadrant B | 3,300,160 | 603,178 |
| Events in quadrant C | 3,265,646 | 580,988 |
| Events in quadrant D | 3,481,072 | 559,539 |
| Mode M0 | |||
|---|---|---|---|
| Quadrant | BADHDUFLAG | Total packets | Discarded packets |
| A | 0 | 13739 | 3 |
| B | 0 | 14137 | 2 |
| C | 0 | 13944 | 2 |
| D | 0 | 14712 | 2 |
| Mode M9 | |||
|---|---|---|---|
| Quadrant | BADHDUFLAG | Total packets | Discarded packets |
| A | 0 | 18 | 0 |
| B | 0 | 18 | 0 |
| C | 0 | 18 | 0 |
| D | 0 | 18 | 0 |
| Mode SS | |||
|---|---|---|---|
| Quadrant | BADHDUFLAG | Total packets | Discarded packets |
| A | 0 | 142 | 0 |
| B | 0 | 142 | 0 |
| C | 0 | 142 | 0 |
| D | 0 | 142 | 0 |
| Quadrant | Total seconds | Saturated seconds | Saturation percentage |
|---|---|---|---|
| A | 6759 | 27 | 0.399467% |
| B | 6759 | 66 | 0.976476% |
| C | 6759 | 42 | 0.621394% |
| D | 6759 | 68 | 1.006066% |
Noise dominated data is calculated using 1-second bins in cleaned event files. If a bin has >2000 counts, and if more than 50% of those come from <1% of pixels, then it is considered to be noise-dominated and hence unusable.
| Quadrant | # 1 sec bins | Bins with >0 counts | Bins with >2000 counts | High rate bins dominated by noise | Noise dominated (total time) | Noise dominated (detector-on time) | Marked lightcurve |
|---|---|---|---|---|---|---|---|
| A | 8620 | 6762 | 0 | 0 | 0.00% | 0.00% | 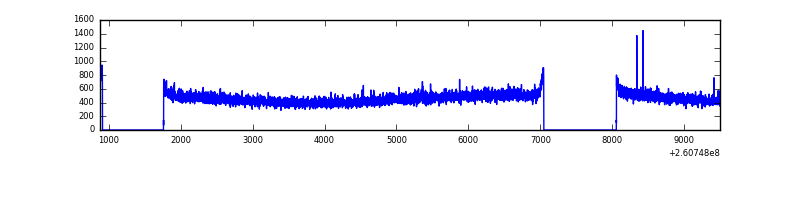 |
| B | 8620 | 6762 | 1 | 1 | 0.01% | 0.01% | 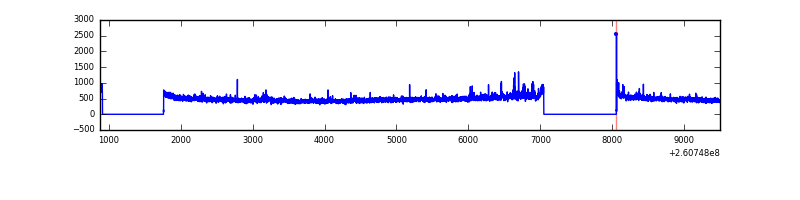 |
| C | 8620 | 6762 | 8 | 8 | 0.09% | 0.12% | 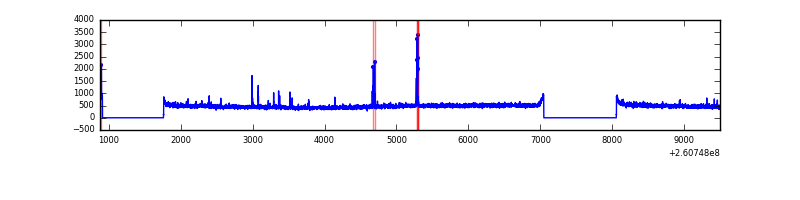 |
| D | 8620 | 6762 | 42 | 42 | 0.49% | 0.62% | 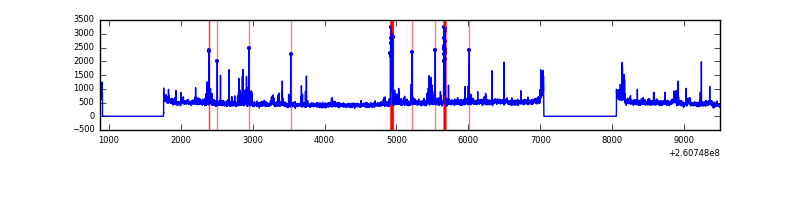 |
Top three noisy pixels from each quadrant. If the there are fewer than three noisy pixels in the level2.evt file, extra rows are filled as -1
| Pixel properties | Quadrant properties | ||||||
|---|---|---|---|---|---|---|---|
| Quadrant | DetID | PixID | Counts | Sigma | Mean | Median | Sigma |
| A | 0 | 226 | 7126 | 38.42 | 806 | 788 | 165.0 |
| A | 12 | 194 | 6100 | 32.2 | 806 | 788 | 165.0 |
| A | 1 | 162 | 6006 | 31.63 | 806 | 788 | 165.0 |
| B | 0 | 214 | 50351 | 318.0 | 809 | 789 | 155.9 |
| B | 0 | 219 | 43984 | 277.15 | 809 | 789 | 155.9 |
| B | 0 | 229 | 24200 | 150.21 | 809 | 789 | 155.9 |
| C | 3 | 233 | 163882 | 901.32 | 779 | 783 | 181.0 |
| C | 14 | 234 | 60351 | 329.19 | 779 | 783 | 181.0 |
| C | 13 | 61 | 5430 | 25.68 | 779 | 783 | 181.0 |
| D | 5 | 222 | 269445 | 1440.67 | 770 | 748 | 186.5 |
| D | 8 | 195 | 138278 | 737.39 | 770 | 748 | 186.5 |
| D | 13 | 122 | 94901 | 504.82 | 770 | 748 | 186.5 |
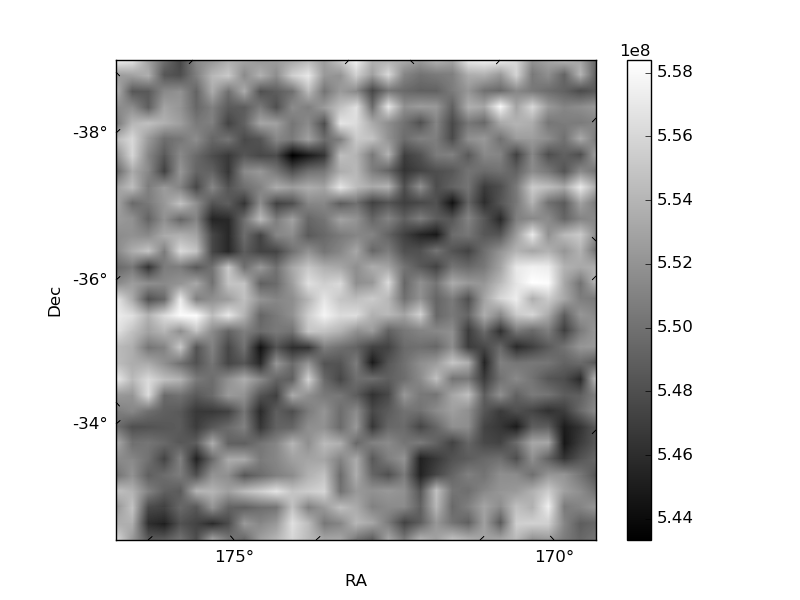
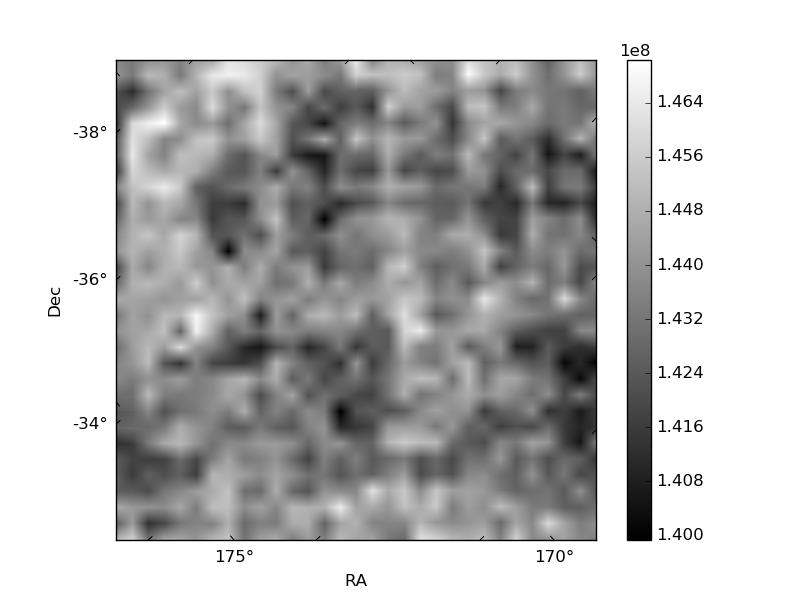
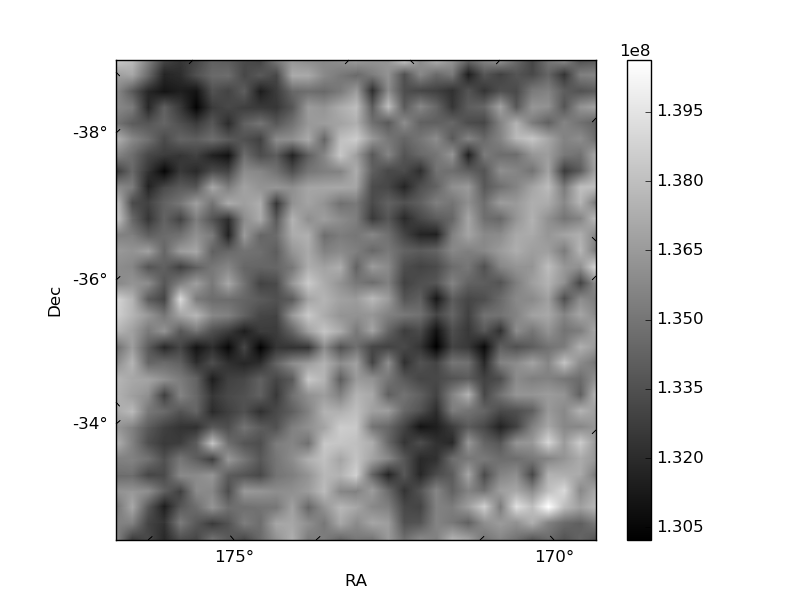
Histogram calculated using DETX and DETY for each event in the final _common_clean file
| Quadrant A | 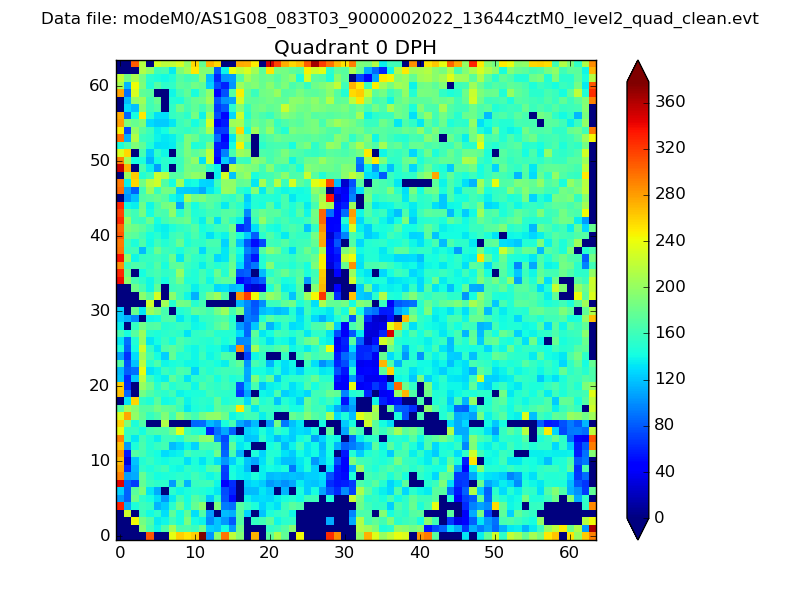 |
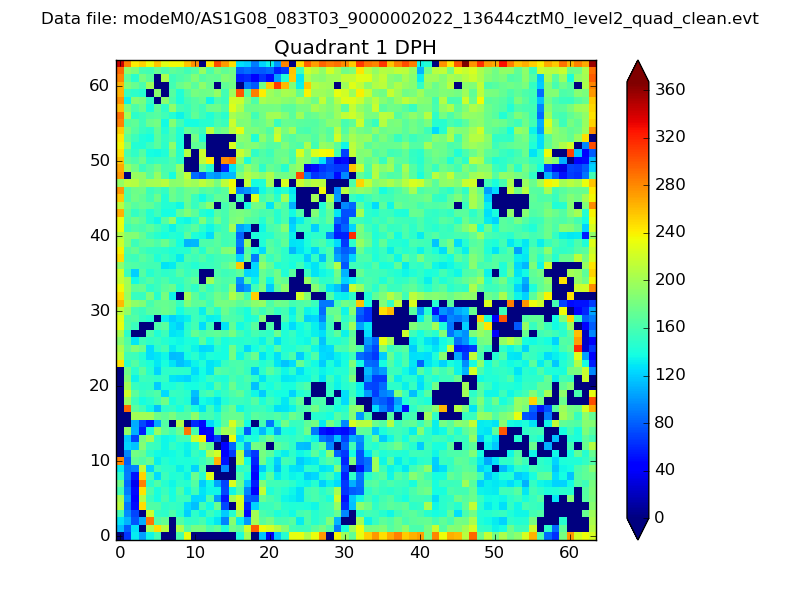 |
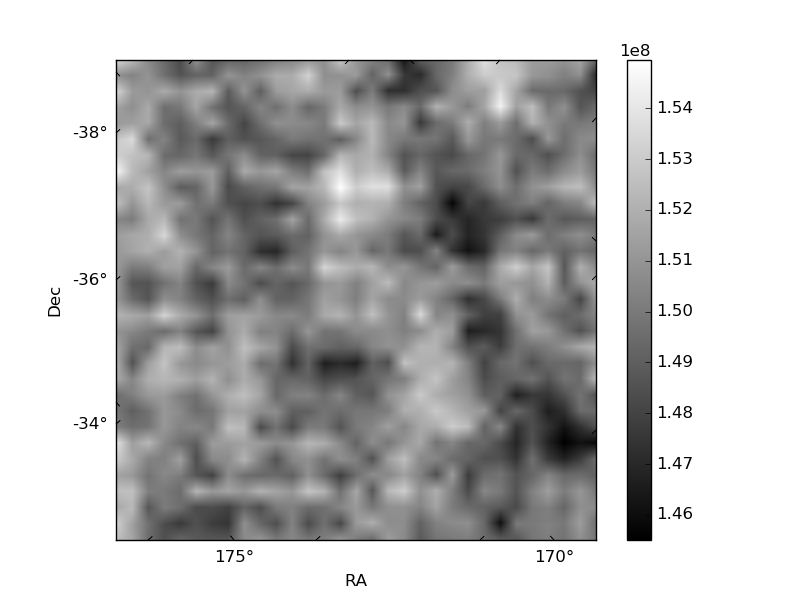
Quadrant B |
|---|---|---|---|
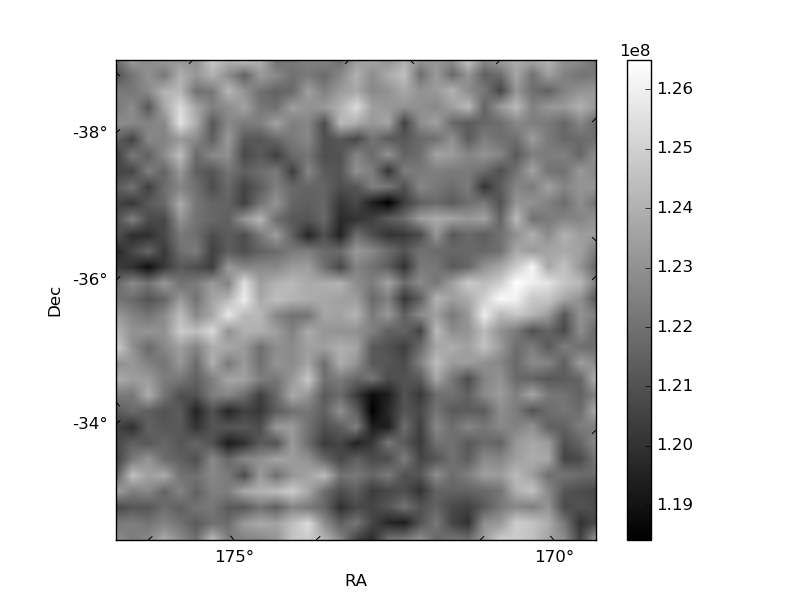
| Quadrant D | 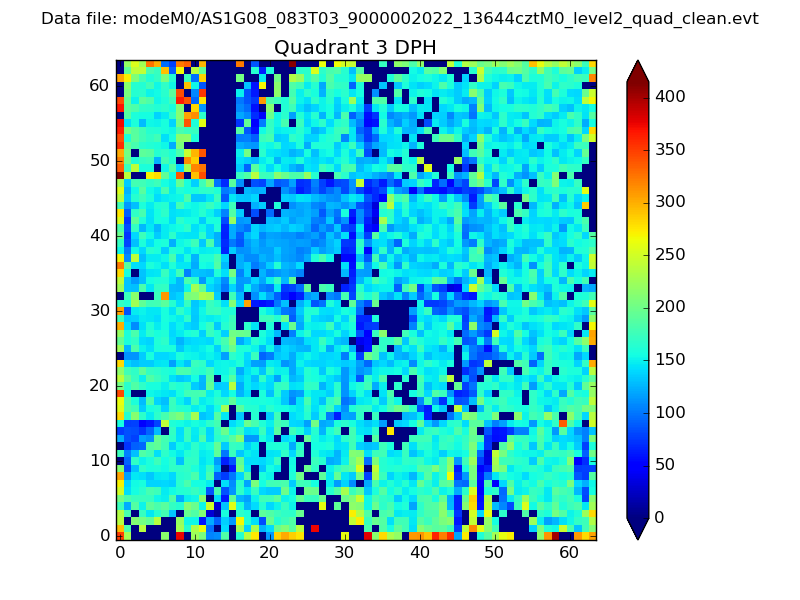 |
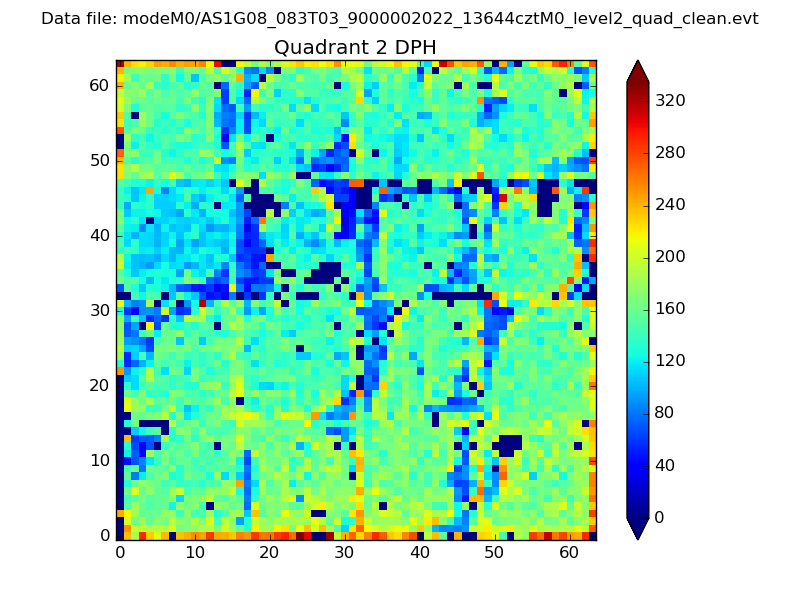 |
Quadrant C |
| Plot type | Count rate plots | Images |
|---|---|---|
| Comparison with Poisson distribution Blue bars denote a histogram of data divided into 1 sec bins. Red curve is a Poisson curve with rate = median count rate of data. |
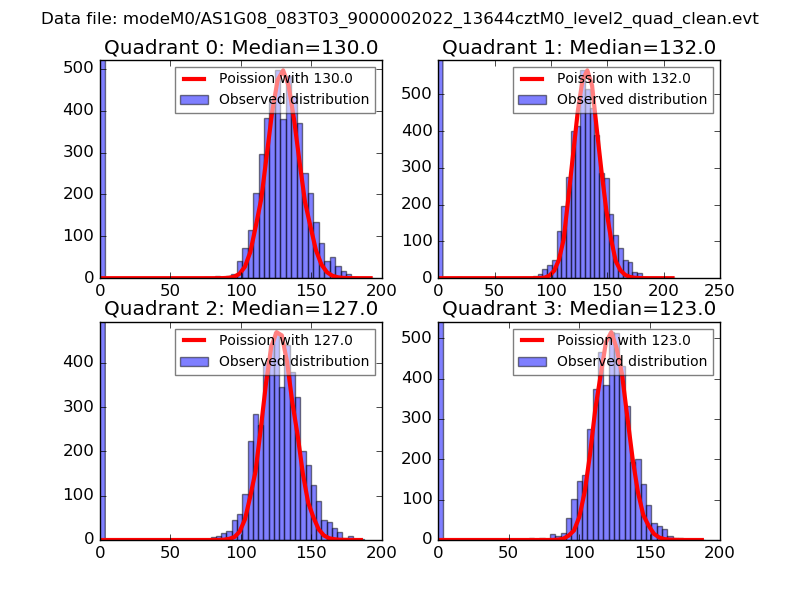 |
 |
| Quadrant-wise count rates Data is divided into 100 sec bins |
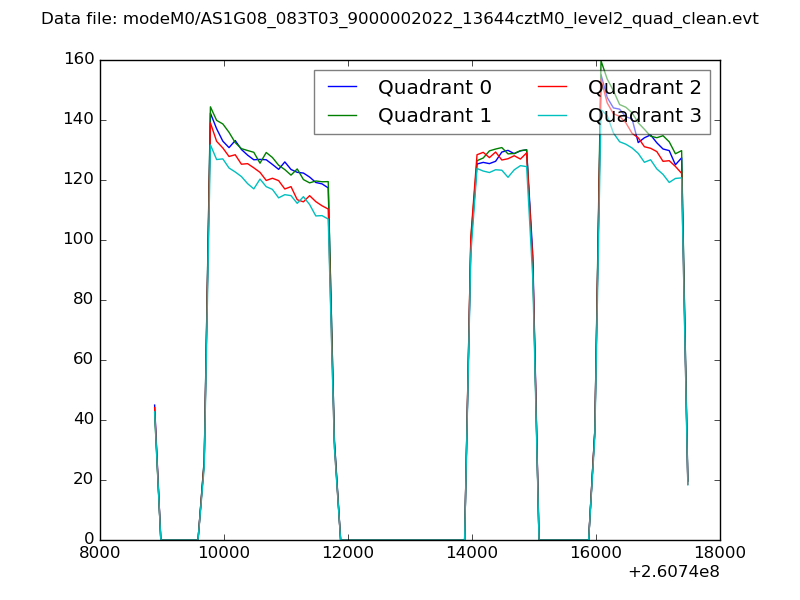 |
|
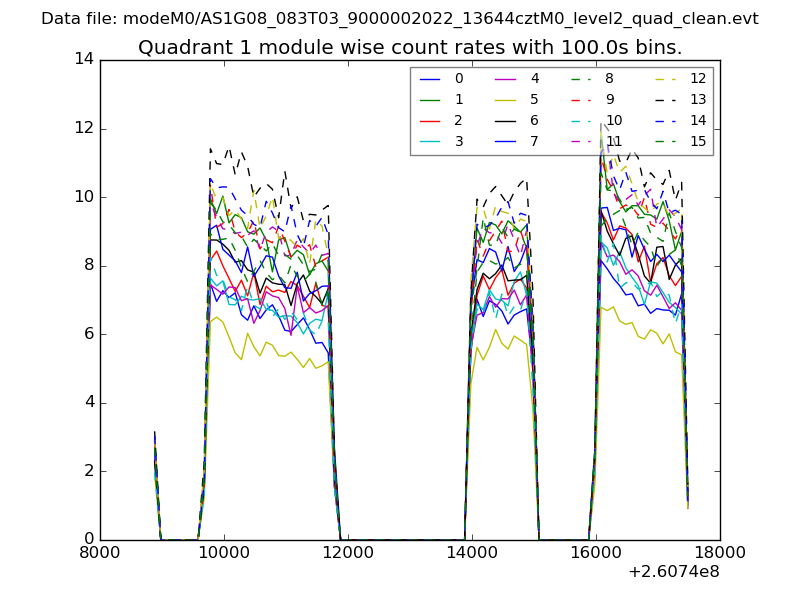
| Module-wise count rates for Quadrant A Data is divided into 100 sec bins |
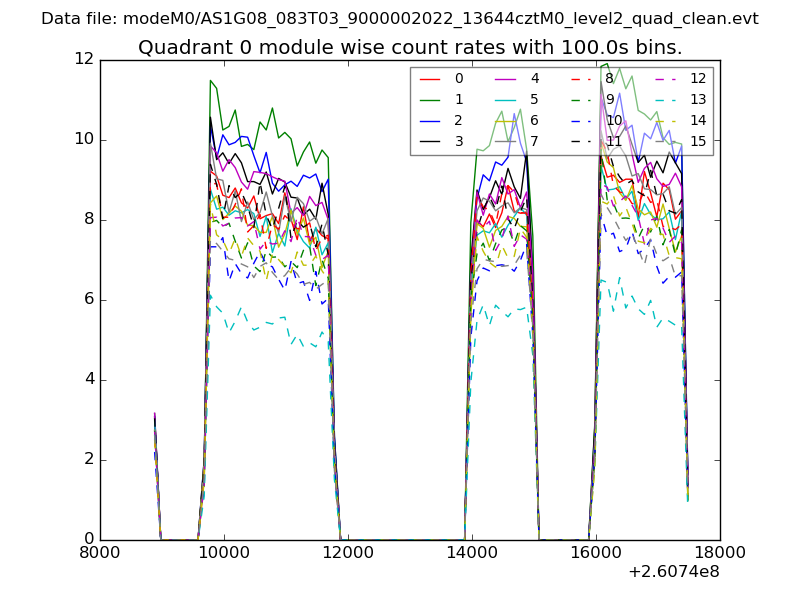 |
 |
| Module-wise count rates for Quadrant B Data is divided into 100 sec bins |
 |
 |
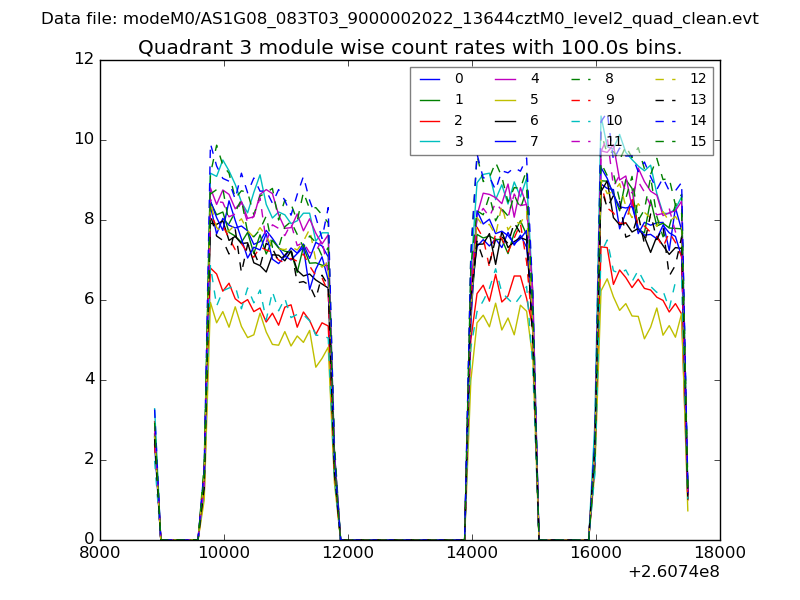
| Module-wise count rates for Quadrant C Data is divided into 100 sec bins |
 |
 |
| Module-wise count rates for Quadrant D Data is divided into 100 sec bins |
 |
 |
| Parameter | Plot |
|---|---|
| CZT HV Monitor |  |
| D_VDD | 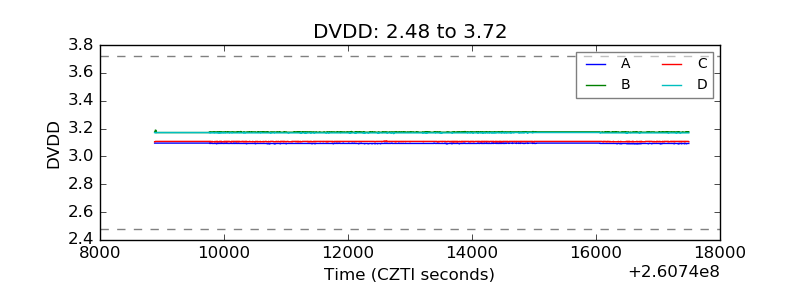 |
| Temperature 1 | 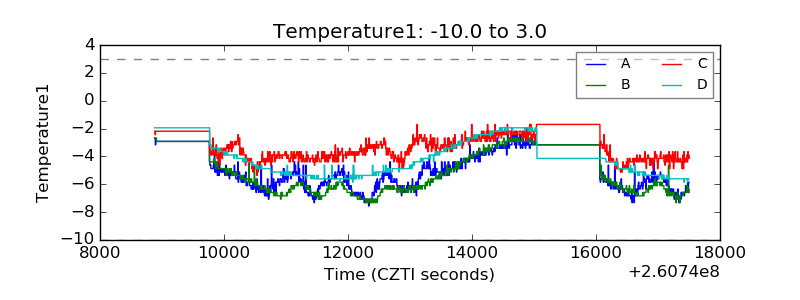 |
| Veto HV Monitor | 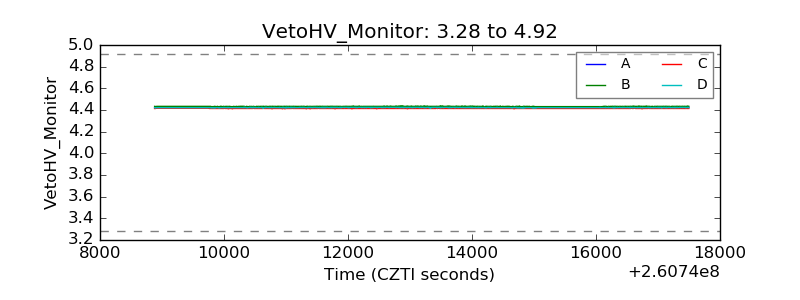 |
| Veto LLD | 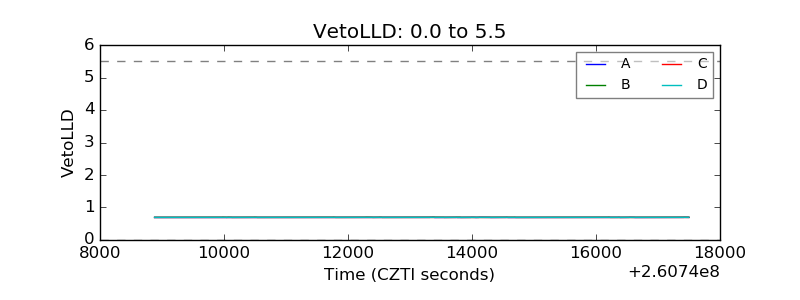 |
| Alpha Counter | 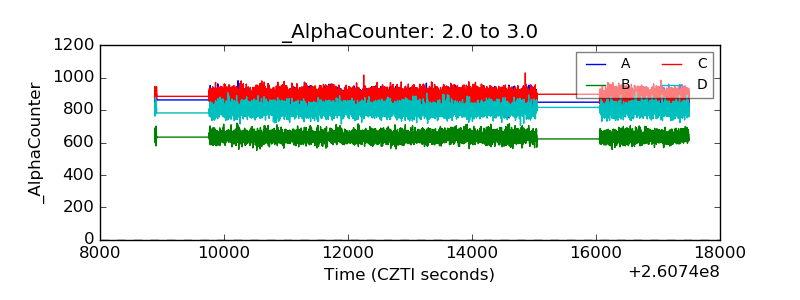 |
| _CPM_Rate | 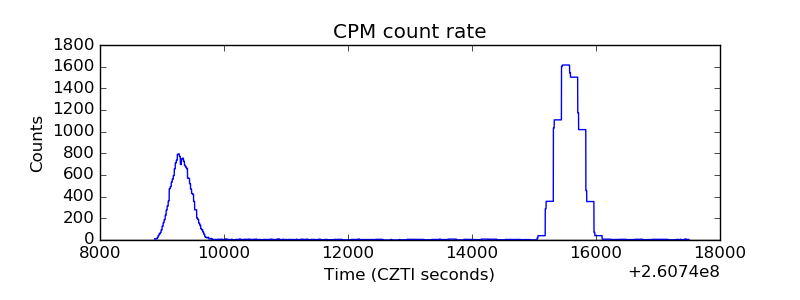 |
| CZT Counter | 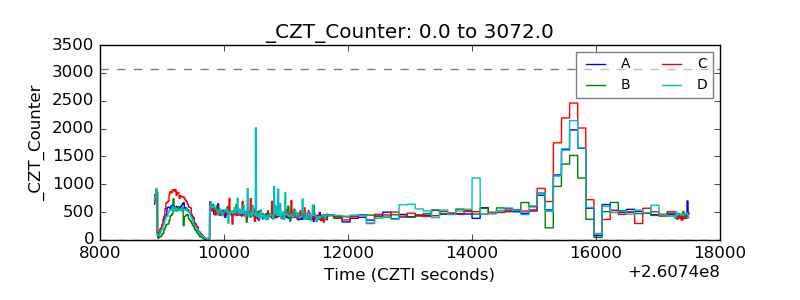 |
| +2.5 Volts monitor |  |
| +5 Volts monitor |  |
| _ROLL_ROT | 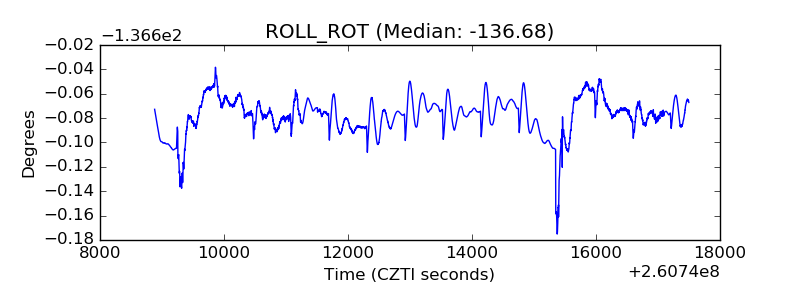 |
| _Roll_DEC | 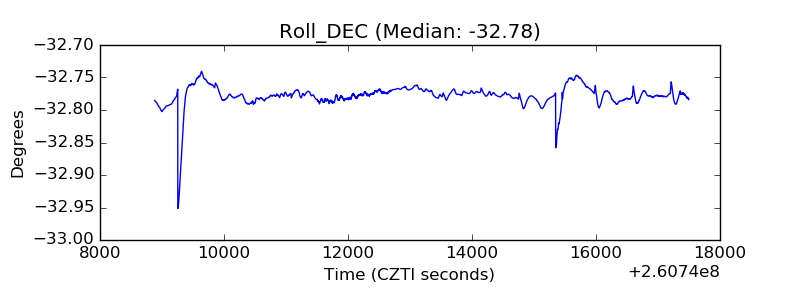 |
| _Roll_RA | 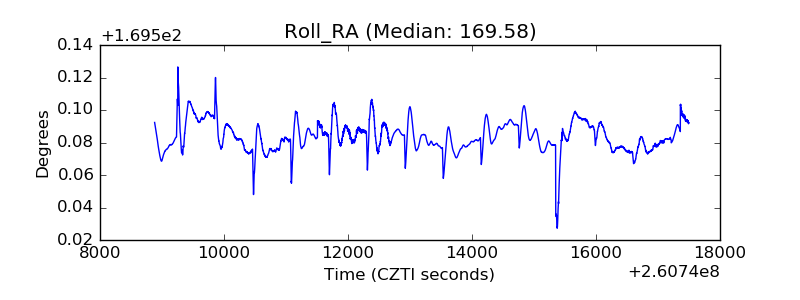 |
| Veto Counter | 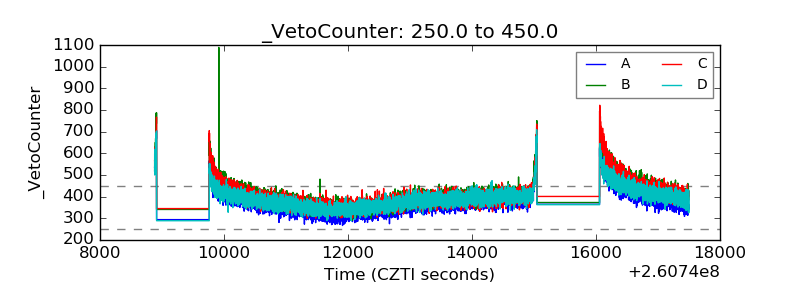 |